3450
Longitudinal Assessment of Visceral and Subcutaneous Adipose Tissue in Obese Patients undergoing Weight Loss Surgery1Radiology, University of Wisconsin, Madison, WI, United States, 2Electrical Engineering, Pontificia Universidad Catolica de Chile, Santiago, Chile, 3Diagnostic Imaging, St. Jude Children's Research Hospital, Memphis, TN, United States, 4Surgery, University of Wisconsin, Madison, WI, United States, 5Surgery, Virginia Commonwealth University, Richmond, VA, United States, 6Radiology, Pontificia Universidad Catolica de Chile, Santiago, Chile, 7Biomedical Imaging Center, Pontificia Universidad Catolica de Chile, Santiago, Chile, 8Radiology, University of California, San Diego, CA, United States, 9Medical Physics, University of Wisconsin, Madison, WI, United States, 10Medicine, University of Wisconsin, Madison, WI, United States, 11Emergency Medicine, University of Wisconsin, Madison, WI, United States, 12Biomedical Engineering, University of Wisconsin, Madison, WI, United States
Synopsis
This work monitored longitudinal changes in visceral (VAT) and subcutaneous (SCAT) adipose tissue in response to weight loss. Twenty-one patients undergoing clinical weight loss surgery (WLS) were recruited for 5 MRI studies: 2-3 weeks prior, 1 day prior to WLS and 1, 3, and 6 months post-WLS. Single breath-hold, chemical shift encoded acquisitions were analyzed using an Osirix semi-automated segmentation software to monitor changes in VAT and SCAT volumes. Continual reductions in VAT and SCAT were measured over the five visits. At every visit, each patient’s relative body fat distribution remained relatively constant despite overall reductions in both VAT and SCAT.
Introduction
The rising incidence of obesity and metabolic syndrome has motivated a need to understand the clinical implications of body fat distribution. Abnormally high intra-abdominal visceral adipose tissue (VAT) has garnered significant attention due to its association with metabolic syndrome1, a set of conditions that in combination increase the risk of cardiovascular disease and diabetes. Volumetric 3D-MRI methods including chemical shift encoded MRI (CSE-MRI)2-4 have been proposed as quantitative measures of the volume of each fat deposit type, including VAT and subcutaneous adipose tissue (SCAT). The purpose of this work was to characterize longitudinal changes in VAT and SCAT in response to weight loss surgery (WLS).Methods
Patients undergoing clinical WLS (sleeve gastrectomy or Roux-en-Y gastric bypass) were recruited for IRB-approved and HIPAA compliant MRI exams at five time points: 1-3 weeks prior to WLS (Visit 1, start of pre-operative very low calorie diet), 1-2 days prior to WLS (Visit 2, post very low calorie diet) and 1, 3, and 6 months post WLS (Visits 3-5). At each time points, physical measurements including weight, BMI, and waist circumference (WC) were collected.
3D CSE-MRI images of the entire abdominopelvic cavity was acquired at each time point. Imaging was performed at 1.5T or 3T (MR450w and MR750, GE Healthcare, Waukesha, WI). Imaging parameters included (1.5T/3T): sagittal plane, 6 echoes, TR= 8.3/7.5ms, TE1= 0.7/0.9ms, ΔTE= 1.2ms/1.1ms, flip angle = 5°/3°, resolution= 3.5x3.5x4 /3.2x3.2x3mm, field of view= 50.0x45.0x46.4 /48.0x38.4x46.8 cm, acceleration factor=2x2/2x3, acquisition time=25s/22s.
SCAT, VAT, and total adipose tissue (TAT) volumes were measured from the bottom of the L4 to top of the T10 vertebral bodies, were measured using a validated, semi-automated Osirix plugin, which is based on a customized version of PyOsirix5 and a modified version of the method proposed by Addeman et al.4
Results
21 patients (19 females, 2 males, age=48.0±12.1years ) were successfully recruited. Patients came for all 5 visits except for one patient who only came to Visits 1 – 4. Furthermore, 3 datasets were excluded due to imaging artifacts.
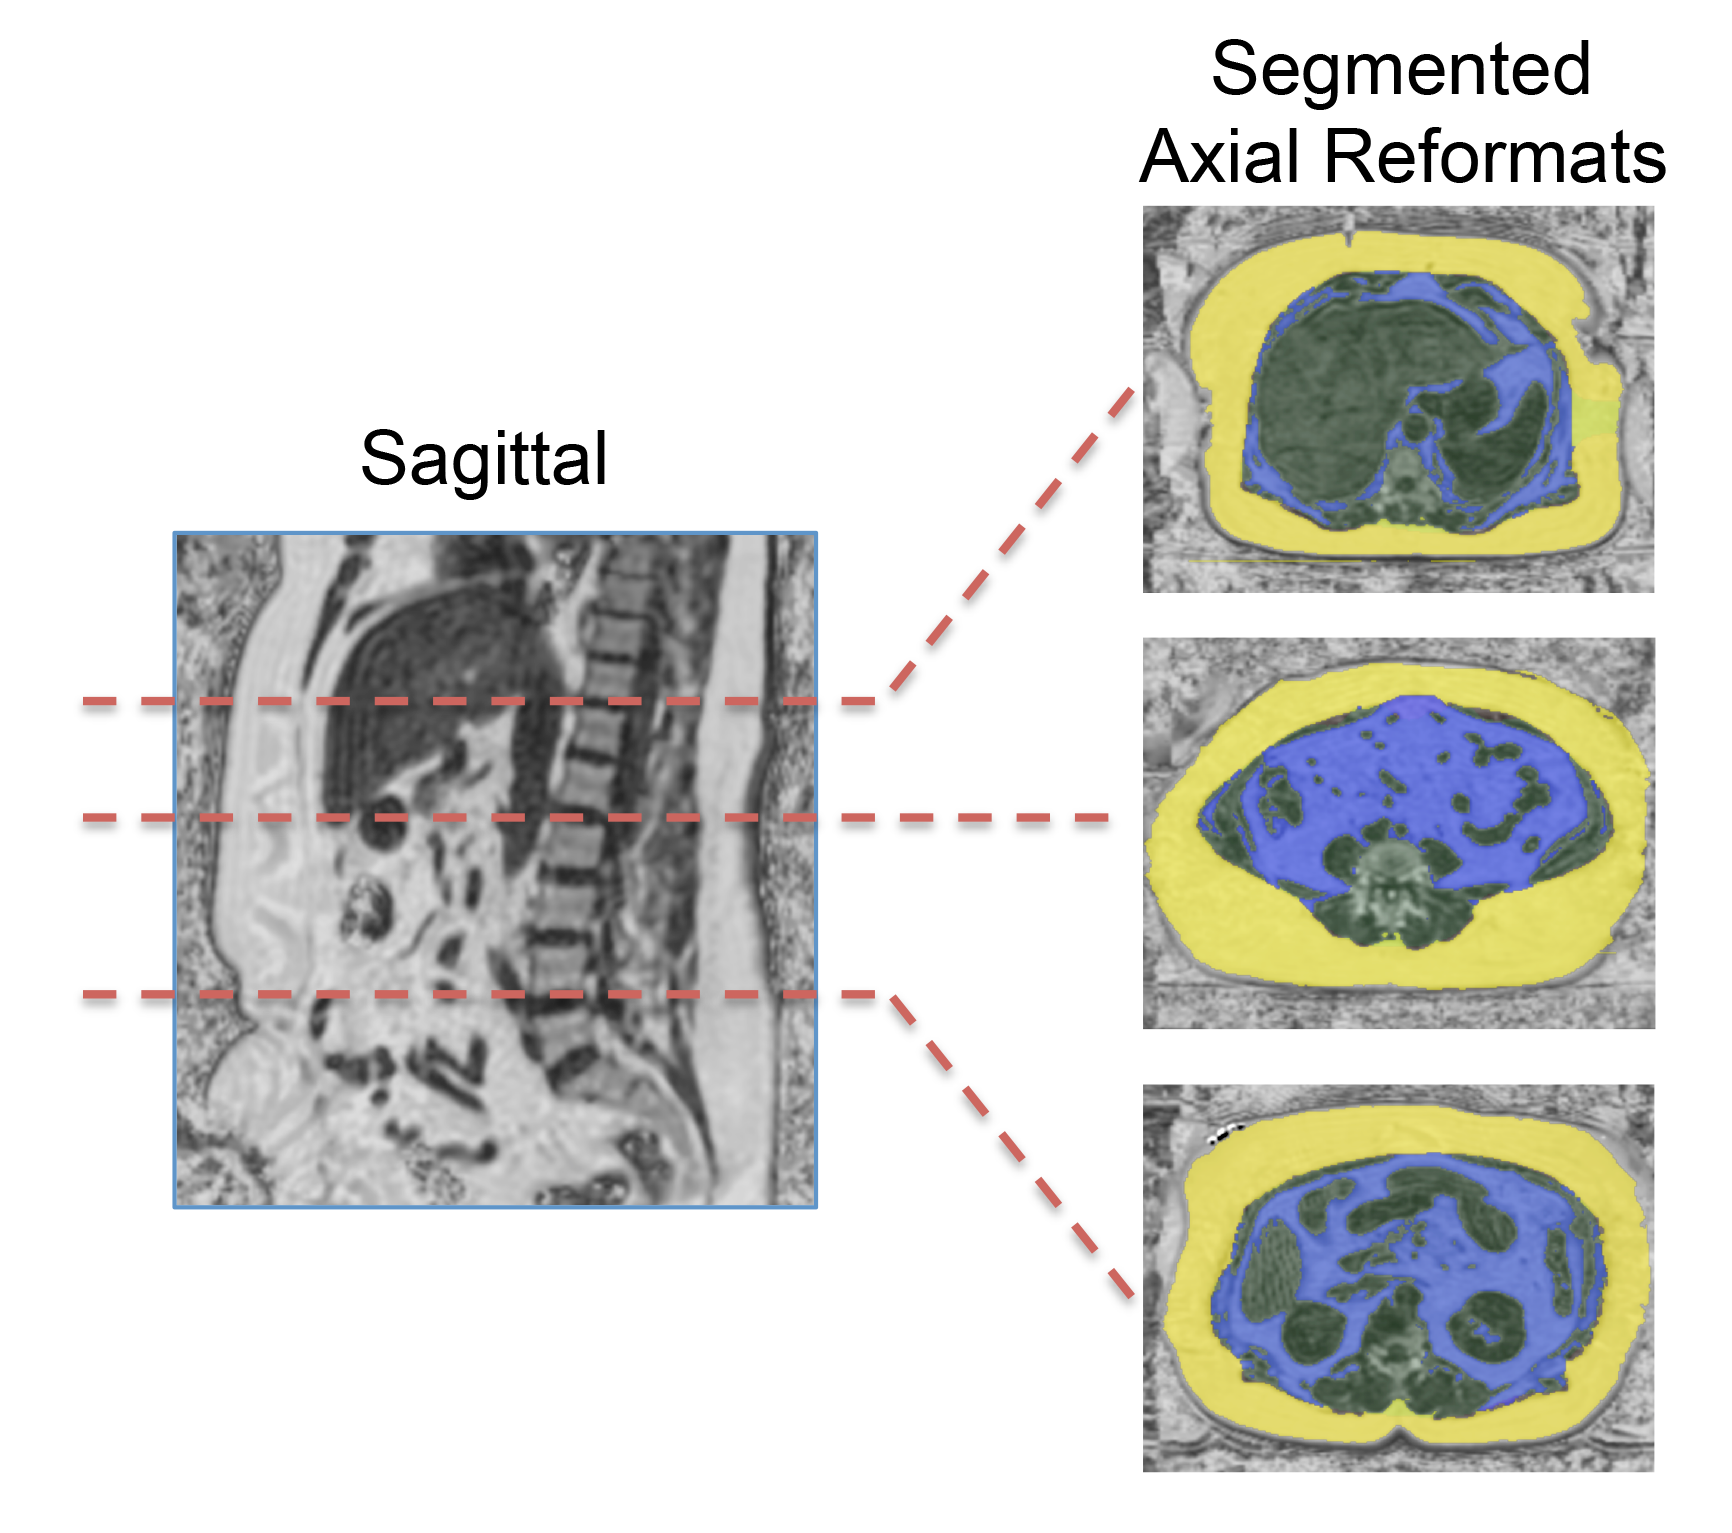
A sagittal fat fraction image and axial reformats at the L4-L5, L1-L2, and T10-T11 vertebral disks of a representative WLS patient are shown in Figure 1. This figure demonstrated the feasibility to make volumetric measurements of the SCAT and VAT in obese patients from a single breath-hold CSE-MRI acquisition.
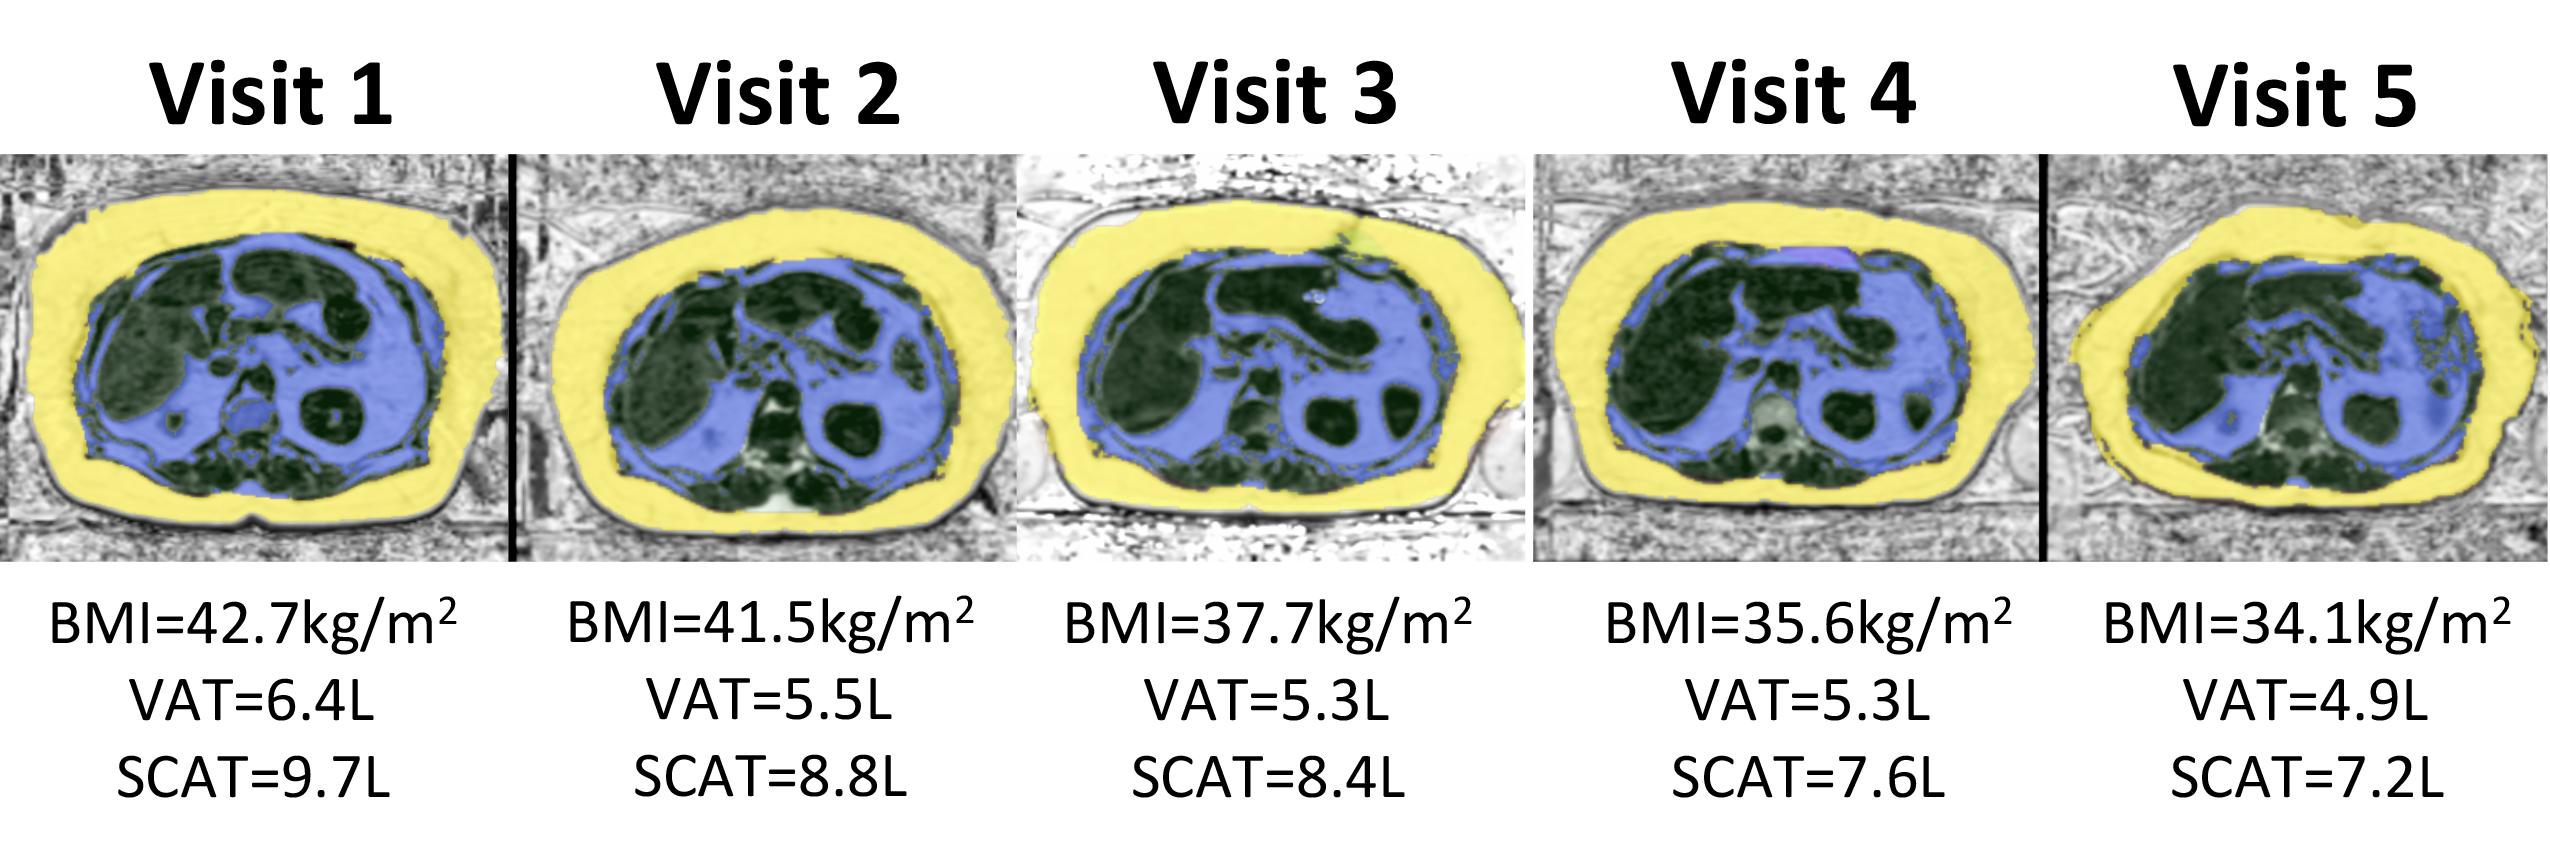
Figure 2 demonstrates the longitudinal monitoring of each fat deposit using segmented CSE-MRI in a representative WLS patient. A segmented single axial slice is shown at each visit. In this patient, continual reductions in BMI, VAT and SCAT were measure throughout subsequent visits, culminating in a net reduction in BMI of 8.6kg/m2, VAT of 1.5L, and SCAT of 2.5L between Visits 1 and 5.
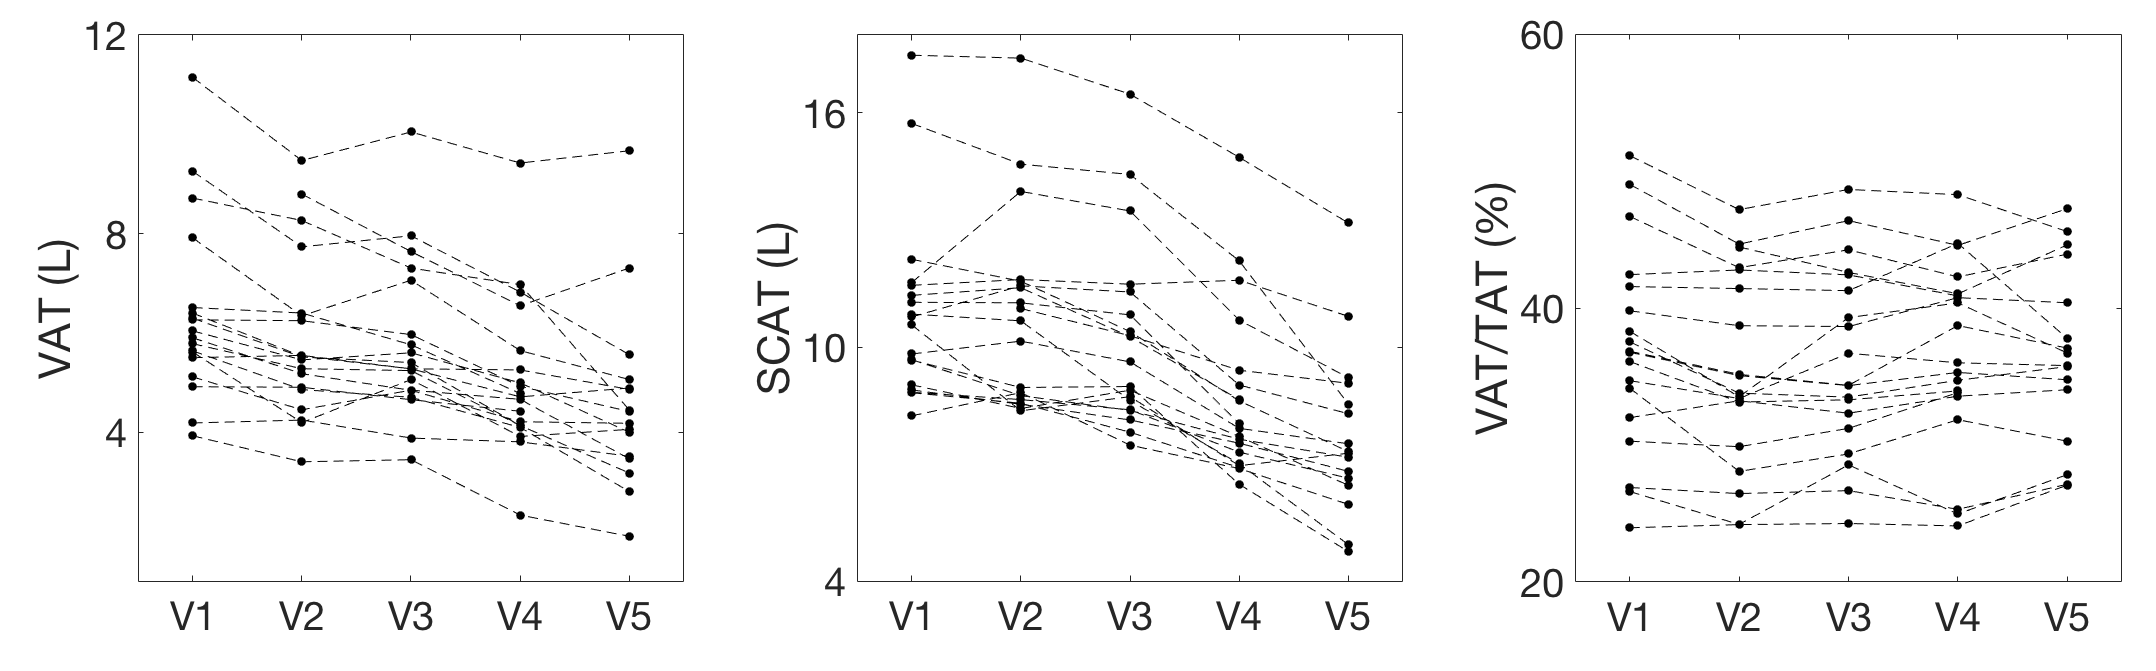
Longitudinal monitoring of each WLS patient is shown in Figure 3. Progressive reductions in both VAT and SCAT were observed over each subsequent visit. Relative body fat distributions, described by the VAT/TAT ratio, remained constant over time for each patient.
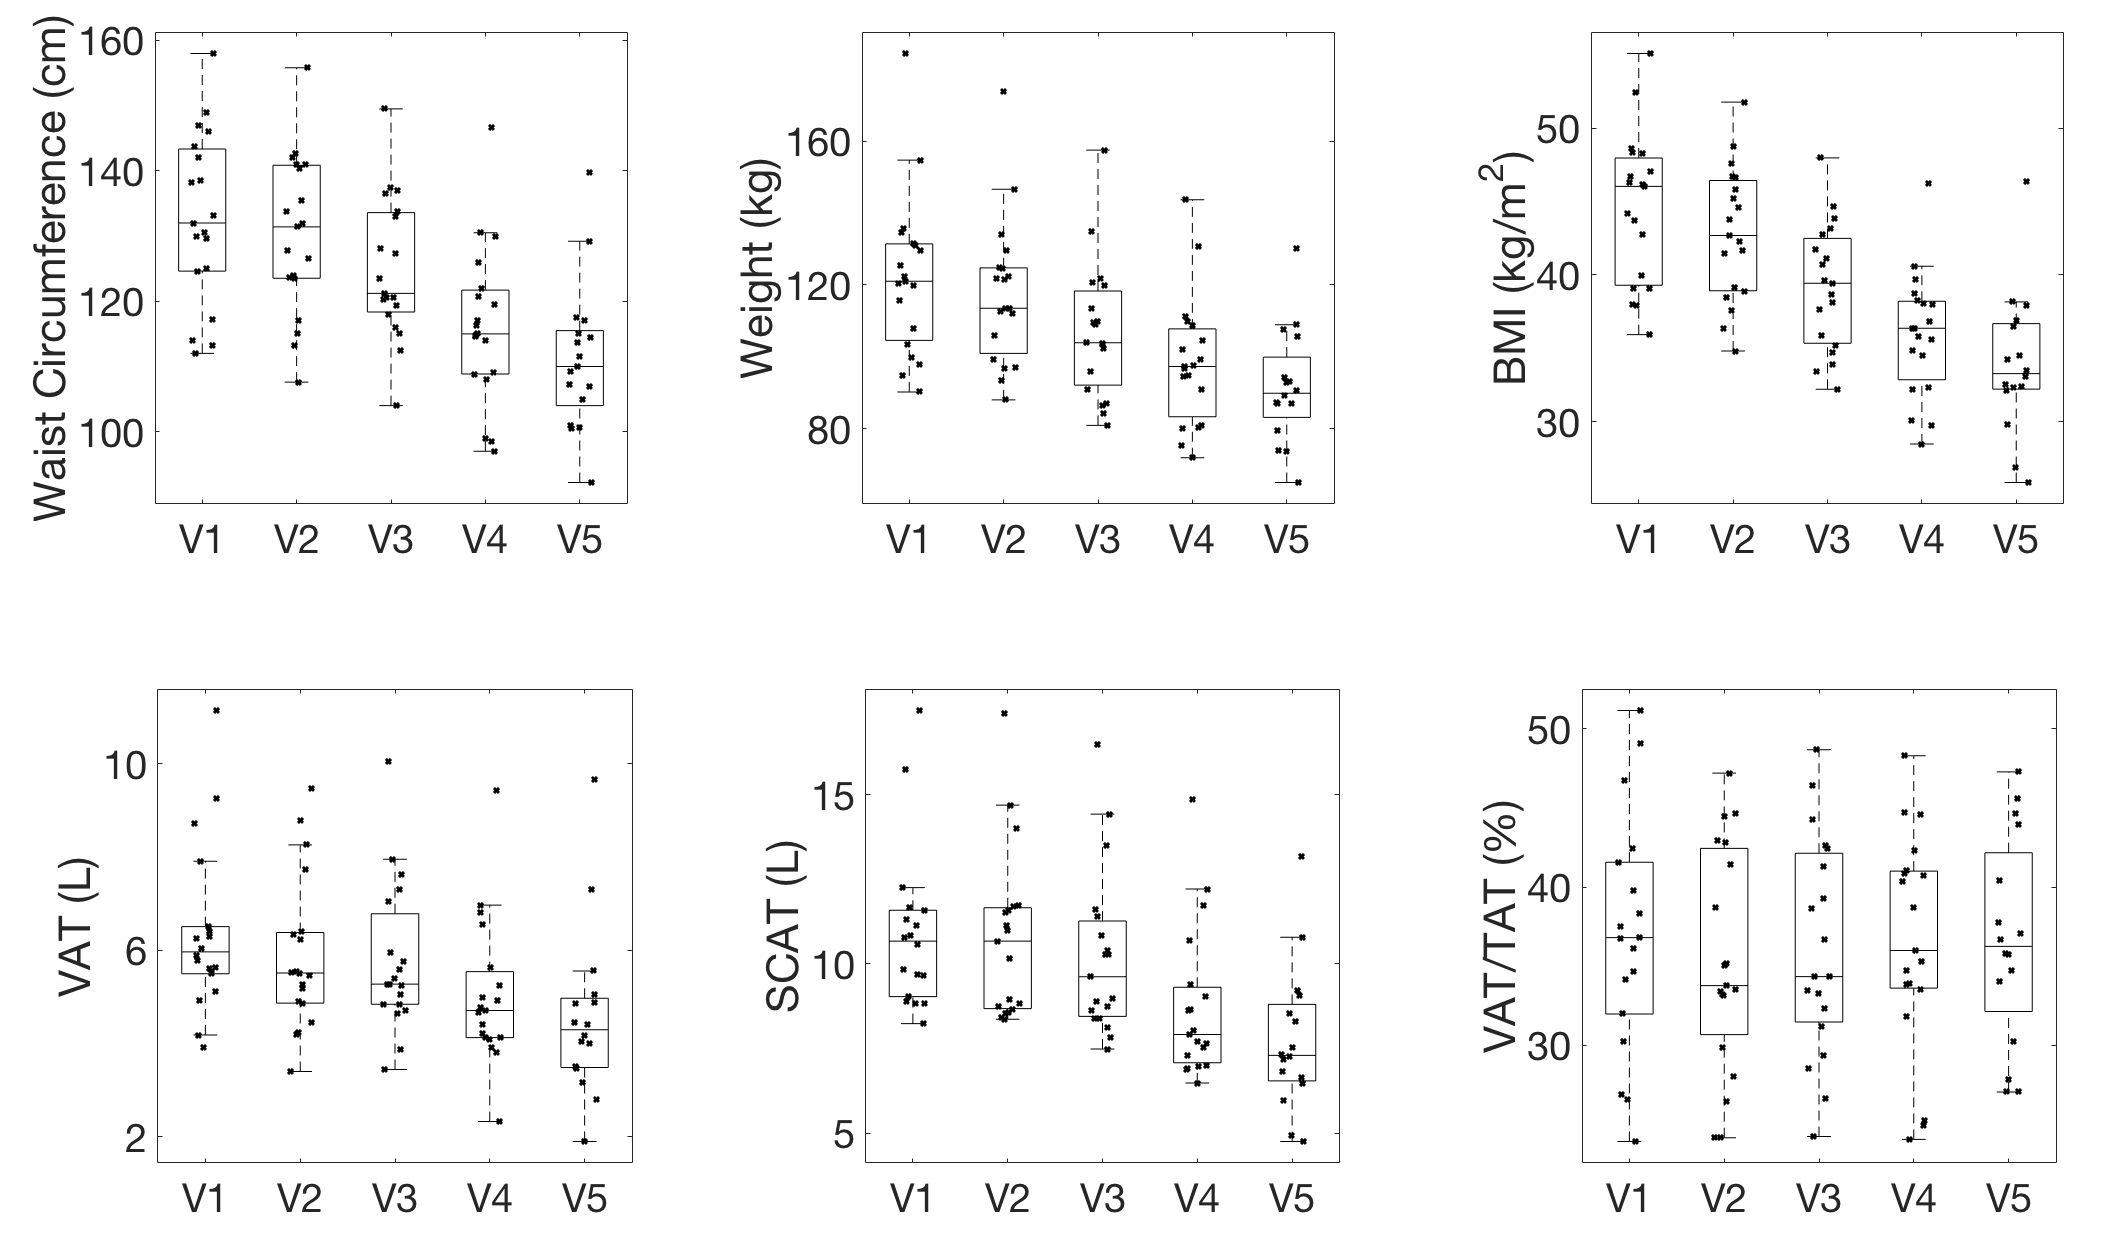
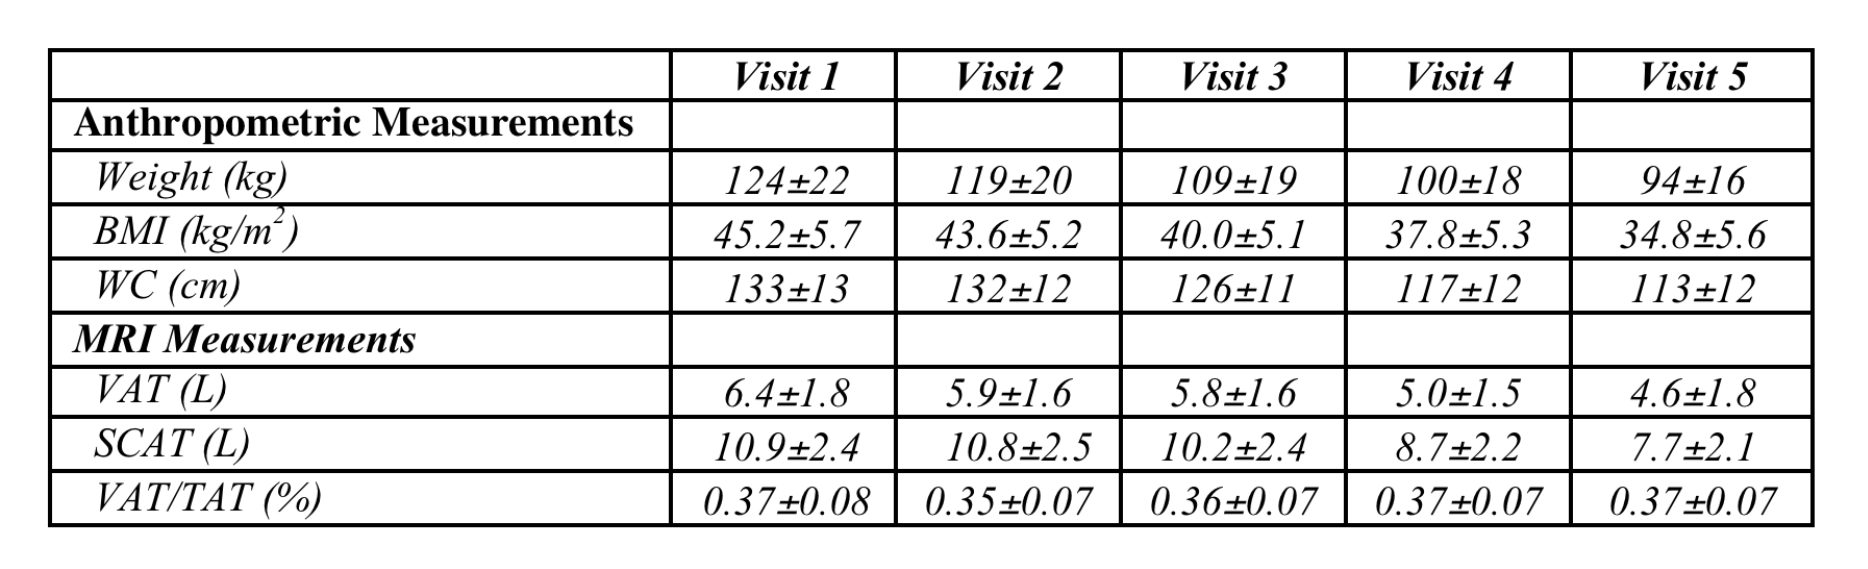
Mean anthropometric and patient abdominal fat distributions of all WLS patients are characterized for each visit in Figure 4 and Table 1.
Conclusions
This study monitored longitudinal changes in VAT and SCAT in response to WLS using a segmented single breath-hold CSE-MRI. Continual reductions in VAT and SCAT were measured at visit. At every visit, each patient’s relative body fat distribution remained constant despite overall reductions in all of the following: weight, VAT, and SCAT.Acknowledgements
The authors acknowledge the support of NIH (R01 DK088925, R01DK083380, K24DK102595), NSERC, CONICYT FONDEF/I Concurso IDeA en dos etapas ID15|10284, CONICYT Beca de Doctorado Nacional, and GE Healthcare.References
1. Despres JP, Lemieux I. Abdominal obesity and metabolic syndrome. Nature 2006;444:881–887.
2. Machann JR, Thamer C, Schnoedt B, Haap M, Haring H-U, Claussen CD, Stumvoll M, Fritsche A, Schick F. Standardized assessment of whole body adipose tissue topography by MRI. J. Magn. Reson. Imaging 2005;21:455–462.
3. Karlsson A, Rosander J, Romu T, Tallberg J, Grönqvist A, Borga M, Dahlqvist Leinhard O. Automatic and quantitative assessment of regional muscle volume by multi-atlas segmentation using whole-body water-fat MRI. J Magn Reson Imaging. 2015;41(6):1558-693.
4. Addeman BT, Kutty S, Perkins TG, Soliman AS, Wiens CN, McCurdy CM, Beaton MD, Hegele RA, McKenzie CA. Validation of volumetric and single-slice MRI adipose analysis using a novel fully automated segmentation method. J. Magn. Reson. Imaging 2014;41:233–241
5. Blackledge MD, Collins DJ, Koh D-M, Leach MO. Rapid development of image analysis research tools: Bridging the gap between researcher and clinician with pyOsiriX. Comput. Bio. Med. 2016;69:203–212.
Figures