3449
Multiparametric MR characterisation of a high-fat, high-cholesterol diet rodent model of liver disease1UCL Centre for Medical Imaging, University College London, London, United Kingdom, 2UCL Centre for Advanced Biomedical Imaging, University College London, London, United Kingdom, 3UCL Institute for Liver and Digestive Health, University College London, London, United Kingdom, 4Department of Medical Physicist, University College London Hospitals NHS Trust, London, United Kingdom
Synopsis
There is a growing interest in the development of new animal models of non-alcoholic fatty liver disease. In this study, we use T1, proton density fat fraction (PDFF) and R2* mapping to characterise hepatic parenchymal tissue and the evolution of MR properties over time in a high-fat, high-cholesterol diet model of fatty liver disease.
Purpose:
There is growing interest in the development of new animal models of non-alcoholic fatty liver disease (NAFLD) to better match human disease phenotypes. In this study, we aim to use T1, proton density fat fraction (PDFF) and R2* mapping to characterise (a) tissue properties and (b) the evolution of these properties over time, in a high-fat, high-cholesterol diet (HFHC) model of fatty liver disease.Methods:
Subjects
Healthy Sprague-Dawley rats were maintained on either a HFHC diet (65% fat content; n=16) or control isocaloric diet (10% fat content; n=16) for 16 weeks. Resected left liver lobe from animals terminated at 4 weeks (n=5, each cohort), 10 weeks (n=4, each cohort) and 16 weeks (n=7, each cohort) were fixed in 4% paraformaldehyde solution. Samples were cut into 3-5 mm thick slices and mounted in a 2% agar phantom and stored at 4°C. Samples were scanned using a 9.4T scanner (Agilent, Oxford, UK) for T1 mapping and a 3.0T scanner (Ingenia, Philips Healthcare, Best, Netherlands) with a 15-channel head coil (dStream HeadSpine, Philips Healthcare, Best, Netherlands) for PDFF and T2* mapping.
T1 mapping
T1 measurements were undertaken for an axial slice through each specimen using a spoiled gradient-echo Look-Locker readout (FOV 30x30 mm2, 128x128 matrix, 1mm slice thickness, TE=1.16 ms, TILook-Locker=20 ms, TRRF=3.11 ms, αLL=8˚, TRI=10.5 seconds, 100 inversion recovery readouts). Pixel-wise fitting using in-house developed Matlab code was used with a Look-Locker correction for T1 estimation1.
PDFF and R2* mapping
Raw complex images were acquired using five interleaved 3D-spoiled gradient recalled multi-echo acquisitions (SENSE factor=2, TR=25ms, α=5°), with progressively increasing first-TE (1.7ms, 1.8ms, 2.2ms, 2.3ms and 2.6ms) and constant TE spacing (1.35ms). To mitigate phase errors, PDFF and R2* maps were generated using in-house MatLab code implementing a previously described magnitude based reconstruction2,3.
Image analysis
For T1, PDFF and R2* maps, freehand regions-of-interest were placed over as much parenchyma as possible, with care to avoid any vessels/non-hepatic tissue.
Results:
Mean hepatic parenchymal T1 increased gradually over 16 weeks, becoming significantly different in rats receiving the HFHC diet at 16 weeks (control vs HFHC diet: 4 wks T1 498±49ms vs 565±51ms, p=0.3772; 10wks T1 526±41ms vs 657±46ms, p=0.0752; 16 wks T1 560±27ms vs 671±16ms, p=0.0045; figures 1a, b&c). Although there was a trend for higher fat fraction in rats fed the HFHC diet, this was only significantly different at 4 and 16 weeks (control vs HFHC diet: 4 wks 1.67±0.50% vs 7.74±0.68%, p<0.0001; 10 wks 5.50±1.77% vs 9.65±0.50%, p=0.0653; 16 wks 1.96±0.39% vs 6.24±0.40%, p<0.0001; figures 1d, e&f). Mean hepatic parenchymal R2* decreased in the HFHC diet animals over 16 weeks, while controls increased at 10 weeks, becoming significantly higher that HFHC diet rats and then decreased at 16 weeks (control vs HFHC diet: 4 wks 0.047±0.0024 ms-1 vs 0.055±0.0041 ms-1, p=0.1207; 10 wks 0.058±0.0025ms-1 vs 0.050±0.0015ms-1, p=0.0404; 16 wks 0.044±0.0020ms-1 vs 0.044±0.0021ms-1, p=0.8465; figures 1g, h&i).
Looking at changes over time, hepatic parenchymal T1 changes were not significant for rats receiving the control (p=0.5050) or HFHC diet (p=0.1130; figure 2a). Both cohorts demonstrated significant increases in hepatic parenchymal fat fraction at 10 weeks, followed by a decline at 16 weeks (control diet p=0.0199, HFHC diet p=0.0024; Figure 2b). Hepatic parenchymal R2* in rats receiving the control diet demonstrated a similar trend to the fat fraction data (p=0.0040), whereas HFHC diet fed rats significantly decreased over time (p=0.0364; figure 2c).
Discussion:
We have shown that multi-echo fat fraction measurements can characterise ex vivo hepatic tissue, and distinguish disease phenotypes and evolving steatosis in models of fatty liver disease. Hepatic parenchymal T1, previously linked with tissue fibrosis4, increased in the HFHC diet cohort at later stages suggestive of underlying fibrotic change. The relationship of liver R2* with iron content is well established5 but the significance of the decline in R2* observed over time relative to model evolution is uncertain, as iron deposition is typically a feature of liver disease. Hepatic steatosis and R2* are known to affect T1 signal6,7 and further exploration of the quantitative relationship between liver tissue composition and T1 signal, is an important area of future work8.
Finally, this cross-platform study reflects the complexities of imaging small samples at lower field strengths. Although bench-based validation is essential to refining animal models at an early stage, the use of in vivo multiparametric MRI may help to directly minimise numbers of animals sacrificed during the development of new models of liver disease.
Conclusion:
Multiparametric MRI can be used to characterise ex vivo animal models of NAFLD and track the evolution of tissue properties over time.Acknowledgements
This work was supported by a National Institute for Health Research Clinical Lectureship and Senior Investigator award and the University College London Hospitals Biomedical Research Centre.References
1. Ramasawmy R, Campbell-Washburn AE, Wells JA, et al. Hepatic arterial spin labelling MRI: an initial evaluation in mice. NMR in biomedicine 2015;28(2):272-280.
2. Bydder M, Yokoo T, Hamilton G, et al. Relaxation effects in the quantification of fat using gradient echo imaging. Magnetic resonance imaging 2008;26(3):347-359.
3. Tang A, Tan J, Sun M, et al. Nonalcoholic fatty liver disease: MR imaging of liver proton density fat fraction to assess hepatic steatosis. Radiology 2013;267(2):422-431.
4. Chouhan MD, Ramasawmy R, Campbell-Washburn A, et al. Liver parenchymal T1: repeatability and studies in a rodent model of chronic liver disease at 9.4T. Proc Intl Soc Mag Reson Med. Volume 24. Singapore; 2016. p. 3848.
5. Gandon Y, Olivie D, Guyader D, et al. Non-invasive assessment of hepatic iron stores by MRI. Lancet 2004;363(9406):357-362.
6. Banerjee R, Pavlides M, Tunnicliffe EM, et al. Multiparametric magnetic resonance for the non-invasive diagnosis of liver disease. J Hepatol 2014;60(1):69-77.
7. Mozes FE, Tunnicliffe EM, Pavlides M, Robson MD. Influence of fat on liver T measurements using modified Look-Locker inversion recovery (MOLLI) methods at 3T. Journal of magnetic resonance imaging : JMRI 2016.
8. Chouhan MD, Ambler G, Mookerjee R, Taylor SA. Multiparametric magnetic resonance imaging to predict clinical outcomes in patients with chronic liver disease: a cautionary note on a promising technique. J Hepatol 2016;(accepted).
Figures
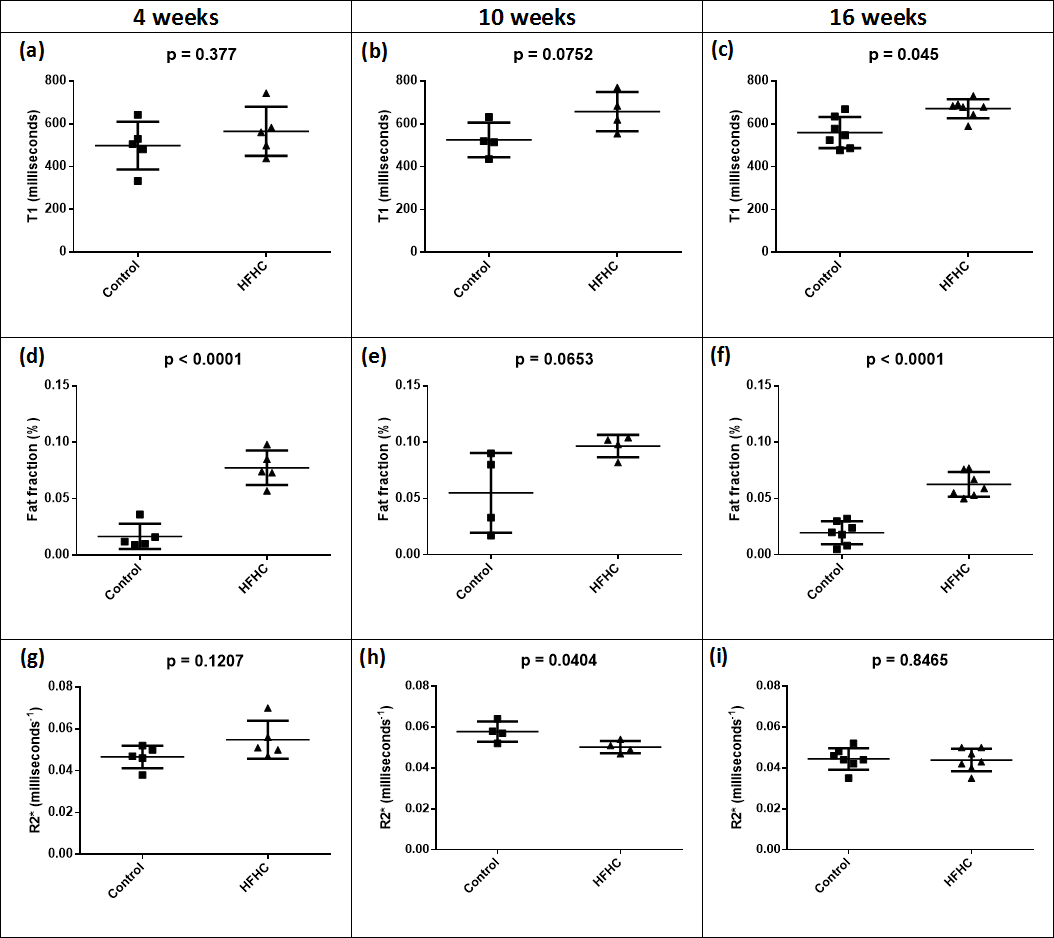
Figure 1: T1 mapping, fat fraction and R2* measurements in high-fat, high-cholesterol and isocaloric diet control rats, over time
Data presented with raw data plots and overlay of the sample mean±standard deviation. Hepatic parenchymal T1 at (a) 4 weeks, (b) 10 weeks and (c) 16 weeks; fat fraction at (d) 4 weeks, (e) 10 weeks and (f) 16 weeks; and R2* mapping at (h) 4 weeks, (i) 10 weeks and (j) 16 weeks.
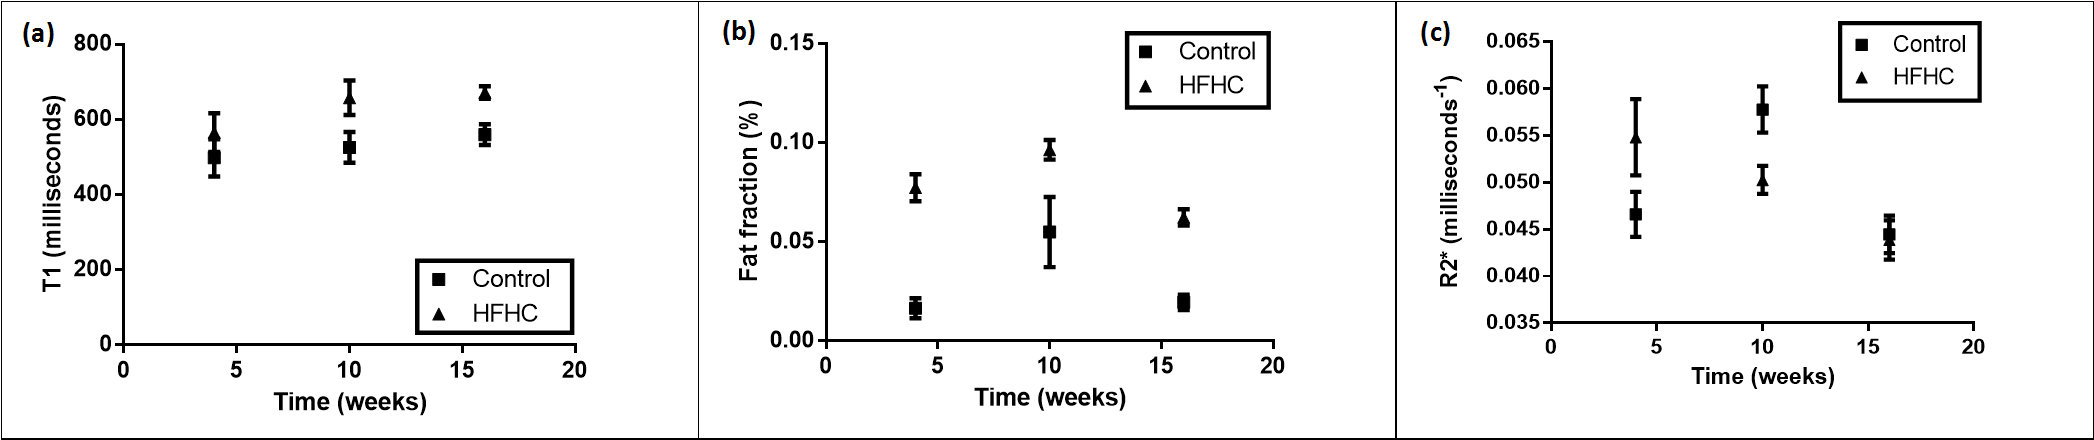
Figure 2: Evolution of changes in hepatic parenchymal T1, fat fraction and R2* over time
Single data point mean for each cohort sample (□ = isocaloric diet control; Δ = high-fat, high-cholesterol diet) with overlay of the sample standard error. Data presented for hepatic parenchymal (a) T1, (b) fat fraction and (c) R2*.