3448
The effects of sprint interval training on visceral, subcutaneous and hepatic fat stores: An MRI and 1H-MRS study of lipid content and composition1NIHR Nottingham Digestive Diseases Unit, Nottingham University Hospitals, University of Nottingham, Nottingham, United Kingdom, 2Sir Peter Mansfield Imaging Center, Physics and Astronomy, University of Nottingham, Nottingham, United Kingdom, 3NIHR The Leicester-Loughborough Diet, Lifestyle & Physical Activity Biomedical Research Unit, University Hospitals of Leicester and Loughborough University, 4Metabolic Physiology Group, Faculty of Medicine and Health Sciences, University of Nottingham, United Kingdom, 5College of Life and Environmental Sciences, University of Birmingham
Synopsis
In this study, 9 obese male participants underwent 6 weeks of sprint interval training (SIT) and changes in visceral, subcutaneous and intra-hepatocellular fat were measured using MRI and MRS at baseline, control (>4 weeks later) and post exercise. Change in liver lipid composition was also assessed.
Purpose
Recent studies have shown that lifestyle interventions play a key role in the prevention and management of obesity, metabolic disorders and liver disease [1]. For example, randomized controlled trials have shown liver fat levels can change significantly even after short- term dietary interventions [2, 3]. Exercise has also been considered important, with sprint interval training (SIT) providing regimens with less time commitment [4]. Magnetic Resonance Imaging (MRI) and Spectroscopy (MRS) provides a powerful method of monitoring changes in fat quantity, and MRS can also be used to assess hepatic fat composition [5]. The aim of this study was to investigate changes in subcutaneous fat (SAT), visceral fat (VAT) and hepatic proton-density fat fraction (PDFF) and also hepatic fat composition following a six week SIT intervention in obese subjects with high intrahepatic triglyceride.Methods
Study Design After obtaining ethical approval, 9 obese male participants were recruited following informed consent. Participants attended three MR test visits (>4 weeks between visits). On the first visit (baseline) subjects arrived at the SPMIC after overnight fast and were scanned for SAT, VAT and PDFF. This was repeated on a second (control) and third (post-exercise) visit. Between baseline and control visits participants were encouraged to make no changes to their normal habits. Following control visit subjects underwent 3 SIT sessions per week for 6 weeks. During training session participants underwent 5 mins warm-up (50 W), followed by four to six 30 second sprint intervals [4, 6] interspersed with 4.5 mins of active recovery (50 W).
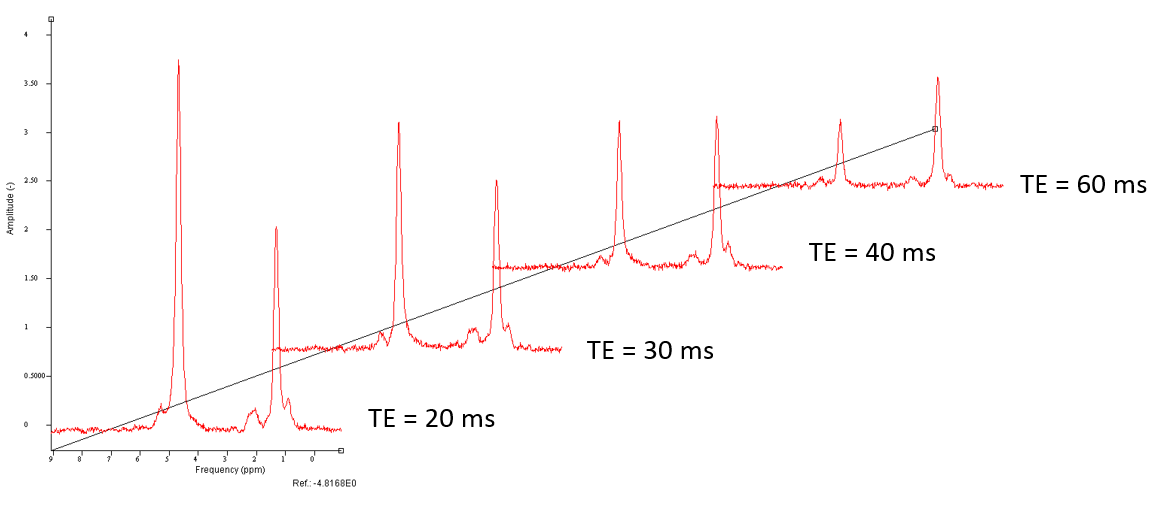
MR Protocol MR measurements were performed on Philip Achieva 3T system and 32 channel XL-Torso coil. SAT and VAT was measured using 2-point mDixon MRI acquired in transverse plane over 3 breath-holds (L4/L5 of spine). A fat mask was generated from fat images using minimum threshold cut-off in intensity histogram [7]. An algorithm was written to generate fat boundaries and volumes within SAT and VAT regions calculated. PDFF was measured using STEAM localized 1H MRS at four echo times (20x20x20mm voxel, bandwidth=2kHz, 1024 data-points, 18 averages at TE=20ms, 9 averages at TE=30,40,60ms, with and without water suppression, figure 1). Spectra were phase corrected, frequency aligned and averaged in jMRUI and AMARES was used to fit 7 Gaussian peaks as described previously [5] before was determined. PDFF was calculated as F/(F+W) where F and W are total corrected fat and water signals respectively.
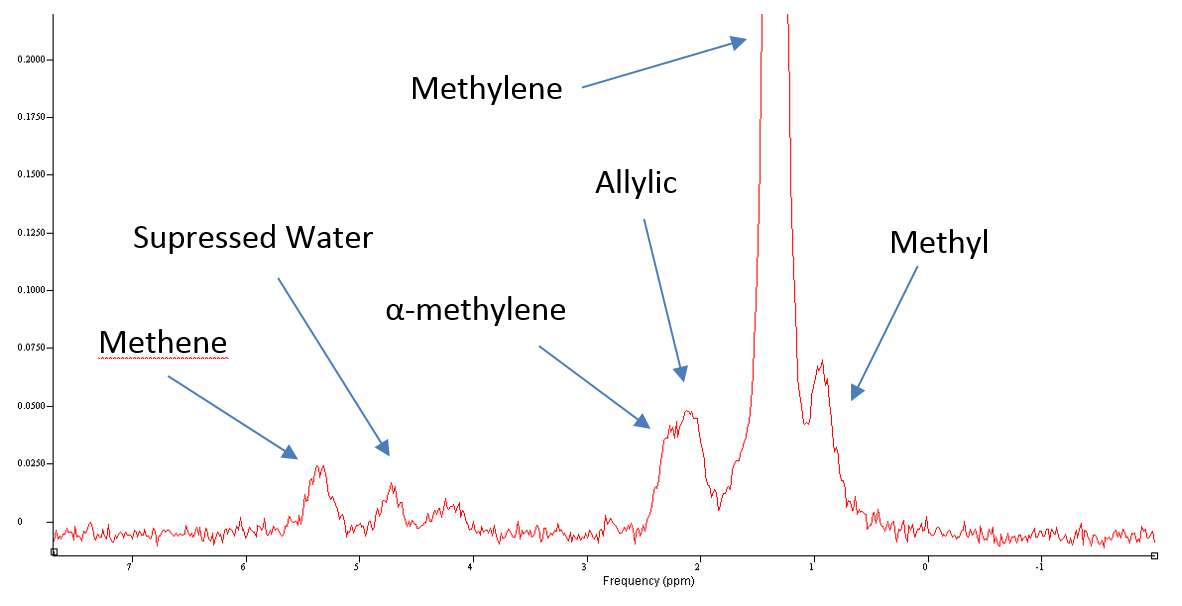
A saturated fat index was determined as SI = 1 - (Allylic/F) as described previously [8] and extended to determine a short-chain fatty acid index SCI = Methyl/Methylene (figure 2).
Statistics Values are presented as mean ± standard error. Values across visits were analysed using a one-way repeated measures ANOVA, followed up by pairwise comparison using two-tailed Student’s t-tests, corrected for multiple comparisons using Bonferroni adjustment.
Results
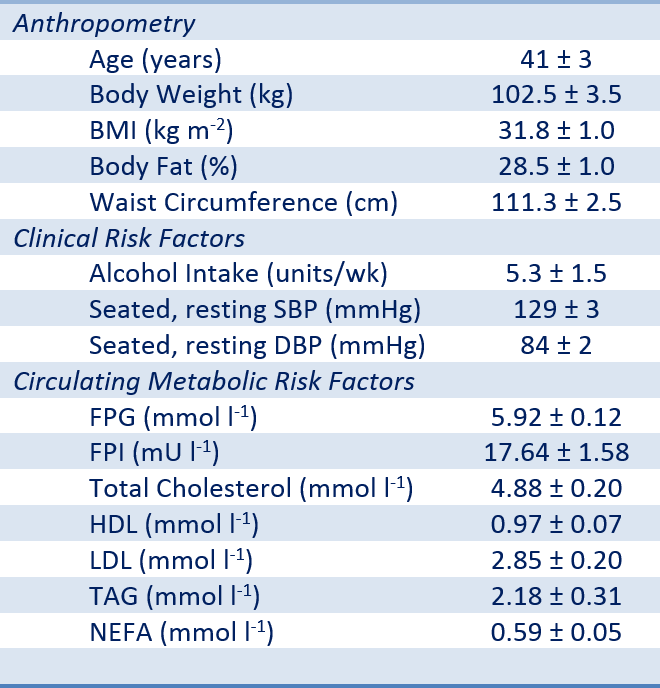
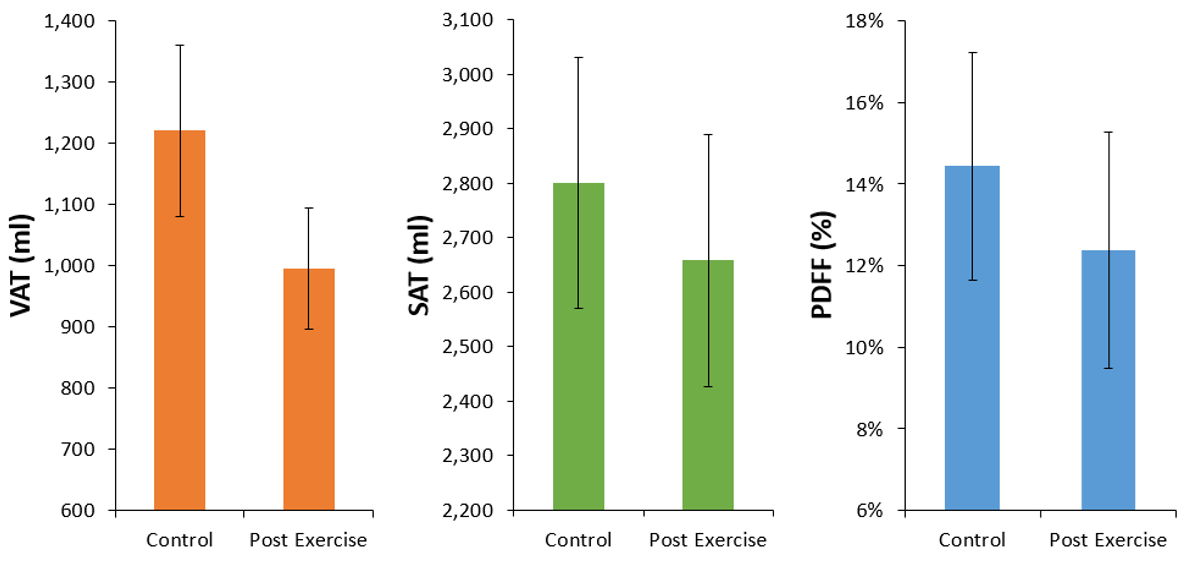
Demographics and baseline parameters are shown in figure 3. MRI dataset was corrupted for one visit so VAT and SAT is n=8. Baseline VAT and SAT values were 1142 ± 89 and 2943 ± 300 ml respectively, and baseline PDFF was 15.6 ± 2.8 %. The main effect of visit on VAT, SAT and PDFF was significant (P<0.05). There was no significant change in VAT, SAT or PDFF between baseline and control visits. Between the control and post exercise visit there was a significant decrease in VAT (225 ± 62 ml, P=0.008), SAT ( 142 ± 45 ml, P=0.02) and PDFF ( 2.1% ± 0.7, P = 0.01) as shown in figure 4. The baseline saturated fat index and short chain fat index in the liver was SI = 0.90 ± 0.02 and SCI = 0.13 ± 0.07. There was no significant change in or between initial visit and control (P = 0.2, P=0.8 respectively) or control and post-exercise visit (P = 0.2, P=0.9 respectively).Discussion
This study has shown the beneficial effects of SIT exercise. Despite shorter period of exertion compared with standard aerobic exercise, there was a significant drop in visceral, subcutaneous and liver fat content. MRS allowed a unique insight into the type of fat in the liver. In a previous study SI was significantly higher in obese patients compared with healthy, with values similar to those found in the present study [8]. However, there was no change in saturated fat index or short-chain fat index following our SIT intervention.Conclusion
Sprint Interval training significantly reduced visceral, subcutaneous and hepatic fat fraction in obese subjects with raised intrahepatic triglyceride. MRS offers a powerful non-invasive method of assessing hepatic fat composition also, although there were no changes in this study.Acknowledgements
No acknowledgement found.References
1. Taylor, R., Pathogenesis of type 2 diabetes: tracing the reverse route from cure to cause. Diabetologia, 2008. 51(10): p. 1781-1789.
2. Johnston, R.D., et al., No Difference Between High-Fructose and High-Glucose Diets on Liver Triacylglycerol or Biochemistry in Healthy Overweight Men. Gastroenterology, 2013. 145(5): p. 1016-+.
3. Bawden, S., et al., Increased liver fat and glycogen stores following high compared with low glycaemic index food: a randomized cross over study. Diabetes Obes Metab, 2016.
4. Whyte, L.J., J.M.R. Gill, and A.J. Cathcart, Effect of 2 weeks of sprint interval training on health-related outcomes in sedentary overweight/obese men. Metabolism-Clinical and Experimental, 2010. 59(10): p. 1421-1428.
5. Hamilton, G., et al., In vivo characterization of the liver fat H-1 MR spectrum. Nmr in Biomedicine, 2011. 24(7): p. 784-790.
6. Baker, J.S. and B. Davies, Brief Intensity Exercise and Resistive Force Selection in Obese/Overweight Subjects: Body Mass or Composition. Medicine and Science in Sports and Exercise, 2006. 38(5): p. S315-S315.
7. Nakai, R., et al., Development of a high-precision image-processing automatic measurement system for MRI visceral fat images acquired using a binomial RF-excitation pulse. Magnetic Resonance Imaging, 2010. 28(4): p. 520-526.
8. Johnson, N.A., et al., Noninvasive assessment of hepatic lipid composition: Advancing understanding and management of fatty liver disorders. Hepatology, 2008. 47(5): p. 1513-1523.
Figures