3447
Evaluation of renal hemodynamics and oxygenation with BOLD, oxygen extraction fraction (OEF) and ASL techniques in animal model of diabetic nephropathy1Radiology, Peking University First Hospital, Beijing, People's Republic of China
Synopsis
Our study was to investigate the feasibility of using blood oxygen level dependent (BOLD), oxygen extraction fraction (OEF) and arterial spin labeling (ASL) techniques for the detection of renal hemodynamics and oxygenation changes in rabbits with diabetic nephropathy (DN).
Purpose
To investigate the feasibility of using blood oxygen level dependent (BOLD), oxygen extraction fraction (OEF) and arterial spin labeling (ASL) techniques for the detection of renal hemodynamics and oxygenation changes in rabbits with diabetic nephropathy (DN).Methods
A total of thirty-nine New Zealand rabbits were included in this study. The rabbits were randomly divided into 3 groups: two diabetes mellitus (DM) groups (DM3 group: n=17; DM7 group: n=17) and a control group (n=5); DM was induced by intravenous injection of alloxan at 100 mg/kg in the DM groups. Rabbits in the control group were injected with the same dosage of 0.9% saline. Blood glucose level >16.0 mmol/L measured 3 days after injection was considered as a criterion of successful DM model.
MR examination was performed at 3T scanner with an 8-channel knee coil. For the control group, MR exam was repeated 3 times: baseline; 3 days and 7 days after modeling (Day 3; Day 7). For the DM group, MR scan was repeated 2 times: DM3 group (baseline; Day 3); DM7 group (baseline, Day 7). BOLD imaging was conducted with a multiple gradient echo sequence. Renal OEF was derived from Yoblonsky’s model based on the source images acquired with multi-echo gradient and spin echo sequence. ASL was conducted with the labeling strategy of flow-sensitive alternating inversion recovery. OEF and ASL data were processed offline by using a self-developed software (Matlab; MathWorks, Natick, Mass). R2* maps were generated on an AW 4.2 workstation (GE Medical Systems) by fitting the signals according to a mono-exponential function. Average renal R2*, OEF and RBF values were obtained with manually drawn ROIs, including cortex (CO), outer stripes (OS) and inner stripes (IS) of the outer medulla. Independent-sample and paired-sample T test were performed to test the differences of R2*, OEF and RBF for inter- and inner-group, respectively. After the MR scanning, rabbits were sacrificed for pathological examination.
Results
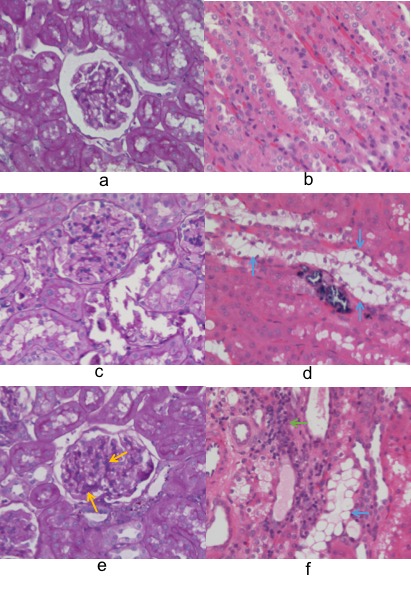
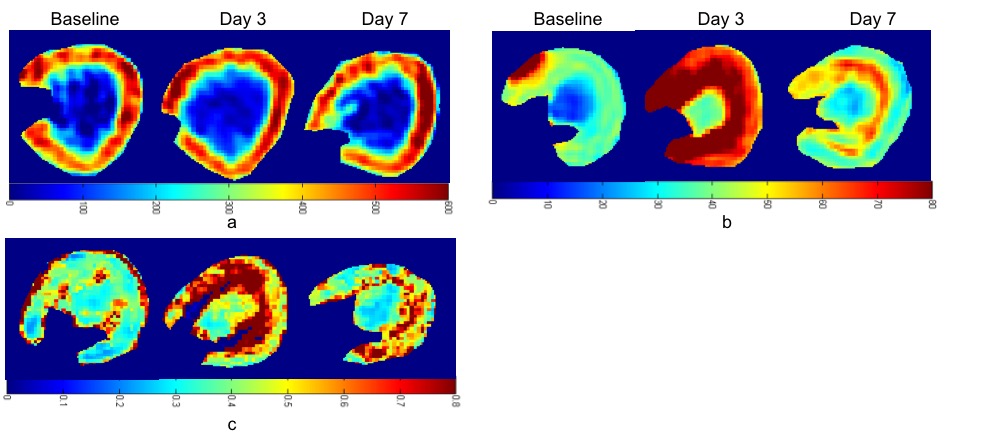
Totally, 5 rabbits of control group, 12 rabbits of DM3 group and 9 rabbits of DM7 group were completed the study. Swelling and mild vacuolation of renal tubular cell and lymphocytes infiltration were observed in DM group (Figure 1). There was no statistically significant difference of RBF, R2* or OEF in CO, OS or IS among 3 groups at baseline (all p>0.05). In the control group, no statistically significant difference of RBF, R2* or OEF were observed at baseline, Day 3 and Day 7. Compared with baseline, R2* of the DM3 group increased by 57.5%, 44.0%, 86.2% in CO, OS, IS, respectively (baseline vs Day 3: 25.36±6.97 vs 39.95±8.41Hz for CO, p=0.03; 38.24±6.11 vs 55.07±8.57 Hz for OS, p=0.01; 29.11±3.53 vs 54.20±8.91 Hz for IS, p=0.004). Similarly, OEFs of the DM3 group at Day 3 were significantly increased in CO, OS and IS (baseline vs Day 3: 0.37±0.05 vs 0.53±0.05 for CO, p=0.004; 0.45±0.05 vs 0.58±0.06 for OS, p=0.02; 0.42±0.01 vs 0.58±0.05 for IS, p=0.003) compared with that in baseline. For the DM7 group, R2* of CO was significantly increased (baseline vs Day 7: 24.53±3.21 vs 35.71±8.36 Hz, p=0.04), while R2* of OS and IS showed no statistical difference (baseline vs. Day 7: 39.29±5.4 vs 45.75±11.10 Hz for OS, p=0.052; 35.69±3.60 vs 47.12±11.62 Hz for IS, p=0.12). Besides, no statistically significant difference of OEF was observed in DM7 group at Day 7 compared with that in baseline (baseline vs Day 7: 0.42±0.03 vs 0.41±0.04 for CO, p=0.49; 0.54±0.05 vs 0.49±0.05 for OS, p=0.54; 0.44±0.02 vs 0.47±0.05 for IS, p=0.52). For all the groups, RBF had no statistically significant difference between them (all p>0.05).Discussion
This study demonstrates a feasible strategy for the detection of renal hemodynamics and oxygenation changes in DN rabbits based on ASL, BOLD and OEF techniques. Glomerular hyperfiltration occured in early stage in the kidneys due to DM and hypoxia was caused by different factors1, 2. In our study, an increase of R2* was observed in the CO, OS and IS in the DM3 group, which indicates that blood-oxygen level decreased in all compartments of the kidney, predominating in the medulla (OS and IS) due to an increased reabsorption work in DN model. Similarly, largest increase of OEF was observed in medulla in the DM3 group, which corresponds to an improved oxygen extraction. BOLD, OEF and ASL are benefit to the non-invasively evaluation of renal function in DN.Conclusion
The combined use of MRI based ASL, BOLD and OEF enables a comprehensive assessment of renal function in DN rabbits.Acknowledgements
No acknowledgement found.References
1. Palm F, Liss P, Fasching A, Hansell P, Carlsson PO. Transient glomerular hyperfiltration in the streptozotocin-diabetic Wistar Furth rat. Ups J Med Sci 2009;106(3):175–182.
2. Wang Z J, Kumar R, Banerjee S, et al. Blood oxygen level-dependent (BOLD) MRI of diabetic nephropathy: preliminary experience. J Magn Reson Imaging, 2011, 33(3):655-60.
Figures