3442
Automated MRI fat quantification in obese patients – impact of reader experience and degree of obesity on time exposure1Diagnostic and Interventional Radiology, Leipzig University Hospital, Leipzig, Germany, 2Integrated Research and Treatment Center (IFB) AdiposityDiseases, Leipzig University Medical Center, Leipzig, Germany, 3Department of Internal Medicine, Neurology and Dermatology, Division of Gastroenterology and Rheumatology, Leipzig University Hospital, Leipzig, Germany, 4Department of Internal Medicine, Neurology and Dermatology, Division of Endocrinology and Nephrology, Leipzig University Hospital, Leipzig, Germany
Synopsis
The last decades have seen an increasing socioeconomic impact of obesity and obesity-related diseases. Noninvasive measures like subcutaneous and visceral adipose tissue (SAT, VAT) amounts and are also increasingly correlated with other, often clinical or metabolic findings as well as independent patient characteristics, even interventional complication rates. MRI fat quantification is common but manual processing is often laborious and time consuming while fully automatic segmentation is prone to errors. This work takes a custom-made semiautomatic MRI tool and prospectively analyzes the processing and interaction times for readers with different experience as well as patients from different BMI groups.
Purpose
The last decades have seen an increasing socioeconomic impact of obesity and obesity-related diseases. Noninvasive measures like subcutaneous and visceral adipose tissue (SAT, VAT) amounts have been assessed by radiological imaging techniques and are also increasingly correlated with other, often clinical or metabolic findings as well as independent patient characteristics such as interventional complication rates.
In obesity research, segmentation of SAT and VAT areas in volumetric MRI data sets is common but manual processing is often laborious and time consuming while fully automatic segmentation is often prone to errors. This work takes a custom-made tool for semiautomatic MRI quantification and prospectively records various processing and interaction times for readers with different experience as well as images from patients over a wide range of different body mass indices (BMI).
Materials and Methods
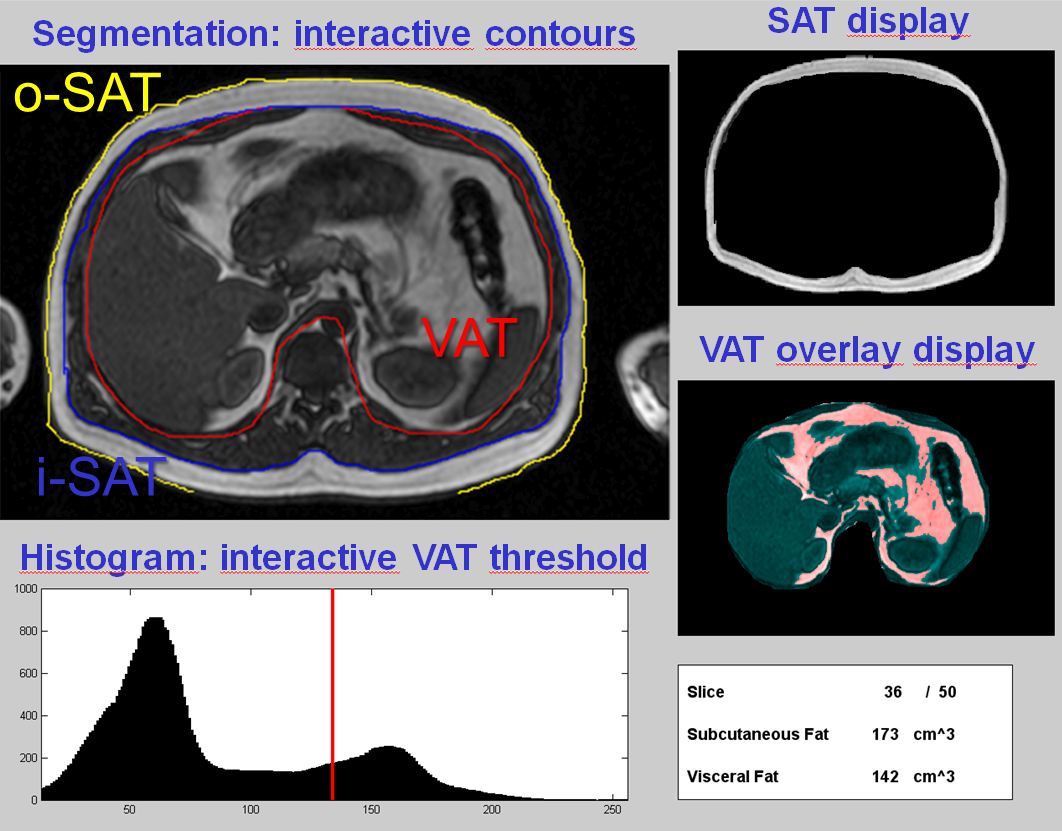
Processing details of the custom-made graphical analysis software (under Matlab) can be found in a previous work [1]. In short, the software uses in-phase and opposed-phase Dixon images as input. The graphical user interface is shown in Fig. 1. Patients were selected from IRB-approved clinical studies involving MRI exams (1.5T Achieva XR, Philips, Best) with routine quantification of abdominal VAT and SAT volumes. Abdominal coverage–from diaphragm to pelvic floor–involved an average of 35 slices (10 mm thick, 0.5 mm gap). Data from a total of 80 patients were divided into six BMI groups: 10 normal (<26 kg/m2), 10 overweight (26–30), 20 obese (>30, OBS), 20 severely obese (>35, SVR), 10 morbidly obese (>40) and 10 “super obese” (>45, SUP).
Data were analyzed by
one experienced reader (RE, all BMI groups, n=80) and two less
experienced ones (R1 and R2, OBS+SVR only, n=40).
Automatic segmentation time (tAS), manual correction time (tMC,
adjustment of contours and thresholds) and total interaction time (tTI,
from reading of presegmented images to saving of final data) were recorded and are reported as mm:ss.
Results and Discussion
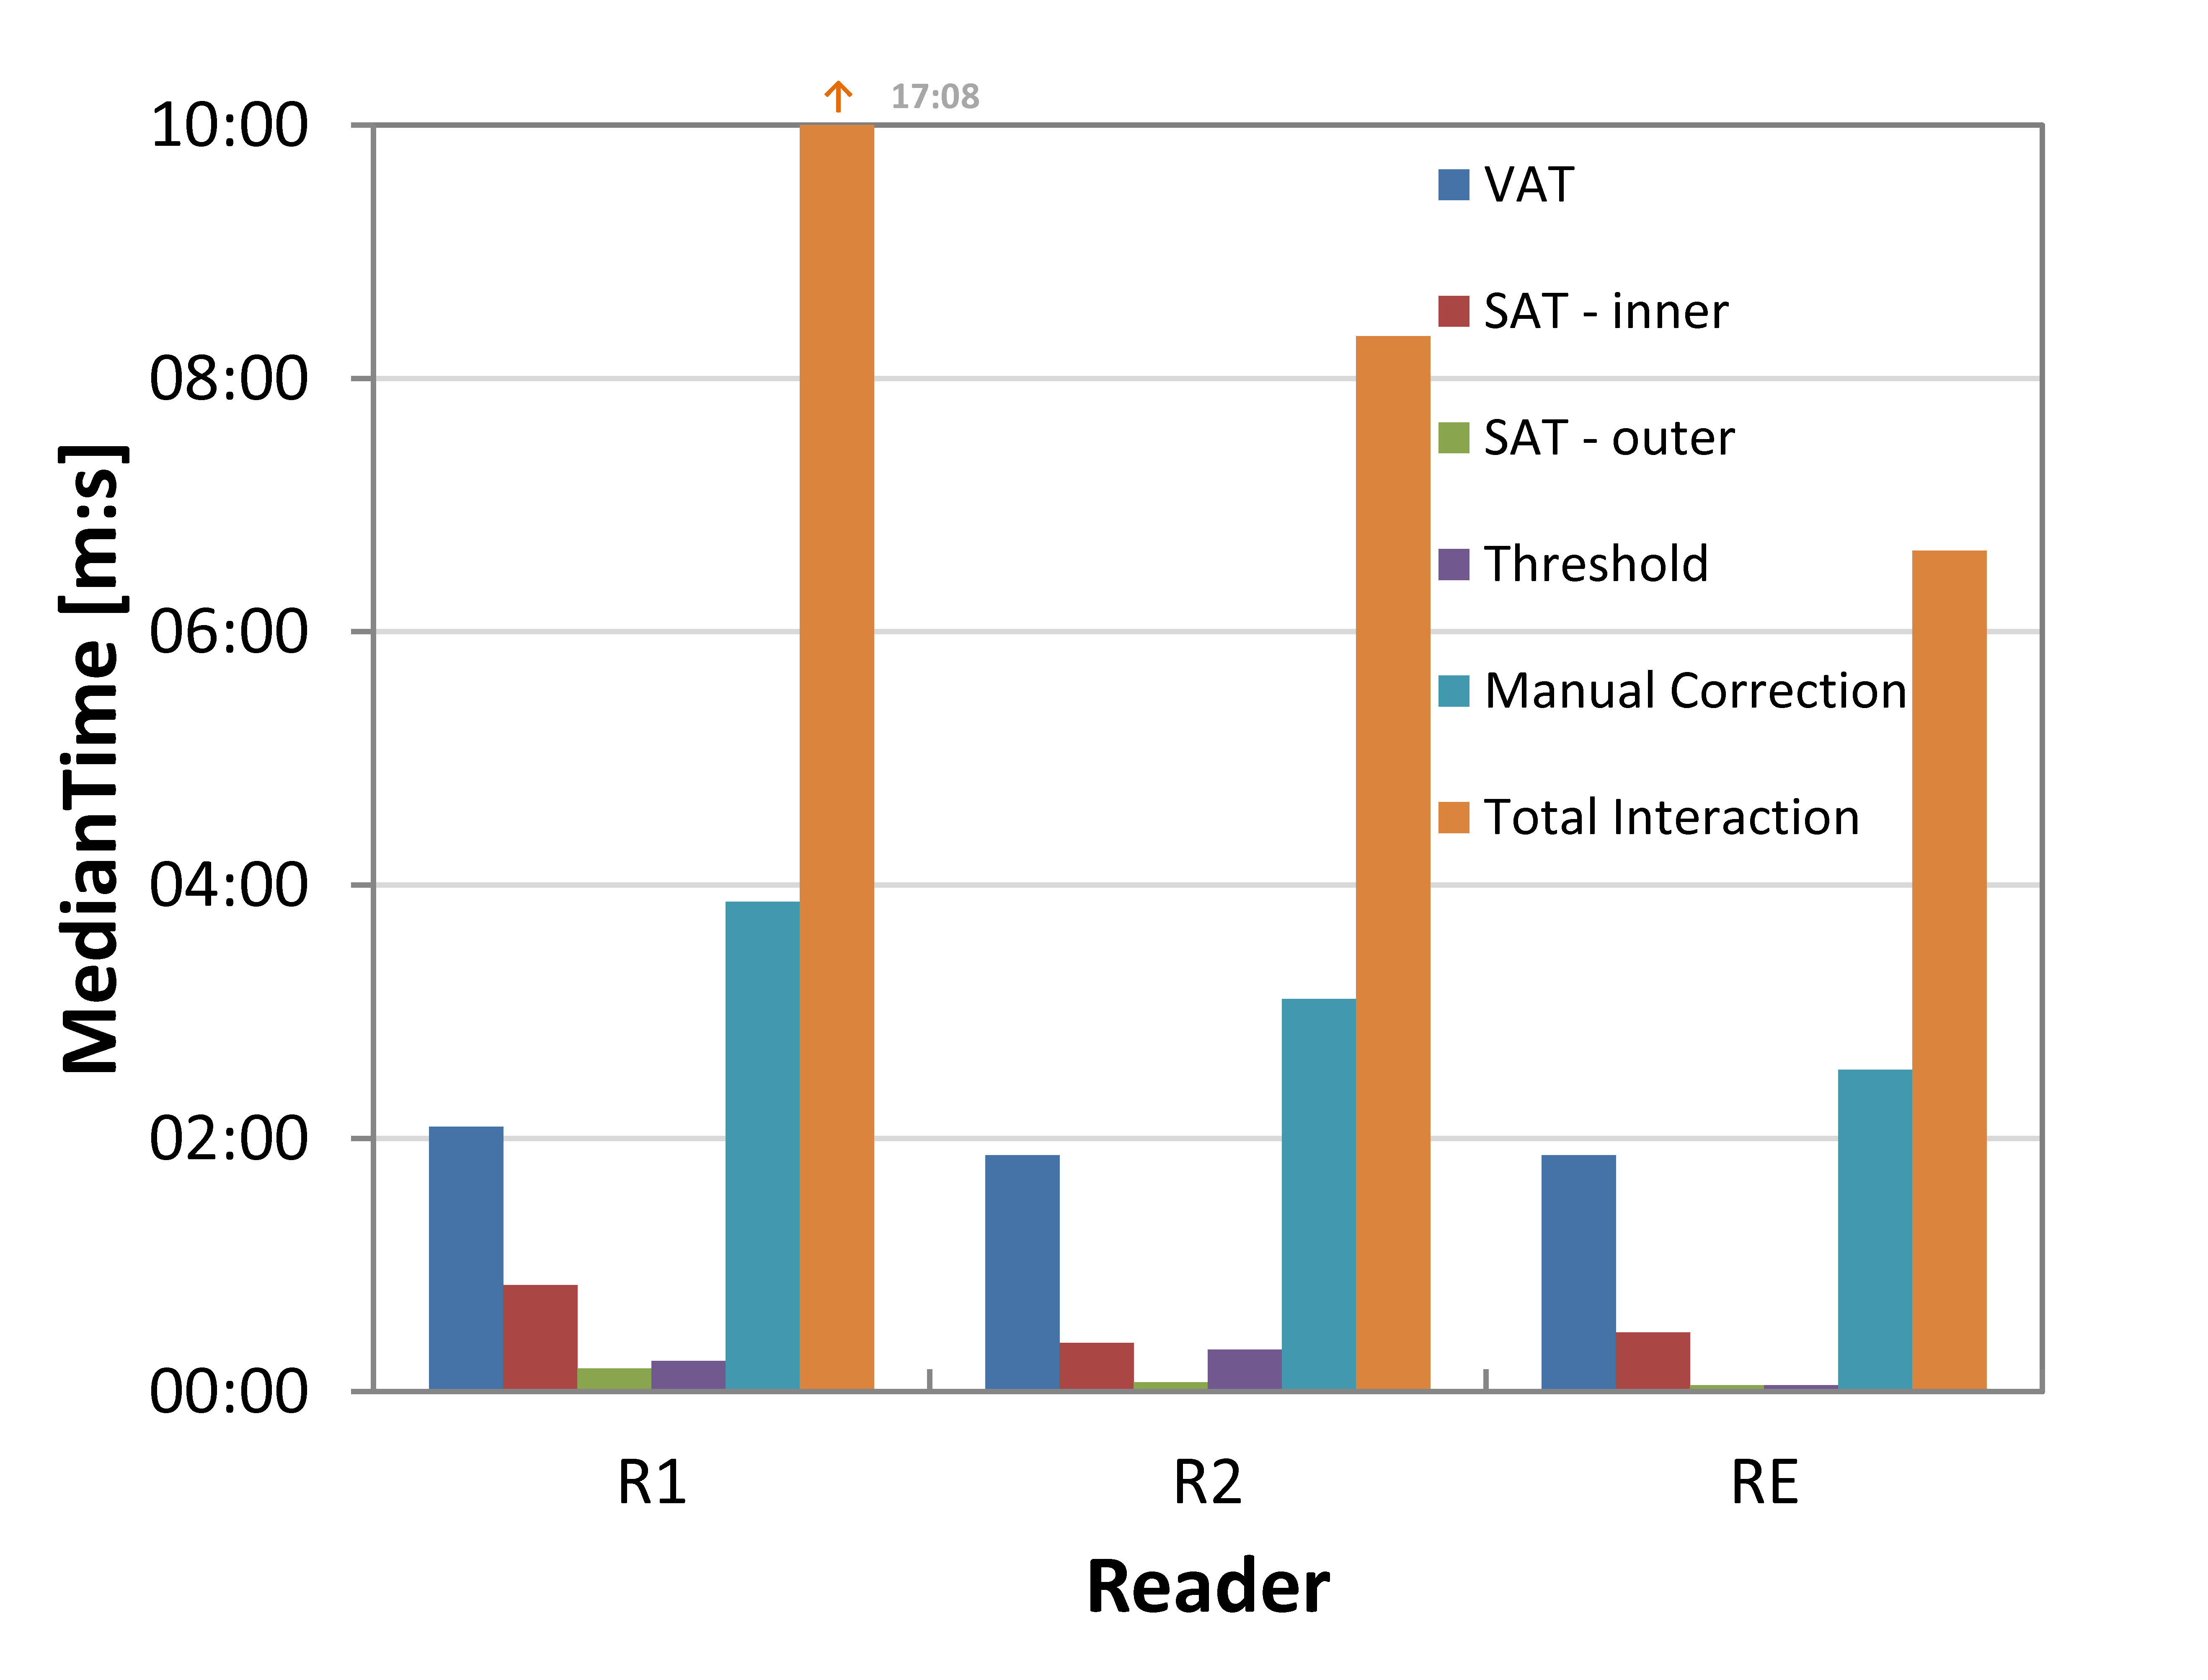
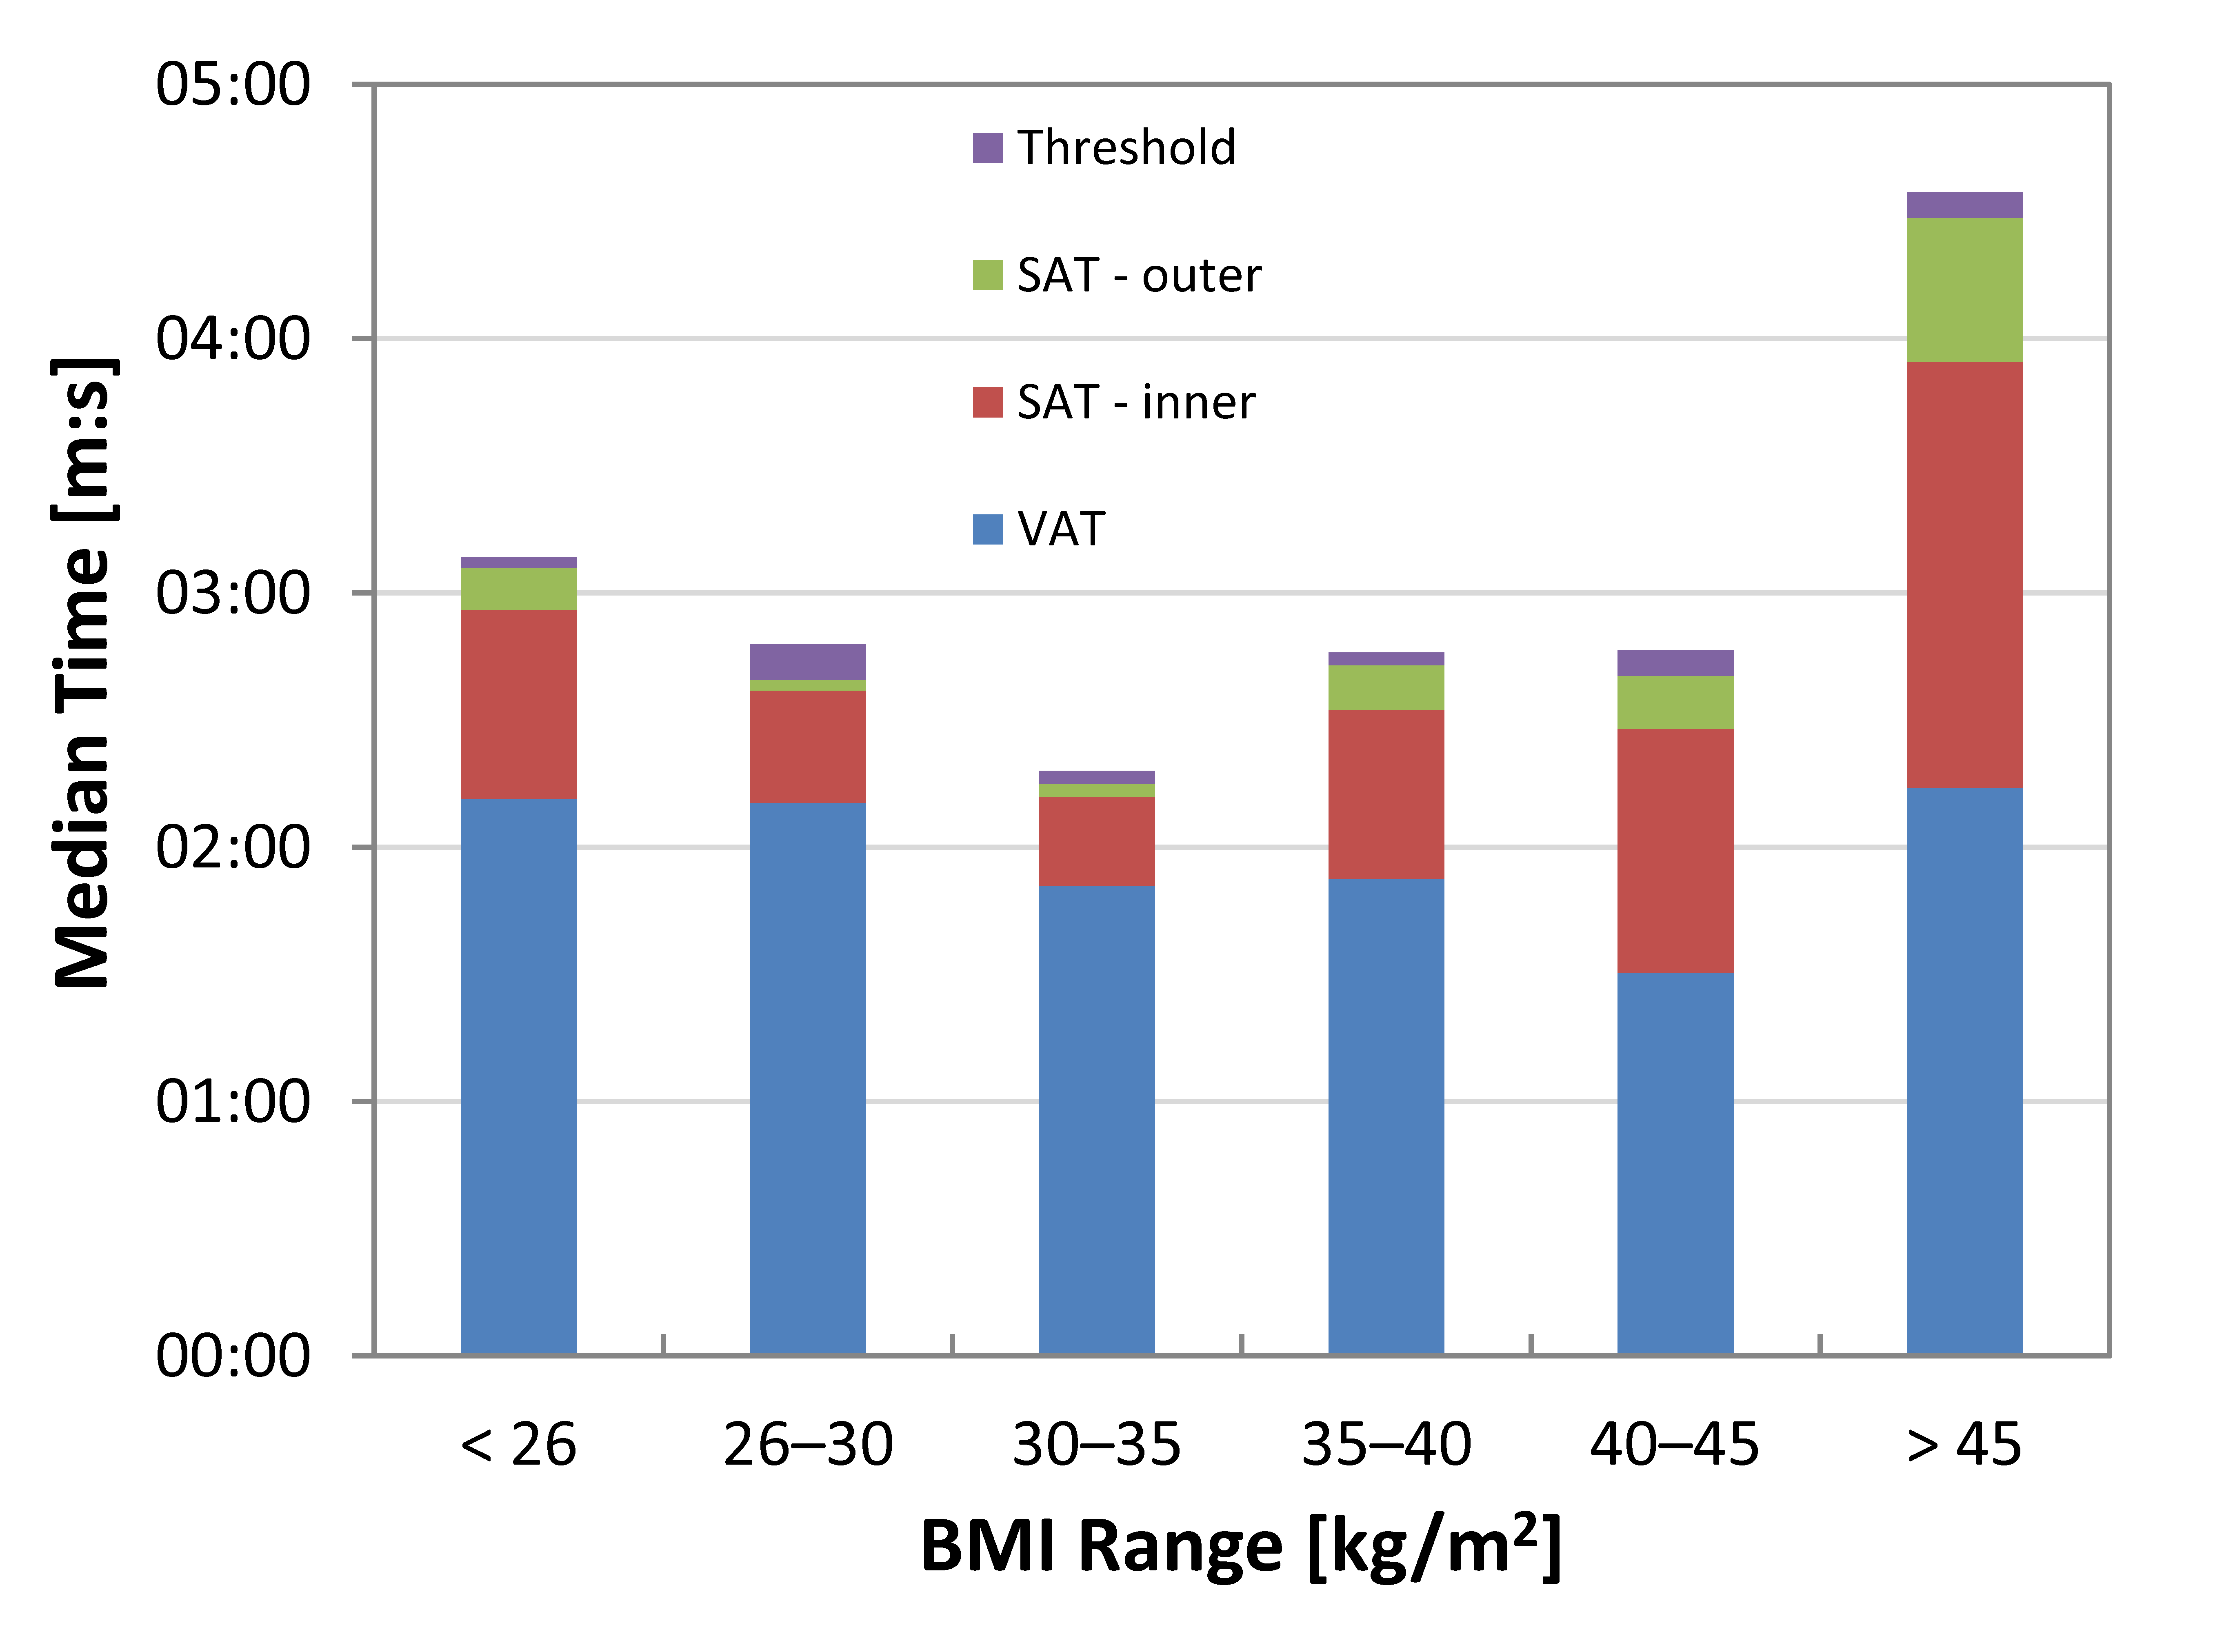
Resulting SAT and VAT volumes were 12.1± 5.1 L (median 15.5 L, 3.8–27.2 L) and 6.2± 3.0 L (median 6.3 L, 1.5–15.5 L), respectively. Automatic processing and segmentation tAS took a negligible 00:28 min (median) per dataset (0.8 s per slice). For 40 OBS+SVR patients, differences in manual correction times tMC between readers were highly significant (Friedman p < .001) with median times per patient of 02:32 (RE), 03:52 (R1) and 03:06 min (R2). Detailed values are plotted in Fig. 2. Significant differences were also found for tTI times (median values between 06:38 and 17:08 min, p < .001). Figure 3 gives an overview of the BMI-specific interaction times for experienced reader RE. Minimum and maximum tMC times were observed for BMI groups OBS (02:22 min) and SUP (04:09 min, Kruskal-Wallis p < .001), respectively; median time exposure over all BMI groups was 02:54 min for RE. Median tTI was 06:33 for OBS and 09:56 min for SUP. Histogram threshold adjustment and VAT mask correction were the least and most time-consuming work steps, respectively.Conclusions
The custom-made software provides a viable option for fast and reliable supervised segmentation of whole-abdominal MRI data within minutes. Image reading and segmentation should be performed by trained readers. Only minimal adjustments – suggesting best automatic preprocessing – were then required for SEV patients (35–40 kg/m2). Pre-segmented data of SUP patients (> 45 kg/m2) took longest to interactively correct for with total interaction times still considered to be tolerable (<10 min).Acknowledgements
Grant support under BMBF 01EO1001 is greatly acknowledged.References
[1] Thörmer G, Bertram HH, Garnov N et al., Software for automated MRI-based quantification of abdominal fat and preliminary evaluation in morbidly obese patients. J Magn Reson Imaging. 2013;37(5):1144-1150.Figures