3441
Metabolic Imaging of Aging Adipose Tissues1Laboratory of Molecular Imaging, Singapore Bioimaging Consortium, Singapore, Singapore, 2Singapore Institute for Clinical Sciences, Singapore, Singapore
Synopsis
There is a global interest in healthy aging and also to avoid metabolic dysfunction. BAT and WAT play an important role in modulating the energy expenditure. In this study we have investigated the interscapular BAT and abdominal adipose tissues in young and old rats. During aging the iBAT activity is reduced due to the increase in “white” like adipocytes. The abdominal adipose tissues including VAT and SAT show increase in adipocyte size resulting in hypertrophy. Modulating these fat depots with nutritional interventions is of significant clinical interest.
Purpose
To investigate the quality of fat during AgingIntroduction
Aging influences the quality of interscapular brown adipose tissue (iBAT) and white adipose tissue (WAT) resulting in metabolic dysfunction and other complications1. The function and quality of BAT activation in both rodents and human can be affected independent of adiposity2. BAT mass and functionality is higher in infant humans and progressively decrease with age3-5. Subcutaneous adipose tissue (SAT) and visceral adipose tissue (VAT) depots play metabolically different roles in the evolution of metabolic syndrome during aging process. In this study we have investigated the effect of age related changes in iBAT and abdominal fat in a rodent model.Methods
All experimental procedures were in compliance and approved by the local institutional committee. Wistar rats (n=8) were longitudinally maintained for 57 weeks on a chow diet. Imagines of these animals were performed at 11 weeks of age (young) and at 57 weeks (old). MRI experiments were performed on 7T Bruker ClinScan system using 72mm volume transmit and 2 x 2 phased array receive only coils. Two point Dixon imaging was performed in iBAT and also in the abdomen. Imaging parameters for iBAT imaging: FOV 54 x 54 mm2, matrix size 256 × 256, resolution 211 μm x 211 μm, slice thickness (ST) 1 mm, TR 8 ms, average 1, flip angle 8°, bandwidths of 1090 and 1500Hz/pixel, TE1/TE2 1/2.5 ms. Imaging parameters for abdomen are similar as used for iBAT except for FOV 76 x 76 mm2, resolution 296 μm x 296 μm. SAT and VAT volumes were computed from lumber 1 (L1) to lumber 5 (L5) regions from abdominal cavity. After terminal experiments, hematoxylin (H) and eosin (E) staining of iBAT and abdominal adipose tissues (gonadal and mesenteric) were performed.Results and Discussion
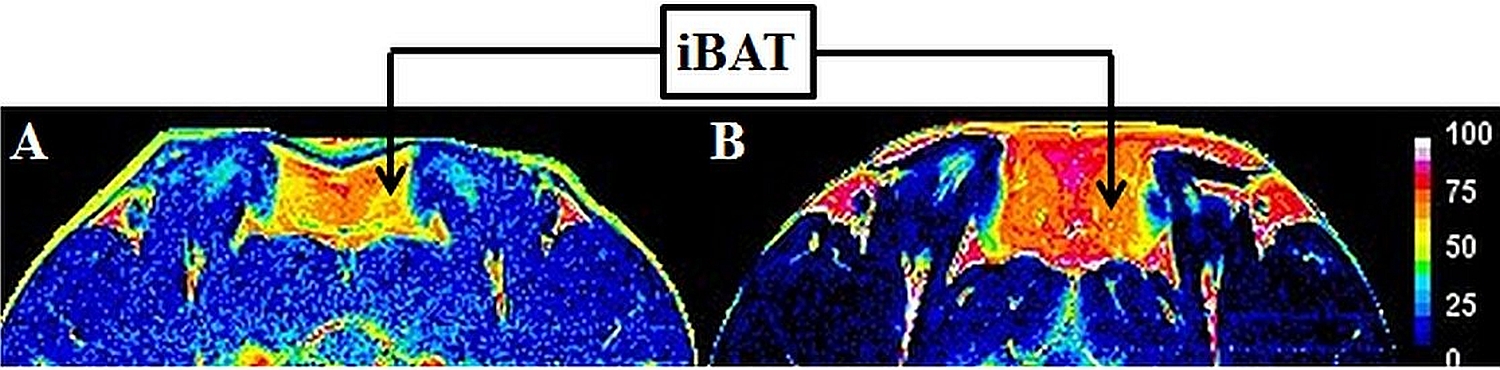
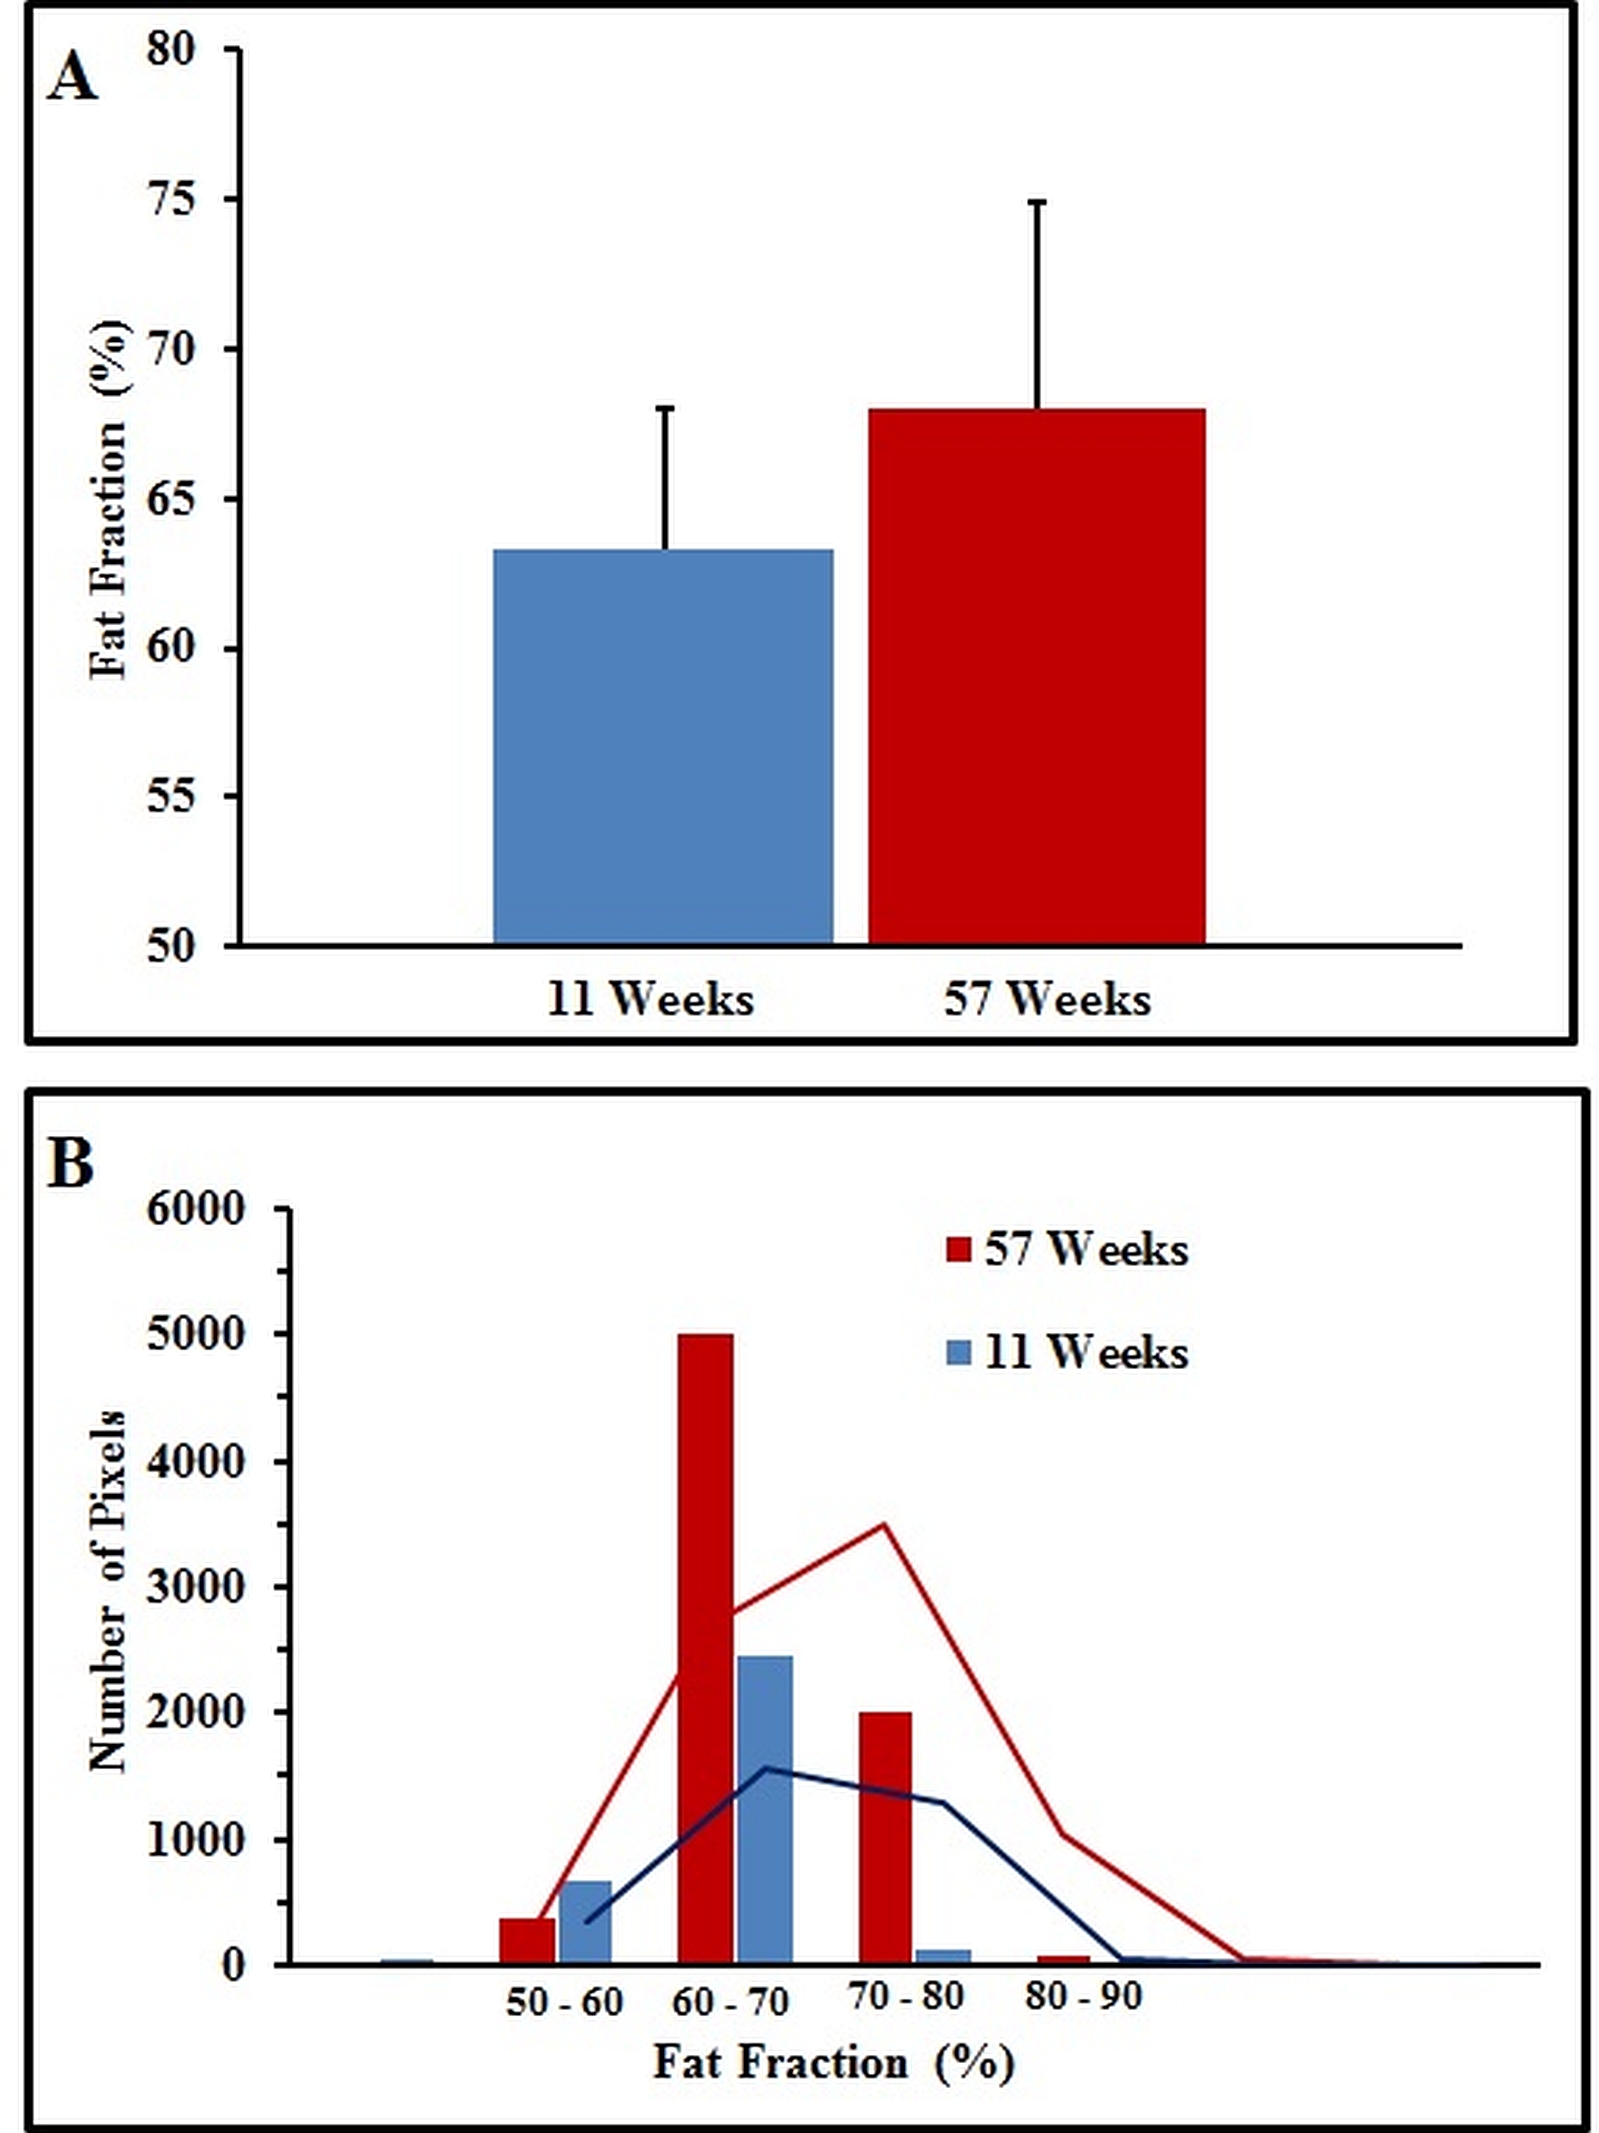
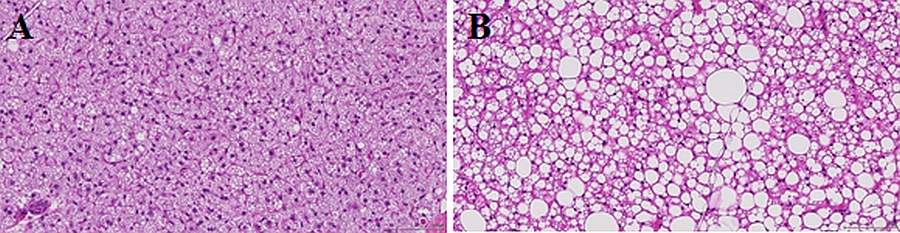
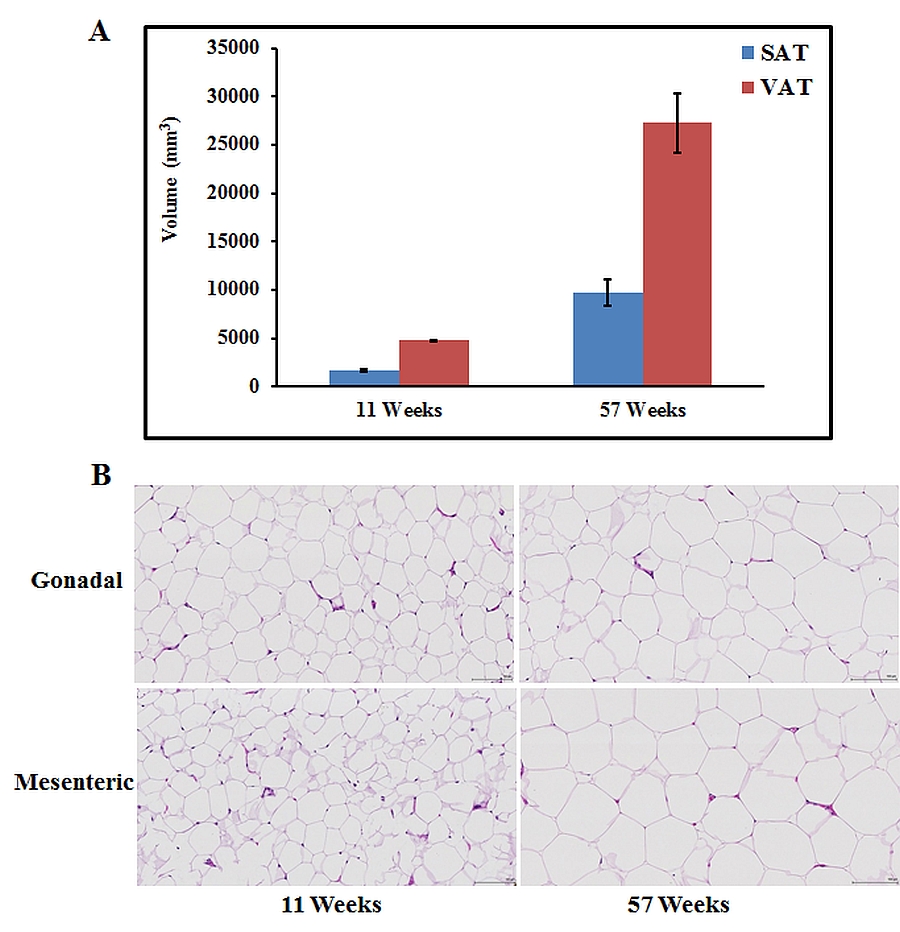
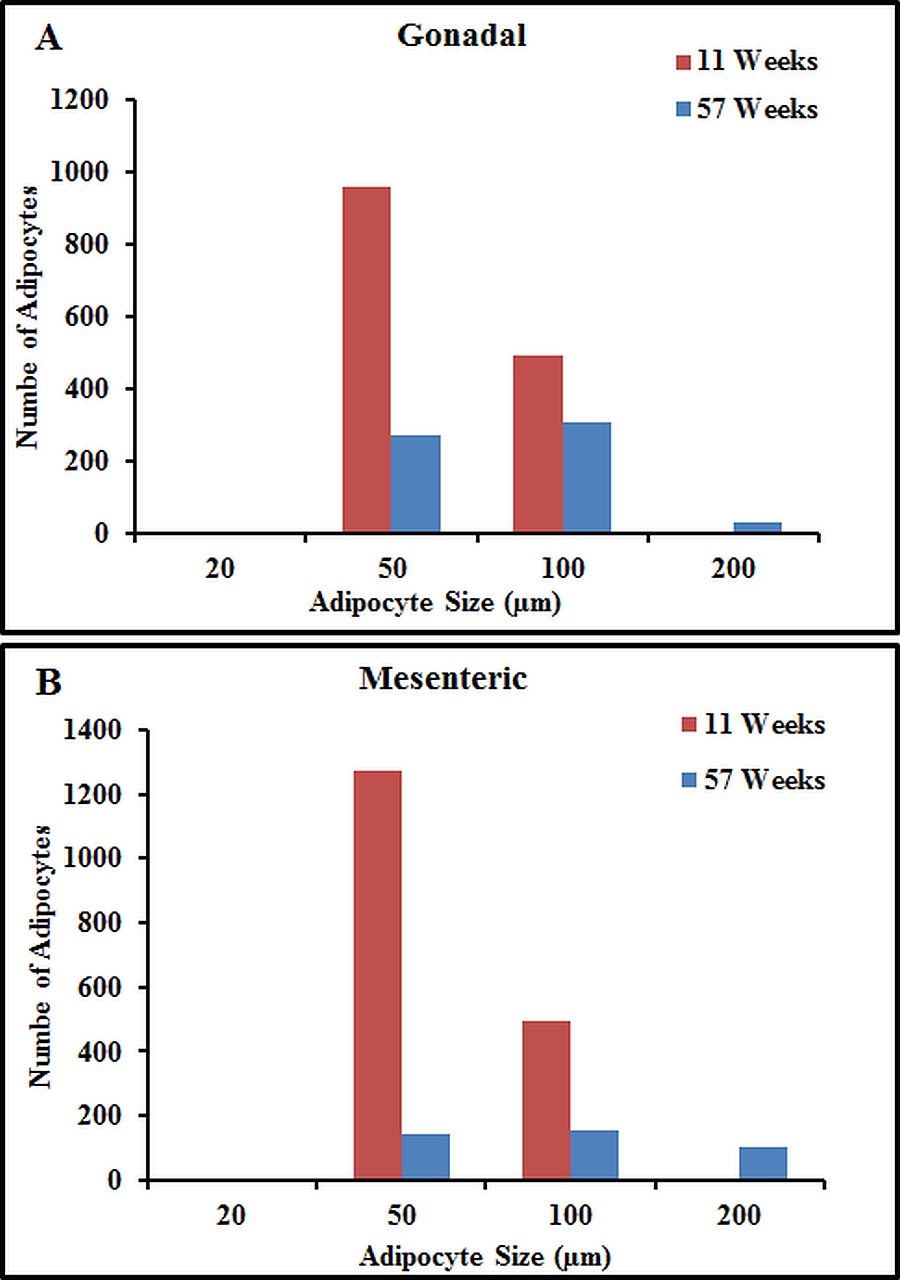
Figures 1A, B show the fat fraction (FF) image of iBAT from the same animal at 11 weeks and at 57 weeks. The ROI analysis of FF (Figure 2A) in iBAT shows increase in FF at the older age. Figure 2B shows the distribution of FF in the same animals at 11 and 57 weeks. The number of pixels with FF 65 ± 5 % increased at 57th week compared to 11 weeks. The number of pixels with FF < 60 % were significantly higher at 11 weeks, whereas the number of pixels with FF > 80% was significantly higher at 57 weeks. Figure 3 shows the corresponding H and E stained images from iBAT at 11 and 57 weeks. At 57 weeks there is an increase in size and number of “white” like adipocytes within iBAT which contributes to the changes in FF. Figure 4A shows the segmented VAT and SAT from at 11 and 57 weeks. The VAT and SAT volumes were 4741 mm3 and 1669 mm3 at 11 weeks which increased to 27323 mm3 and 9721 mm3 respectively at 57 weeks. Figure 4B shows the H & E stained images from gonadal and mesenteric fat depots at 11 and 57 weeks. Figures 5A, B show the the droplet number and size from gonadal and mesenteric compartments. At 57 weeks the number of droplets reduced with increase in size contributing to adipocyte hypertrophy. The mean adipocyte size of the gonadal and mesenteric fat tissues at 11 weeks were 43.16 ± 15.1 µm and 42.40 ± 11.62, which increased to 57.99 ± 26.65 µm and 70.79 ± 34.57 µm at 57 weeks. The adipocyte size in mesenteric compartment is larger compared to other fat depots since it is closer to intestine with more absorption of dietary fat. The increase in size of adipocytes contributes to the adipocyte hypertrophy with aging.Conclusions
Significant increase in fat fraction with the presence of large accumulation of “white” like droplets within iBAT occurs with age. There is a significant remodeling of adipocytes during aging in SAT and VAT compartments. The older rats show increase in adipocyte size contributing to hypertrophy. A hypertrophic adipose tissue has been associated with metabolic impairments. Our results indicate that ageing in the background of a sedentary life style can lead to a deleterious remodeling of BAT and WAT which can lead to metabolic dysfunction. Nutritional or exercise based lifestyle interventions may be potentially required to attenuate the process of ‘whitening’ of BAT and increasing adipocyte hypertrophy of WAT.Acknowledgements
No acknowledgement found.References
(1). Tchkonia T,
et al, Fat tissue, aging, and cellular senescence. Aging Cell. 2010;9:667–684.
(2). Blondin D.P. et al, The Role of BAT in Cardiometabolic Disorders and Aging. Best Pract Res Clin Endocrinol Metab. 2016:30:497-513.
(3). Heaton JM, The distribution of brown adipose tissue in the human. J Anat. 1972;112:35e9.
(4). Edwards L A, et al, Visceral adipose tissue and the ratio of visceral to subcutaneous adipose tissue are greater in adults with than in those without spinal cord injury, despite matching waist circumferences. Am J Clin Nutr. 2008;87:600-607.
(5). Palmer AK, Aging and adipose tissue: potential interventions for diabetes and regenerative medicine. Exp Gerontol. 2016, doi: 10.1016/j.exger.2016.02.013.
Figures