3440
Metabolic Imaging of Brown Adipose Tissue Activation by Exercise in Control and High Fat Diet Fed Rats1Laboratory of Molecular Imaging, Singapore Bioimaging Consortium, Singapore, Singapore, 2Singapore Institute for Clinical Sciences, Singapore, Singapore
Synopsis
Exercise is an important intervention for correction of irregular fat-partitioning and treatment of metabolic dysfunction. There is a large interest in development of non-invasive methods for activation of brown adipose tissue (BAT) due to its potential to combat obesity. In this study we have investigated exercise induced BAT activation and IMCL from skeletal muscle of rodents fed with control and high fat diet. Our results show that exercise modulates the brown fat with reduction in fat fraction, increased UCP1 expression and reduction in “white” like adipocytes in control and high fat diet fed rats.
Purpose
Brown Adipose Tissue activation by exercise in control and high fat diet fed rats.Introduction
Exercise is an important lifestyle intervention for prevention and treatment for metabolic dysfunction1. Exercise can modulate the fat partitioning in the adipose depots and also in skeletal muscle2. There is a large interest in non-invasive approaches for activing brown adipose tissue (BAT) due to its potential for combating obesity and diabetes. Earlier metabolic interventions have utilized cold exposure and drug candidates like CL316243 (β-agonists) for activating BAT. There is large interest in development of non-invasive approaches to activate BAT. Recent studies have shown that exercise can play a role in browning of white adipose tissues3, 4. In our current study we have investigated exercise induced changes in BAT and intramyocellular lipids (IMCL) from skeletal muscle of chow diet and high fat diet fed rats.Methods
All protocols were in compliance and approved by institutional animal care and use committee. Wistar rats (n = 24) were randomized into chow diet (CD) and high fat diet (HFD) groups. Each group was further classified into exercise (n = 6) and non-exercise (n = 6) sub-groups. All in vivo imaging experiments were performed before and after exercise intervention. Animal treadmill (Columbus-1055SRM-E54 Exer-3/6-Dual) was utilized for exercise interventions and rats were habituated to exercise activity by a low intensity exercise protocol (10 to 20 m/min for 10 min per day) for one week. Following the habituation animals were subjected to high-intensity exercise at the rate of 24 m/min for 45 min/day for 4 weeks. Fat fraction from BAT and skeletal muscle IMCL (tibialis anterior) were measured before and after 4 weeks of exercise intervention. MR imaging experiments were performed using a 7 T Bruker scanner using a 72 mm volume resonator for RF transmits in combination with 20 mm receive-only coil for signal reception. Two point Dixon imaging was performed with FOV 55 × 55 mm2, matrix size 256 × 256, in-plane resolution 0.214 μm x 0.214 μm, slice thickness 1 mm, TR 8 ms, averages 1, flip angle 8°, echo bandwidths of 1090 and 1500Hz/pixel, with out-of-phase (1.0 ms) and in-phase (2.5 ms) echo times. Localized PRESS measurements were performed in tibialis anterior muscle with a voxel size of 27 mm3, TR 4 s, TE 13 ms, 2048 complex points, average 128 and spectral width of 3500 Hz. Spectra were analyzed using LC Model5. After terminal experiments, BAT tissue samples were subjected to Hematoxylin and Eosin (H&E) and UCP-1 antibody staining on 5 µm tissue section and stained images were captured at 20 × optical magnifications by using Aperio ScanScope instrument.Results and Discussion
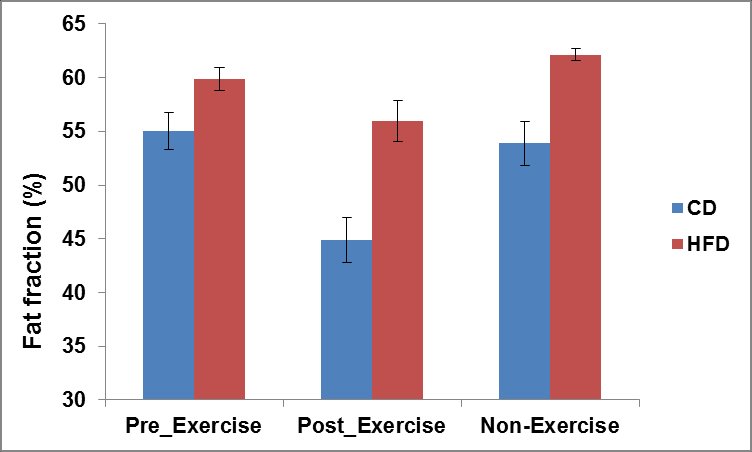
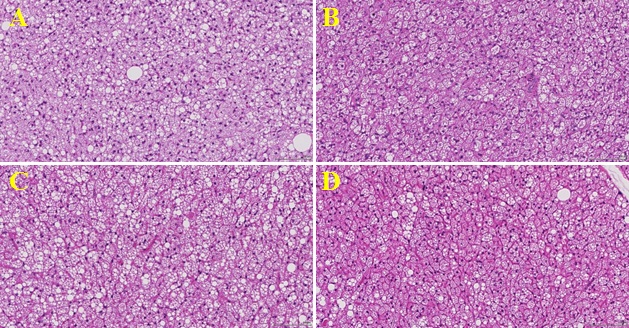
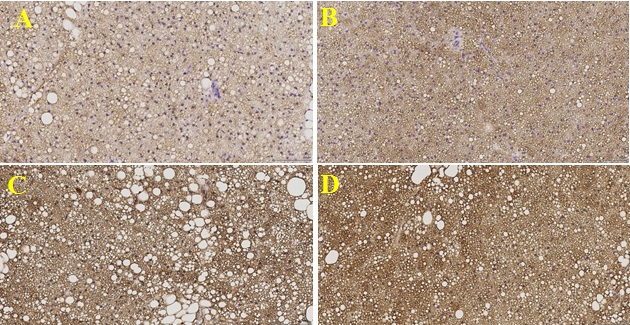
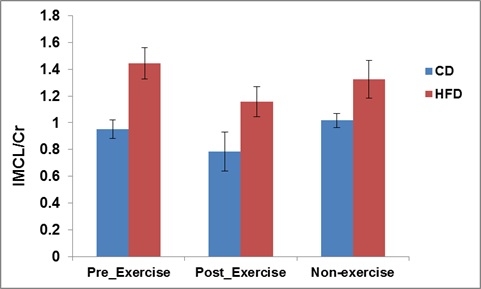
Exercise stimulates sympathetic nervous system and activates BAT to increase thermogenic capacity3. Figure 1 shows the quantitative fat fraction (FF) values from BAT for pre- exercise, post-exercise and non-exercise groups fed with chow and high fat diet. The FF in CD fed animals reduced from 55.03 ± 1.7 % to 44.09 ± 2.1 % after exercise intervention. The FF in HFD fed animals reduced from 59 ± 1.0 % to 55 ± 1.8 % due to exercise intervention. The FF after exercise in HFD group reduced significantly (P < 0.04) compared to non-exercise group. The reduction in fat fraction is associated with increased energy expenditure by exercise. Figures 2A, B show the H & E stained images from CD group without and with exercise intervention. Figures 2C, D show similar images from HFD fed group. The exercise intervention groups from both CD and HFD show reduction in “white” like droplets within BAT and also in size which is in agreement with the changes in FF within BAT. Figures 3 A, B, C and D show the UCP-1 antibody stained images from BAT obtained from CD and HFD groups. Figures 3A, B show the CD group without and with exercise intervention. Figures 3C, D show similar images for HFD group. The exercise groups from both CD and HFD groups show increased browning due to increased UCP-1 expression. The large “white” like adipocytes is also reduced in the exercise trained groups. Figure 4 shows the skeletal muscle IMCL from CD and HFD fed animals pre- and post-exercise intervention. The exercise groups show reduction in IMCL due to increased energy expenditure.Conclusions
Exercise-induced adrenergic receptor stimulation activates BAT resulting in reduction of FF. Skeletal muscle IMCL also reduced with exercise due to increased energy expenditure. The exercise groups also show increased UCP-1 expression and brown adipocytes. The HFD groups with exercise show significant reduction in “white” like adipocytes. Our results show promise for activation of brown fat with exercise which can be translated to a clinical setting.Acknowledgements
No acknowledgement found.References
(1) Wallberg-Henriksson H et.al., Nat Rev Endocrinol. 2015 Apr;11(4):198-200.
(2) Gopalan V et.al, Sci Rep. 2016 May 20;6:26445.
(3) De Matteis R et.al., Nutr Metab Cardiovasc Dis. 2013 Jun;23(6):582-90.
(4) Sanchez-Delgado G et.al., Ann Nutr Metab. 2015;67(1):21-32.
(5) Provencher et. al., NMR Biomed. (2001) 14, 260.
Figures