3439
Identification and in vivo quantification of fatty acid metabolism in liver of a lipogenic methionine-choline-deficient diet-fed animal model by using magnetic resonance spectroscopy at 9.4 T1Department of Biomedical Engineering, and Research Institute of Biomedical Engineering, The Catholic University of Korea College of Medicine, Seoul, Korea, Republic of
Synopsis
Non-alcoholic steatohepatitis (NASH) is associated with metabolic syndrome as a result of insulin resistance and the accumulation of lipid droplets within hepatocytes. There is a need to diagnose and to accurately assess the progressive severity of hepatic steatosis with non-invasive biomarkers that are distinguishable from those in non-alcoholic fatty liver disease (NAFLD). Our findings demonstrate that fatty acid metabolism (saturated- and unsaturated-fatty acids) of hepatic steatosis induced by a methionine-choline diet can be distinguished from progressive NAFLD by using high-resolution magnetic resonance spectroscopy (MRS).
Purpose
Non-alcoholic steatohepatitis (NASH) is present in metabolic syndrome with hallmarks of low levels of high-density lipoproteins, insulin resistance, and accumulation of lipid droplets within hepatocytes1. The impaired ability of the liver is attributed to a lack of choline such as methionine. A widely used rodent model of NASH, characterized by oxidative stress, inflammation, and steatosis, is generated by feeding mice with a methionine-choline-deficient (MCD) diet for a minimum of 5 weeks2. There is a need to accurately diagnose and assess the progressive severity of hepatic steatosis with non-invasive biomarkers (i.e. lipid contents and composition) that are distinguishable from non-alcoholic fatty liver disease (NAFLD). Proton magnetic resonance spectroscopy (1H MRS) can be used to examine changes in the hepatic metabolome associated with fat composition and fat quantity in the region of interest. The objective of this study was to demonstrate if there are changes in fatty acid metabolism in liver of MCD diet-fed animal model using in vivo high-resolution spectra at 9.4 T.Materials and Methods
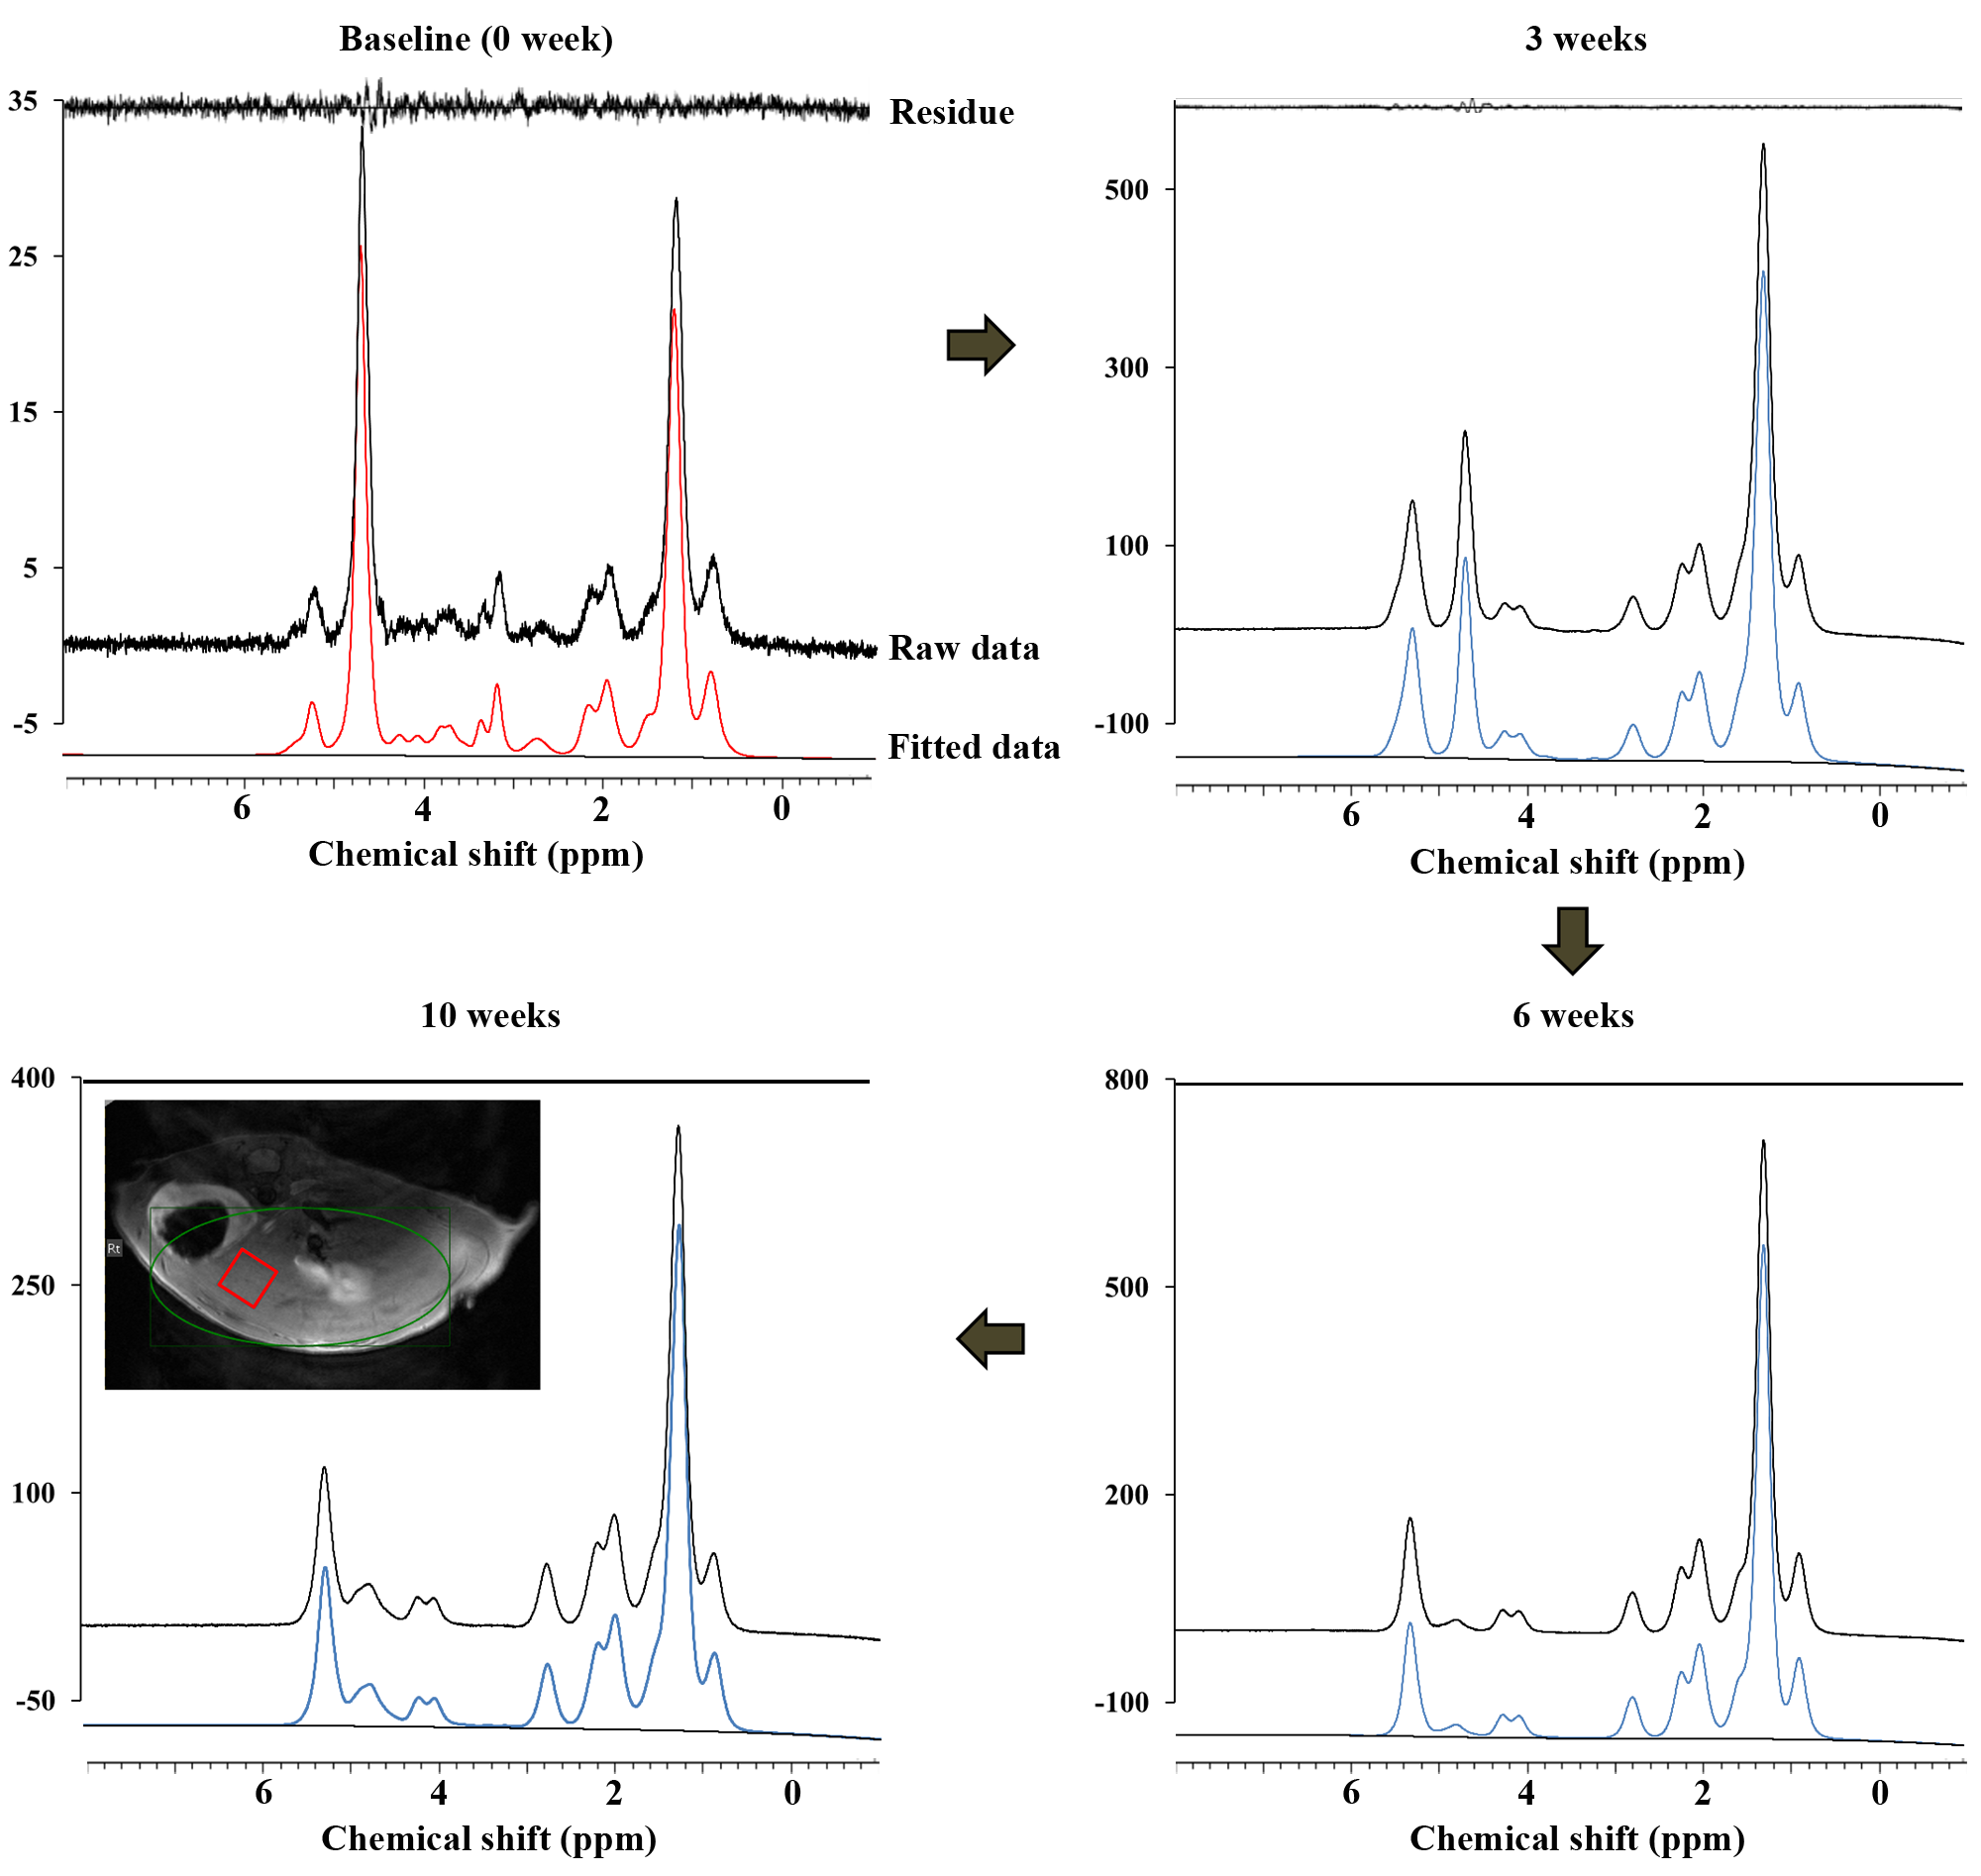
For the MCD diet-fed studies, weight-matched, 8-week-old, male C57BL/6J mice were housed in plastic cages with ad libitum access to water and were on the MCD diet for a period of 10 weeks. The examinations were performed on a horizontal 9.4 T Bruker MR scanner with receive-only 4-channel animal coil for higher resolution of the moues liver imaging and spectroscopy. After scout imaging, T1 and T2 weighted images were acquired in three orthogonal planes before selection of a single-voxel position. To avoid large blood vessels, a volume of interest (VOI, 3.0×3.0×3.0 mm3 [27.0 µL]) was selected in a homogeneous parenchyma. For this, we used localized point-resolved spectroscopy (PRESS; repetition time [TR]/echo time [TE] = 5000/16.8 ms; NSA = 128; acquisition data point = 2048; spectral width = 5000 Hz). The water suppression of each VOI was achieved by applying variable pulse power and optimized relaxation delay (VAPOR) before the scan. All MR spectroscopic data were quantified using Linear Combination of Model spectra software (LCModel, version 6.3.1-1K), which is useful for fitting the data acquired. For hepatic fatty acid composition measurements, total lipid quantity (TL; (-CH2-)n/H2O+(-CH2-)n) was measured from non-water suppressed MR spectra of the liver maintained on a MCD diet (PRESS; TR/TE = 5000/16.08 ms; NSA = 64; acquisition data point = 2048; spectral width = 5000 Hz; VOI = 3.0 × 3.0 × 3.0 mm3 [27.0 µL]). The Saturated component (SC; 3(CH2)n/2(CH3)) was used as an estimate of saturated fatty acids. The unsaturated components (total unsaturated fatty acid index (TUFA; 3(-CH2-CH=CH-CH2)/4(-CH3)), the total unsaturated bond index (TUBI; 3(-CH=CH-)/2(-CH3)), and the polyunsaturated bond index (PUBI; 3(-CH=CH-CH2-CH=CH-)/2(CH3)) were scaled to the terminal methyl group (-CH3) resonances as an internal reference3. For statistical analysis, we used repeated measures analysis of variance (ANOVA) to analyze the overall changes of lipid composition for 10 weeks with the MCD diet with Bonferroni post hoc comparisons.Results
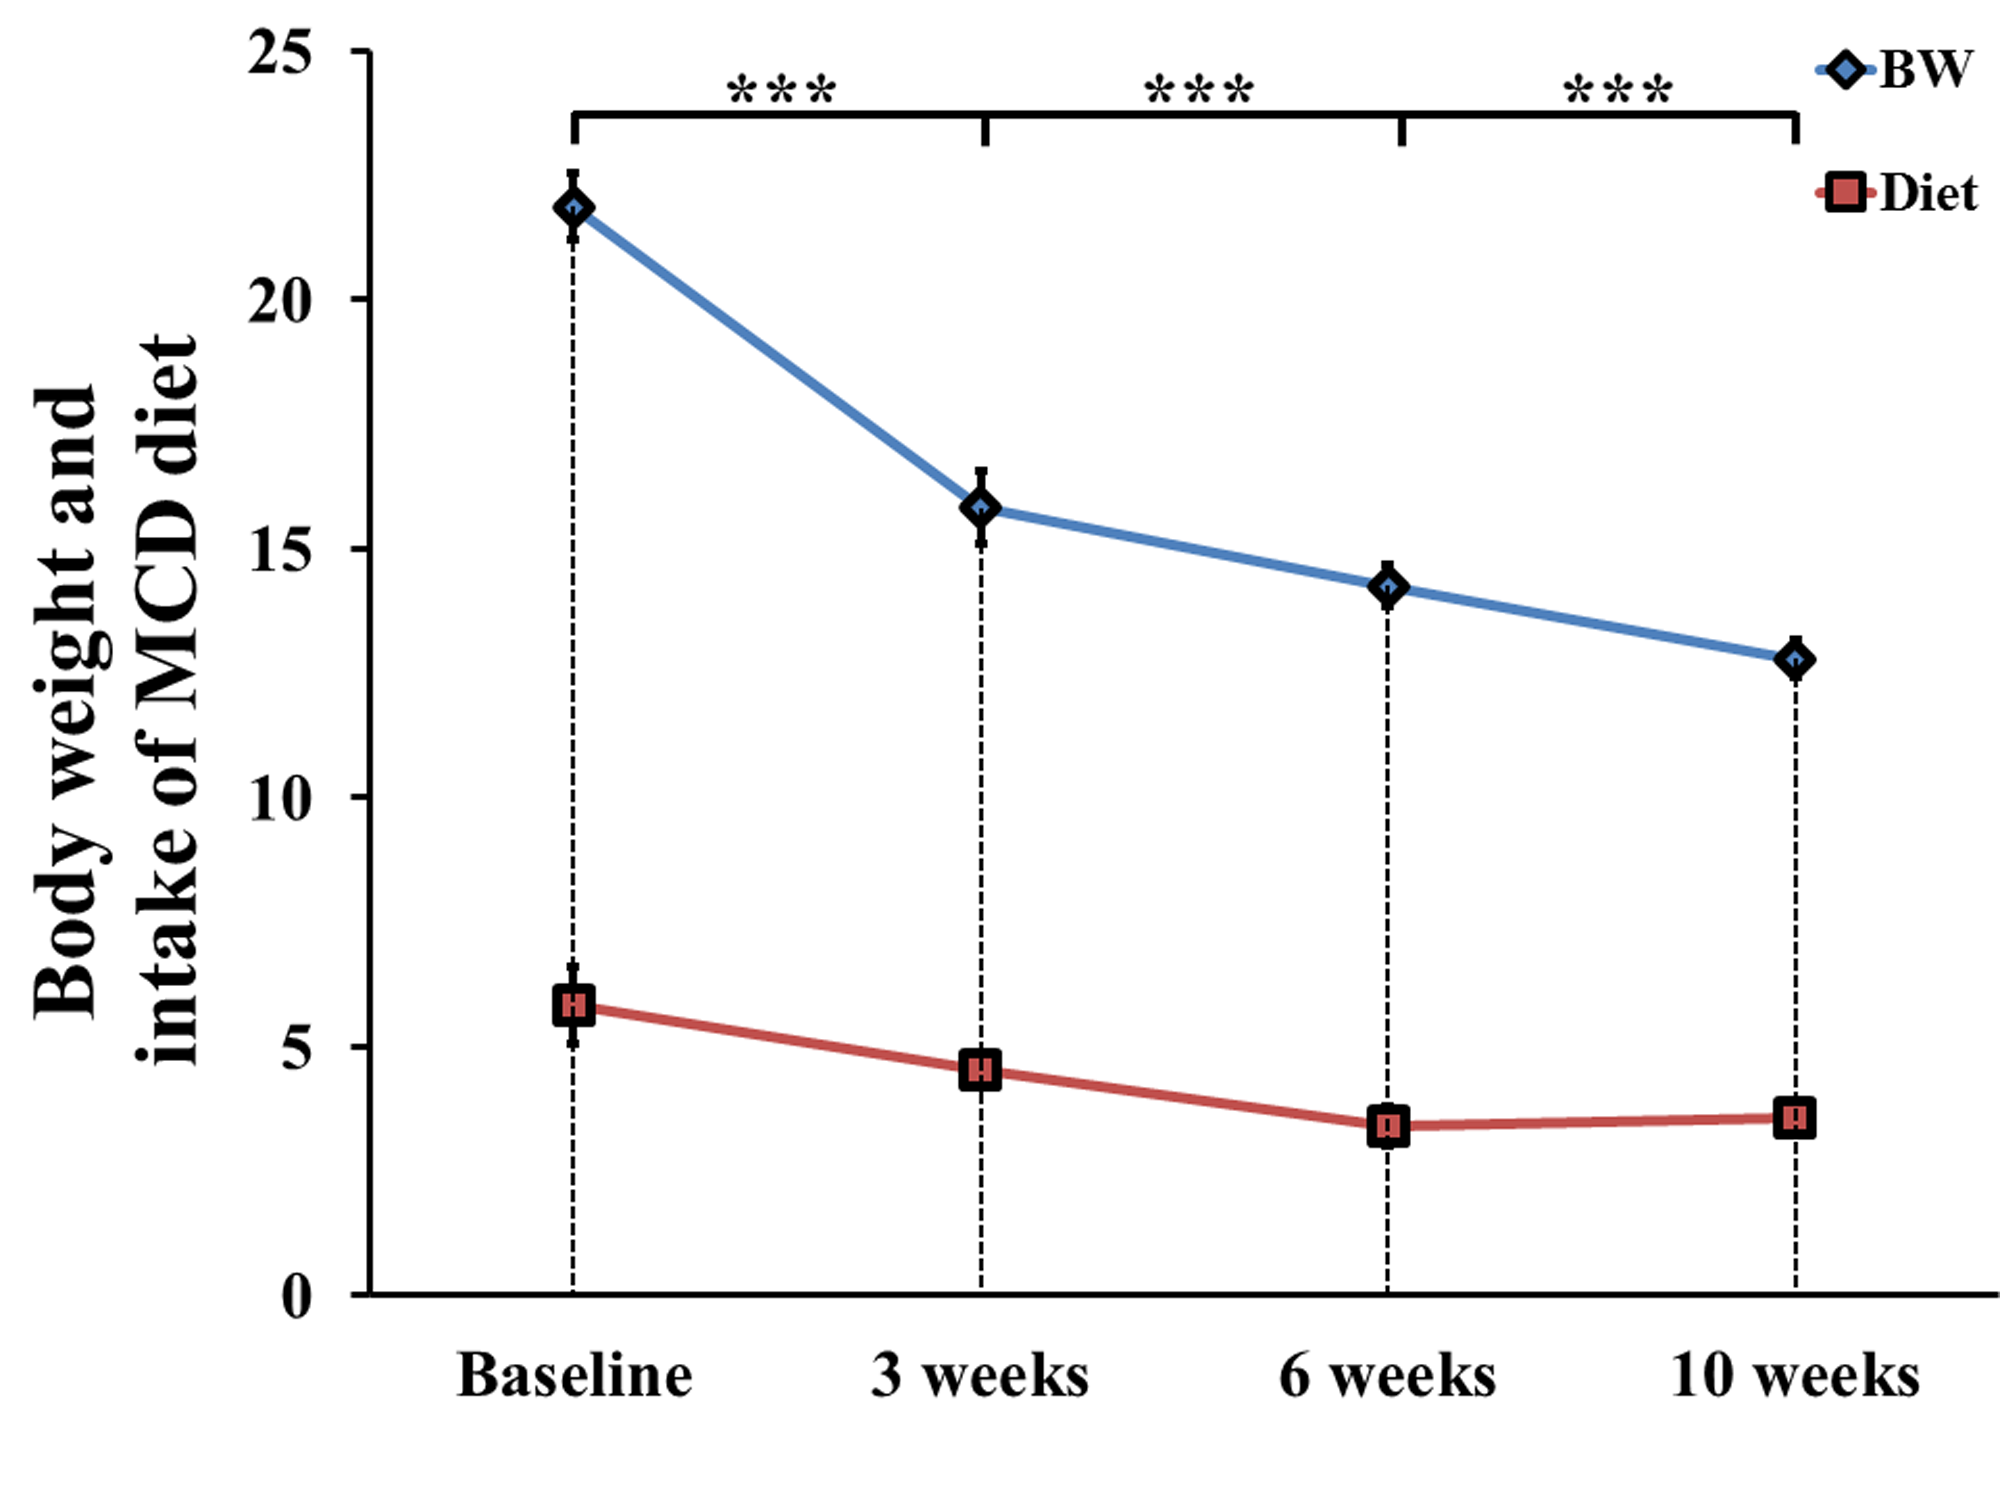
In MCD diet mice, the mean volume intake of MCD pellets was maintained at 4.33 ± 0.20 g/day for 10 weeks. In addition, the body weight of MCD diet-fed mice gradually decreased (p < 0.001, Figure 1). Figure 2 is the comparison of relative lipid resonances in the studied liver from weeks 0 to 10 with triglyceride resonances. In the mice with MCD-induced NASH, total lipid and saturated component values were significantly upregulated in MCD diet-fed mice in comparison to the values at week 0 (Figure 3 and 4). The effect on lipid accumulation was statistically significant in terms of total lipid content at 3 weeks (p < 0.001), 6 weeks (p < 0.01), and 10 weeks (p < 0.01) after initiation of the MCD diet. Furthermore, the changes with correlation in TUFA and TUBI were statistically significant at the time points of 10 weeks (p < 0.05), inclusively.Discussion and Conclusion
For sufficient spectral resolution to detect resonances from saturated and unsaturated fatty acids, we implemented the localized PRESS sequence with respiratory gating. NASH is a disease with no effective treatment and is difficult to diagnosis. We observed rapid weight loss due to significant calorie restriction for lipolysis in the adipose tissue4. In addition, this is consistent with increased saturated and monounsaturated fatty acids and decreased polyunsaturated fatty acids in the livers isolated for biopsy from NASH animal model5. In this study, there was an increase in the hepatic unsaturated fatty acid levels during the development of NASH. In conclusion, our findings support that fatty acid metabolism in hepatic steatosis caused by a MCD diet can be distinguishable from progressive NAFLD by using high resolution, localized MRS.Acknowledgements
This study was supported by grants (2012-007883) from the Mid-career Researcher Program through the National Research Foundation (NRF) funded by the Ministry of Science, ICT & Future Planning (MSIP) of Korea. And, this research was supported by a grant of the Korea Health Technology R&D Project through the Korea Health Industry Development Institute (KHIDI), funded by the Ministry of Health & Welfare, Republic of Korea (grant number: HI14C1135).References
1. Cohen JC, Horton JD, Hobbs HH. Human fatty liver disease: old questions and new insights. Science, 2011;332(6037):1519-1523.
2. Tomita K, Tamiya G, Ando S, et al. Tumour necrosis factor α signalling through activation of Kupffer cells plays an essential role in liver fibrosis of non-alcoholic steatohepatitis in mice. Gut, 2006;55(3):415-424
3. Corbin IR, Furth EE, Pickup S, et al. In vivo assessment of hepatic triglycerides in murine non-alcoholic fatty liver disease using magnetic resonance spectroscopy. Biochim Biophys Acta Mol Cell Biol Lipids, 2009;1791(8):757-763.
4. Coppack SW, Jensen MD, Miles JM. In vivo regulation of lipolysis in humans. J Lipid Res, 1994;35(2):177-193.
5. Puri P, Baillie RA, Wiest MM, et al. A lipidomic analysis of nonalcoholic fatty liver disease. Hepatology, 2007;46(4):1081-1090.
Figures