3437
Receiver operating characteristic analysis of fat fraction reveals no universal cut-off to reliably identify in vivo brown adipose tissue in adult humans1Department of Radiology, University Hospitals Coventry & Warwickshire NHS Trust, Birmingham, United Kingdom, 2Warwick Medical School, University of Warwick, Coventry, United Kingdom, 3Medical Physics, University Hospitals Coventry & Warwickshire NHS Trust, Coventry, United Kingdom, 4Department of Endocrinology, University Hospitals Coventry & Warwickshire NHS Trust, Birmingham, United Kingdom
Synopsis
Lower fat content within brown adipose tissue (BAT) compared to white adipose tissue (WAT) has been exploited using Dixon-based MRI imaging methods to visualize BAT but is subject to inter-rater variability. To determine the optimal fat fraction threshold for identifying BAT, receiver operating characteristic (ROC) analyses of fat fraction maps derived from 3 point IDEAL MRI scans were performed for sixteen subjects.
This method had good-to-excellent accuracy in four cases, and fair accuracy in two, but failed in ten. A single universal cut-off point to differentiate BAT and WAT could not be identified, instead the optimal thresholds varied between individuals.
Purpose
Lower fat content within BAT compared to white adipose tissue (WAT) has been exploited using Dixon-based MRI to visualize BAT in rodents1, human infants2 and adults3. Visual identification of BAT based on differences in signal intensity yielded promising results in a single case4, but was subject to considerable inter-rater variability. We aimed to determine an optimal threshold for discriminating between BAT and WAT in vivo in adult humans on the basis of receiver operating characteristic analysis of fat-fraction images.Method
Sixteen volunteers were recruited (9 females, 7 males; mean age 44.2 ± 19.2 years) on the basis of demonstrating BAT uptake on 18F-FDG PET/CT performed for clinical reasons. Each underwent a 3-echo TSE IDEAL sequence on a GE 3T HDxt MRI scanner (GE Medical Systems, Milwaukee, USA). Axial 2.5 - 5mm images were obtained from the upper neck to mid-thorax using a cardiac receiver coil. IDEAL sequence parameters were: TR(ms)/TE(ms)/matrix/NEX/FoV(cm) = 440/10.7-11.1/512 x 512/3/30-40. This generated water-only and fat-only images, which were post-processed using ImageJ5 to produce fat fraction maps. PET/CT images were registered to the MRI images using image fusion software (Mirada XD 4.3, Mirada Medical, Oxford, UK). BAT depots were delineated on the PET/CT scans by semi-automatically defining isocontours set at a standardized uptake value (SUV) of 2.5 g/ml and transposed onto the fat fraction map (BATPET). WAT depots were defined by placing regions of interest (ROIs) in subcutaneous adipose tissue (Figure 1). Receiver operating characteristic (ROC) analyses were performed for each subject. ROC curves were generated to plot true positivity rate (sensitivity) against false positivity rate (1-specificity) for different fat fraction cut-off points, and the accuracy denoted by the area under the curve (AUC). The optimal cut-off points for distinguishing BAT and WAT were determined for each subject using Youden’s J statistic6. BAT volumes were calculated based on these heuristic thresholds (BATMRI) and compared with the corresponding BATPET volumes on 18F-FDG PET/CT using Bland Altman plots.Results
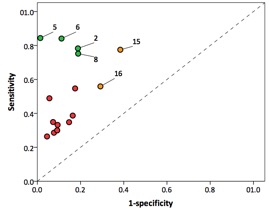
ROC analysis showed considerable variation in the discriminatory ability of fat fraction to differentiate BAT and WAT (AUC 0.50 – 0.92). The optimal thresholds for identifying BAT varied between subjects (fat fraction 68.1% - 85.3%, Figure 2), with resulting variation in sensitivity (0.26 – 0.84) and specificity (0.62 – 0.99) when using these thresholds to segment BAT (Figure 3).
Thresholding on the basis of fat fraction was excellent or good at separating BAT and WAT in four cases (2, 5, 6 and 8), with AUC ranging from 0.84 to 0.92. For cases 2,5 and 6 the fat fraction threshold was 80 - 81%. For case 8 the optimal threshold was considerably lower at 68.1%. Fat fraction was fairly effective in separating BAT and WAT in two cases: 15 and 16 (AUC 0.76 and 0.71 respectively). In 10 patients (1, 7, 9-14, 17 and 18) fat fraction was poor at discriminating BAT and WAT (AUC 0.25 – 0.68).
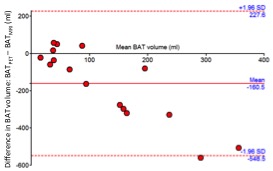
Bland Altman plots showed that the BAT volumes derived from BATMRI ROIs tended to be higher than those derived from the PET/CT scans (Figure 4). It is noteworthy that of the four cases with the highest AUCs (2, 5, 6 and 8), BATMRI grossly overestimated the volume compared with BATPET in three (Figure 1), although there was no overall correlation between BATPET volume and AUC (r2 = 0.10).
Discussion
This method had good-to-excellent accuracy in four cases, fair accuracy in two, but failed in ten. A single universal cut-off point to differentiate BAT and WAT could not be identified, instead the optimal thresholds varied between individuals, from 68.1% to 81.0% fat fraction. Therefore this technique could not be extrapolated to prospectively identify in situ human BAT. Segmentation on the basis of fat fraction tended to generate higher BAT volumes compared with PET/CT, although we cannot conclude which modality is more accurate. This disparity may be a significant limitation as the aim of BAT imaging is to quantify BAT, and detect a quantitative change following stimulation.
Metabolically active BAT undergoes localized lipolysis with a corresponding reduction in fat fraction7, which should be detectable on MRI. PET/CT and MRI scans were not performed concurrently, instead being performed months, occasionally years apart (mean interval 47.8 ± 50.5 weeks, range 1.4 – 258.1 weeks), which may account for the lack of correlation between BAT volumes on PET and MRI – potentially allowing time for hyperplasia or involution of BAT in the interim.
Conclusion
No universal cut-off could be identified to reliably differentiate between BAT and WAT in vivo in adult humans on the basis of fat fraction.Acknowledgements
Thanks to Mr Eddie Ng’andwe, Research Radiographer and Mr Timor Kadir of Mirada Medical Ltd.References
(1) Hu HH, Smith DL, Jr., Nayak KS, Goran MI, Nagy TR. Identification of brown adipose tissue in mice with fat-water IDEAL-MRI. J Magn Reson Imaging. 2010;31(5):1195-1202.
(2) Hu HH, Tovar JP, Pavlova Z, Smith ML, Gilsanz V. Unequivocal identification of brown adipose tissue in a human infant. J Magn Reson Imaging. 2012;35(4):938-942.
(3) Holstila M, Virtanen KA, Grönroos TJ, et al. Measurement of brown adipose tissue mass using a novel dual-echo magnetic resonance imaging approach: A validation study. Metabolism: clinical and experimental. 2013;62(8):1189-1198.
(4) Reddy NL, Jones TA, Wayte SC, et al. Identification of brown adipose tissue using MR imaging in a human adult with histological and immunohistochemical confirmation. J Clin Endocrin Metab. 2014;99(1):E117-E121.
(5) Schindelin J, Arganda-Carreras I, Frise E, et al. Fiji: an open-source platform for biological-image analysis. Nature methods. 2012;9(7):676-682.
(6) Youden WJ. Index for rating diagnostic tests. Cancer. 1950;3(1):32-35.
(7) Hu HH, Chung SA, Nayak KS, Jackson HA, Gilsanz V. Differential computed tomographic attenuation of metabolically active and inactive adipose tissues: preliminary findings. J Comput Assist Tomogr. 2011;35(1):65-71.
Figures