3436
Spin Densities and Relaxation Parameters of the Spectral Components of Brown Fat and Subcutaneous Fat with Localized 1H-MRS at 3T.1Biomedical and Metabolic Imaging Branch, NIDDK, Bethesda, MD, United States, 2Diabetes, Endocrinology, and Obesity Branch, NIDDK, Bethesda, MD, United States, 3PET, NIH Clinical Center, Bethesda, MD, United States
Synopsis
1H-MRS was used to measure relaxation properties, lipid peak ratios and water content of white adipose tissue (WAT) and brown adipose tissue (BAT) in humans with the aim of providing information that can be used to improve MRI based methods for identifying BAT.
PURPOSE
Active human brown adipose tissue (BAT) is commonly quantified using PET/CT which involves radiation exposure. To help development of MRI techniques that avoid radiation and can distinguish active and even inactive BAT from white adipose tissue (WAT), we explored 1H-MRS for measuring the relaxation properties, lipid peak ratios and fat content of BAT and WAT in healthy human subjects.METHODS
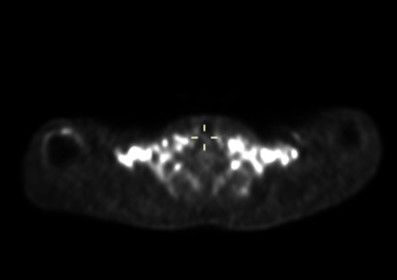
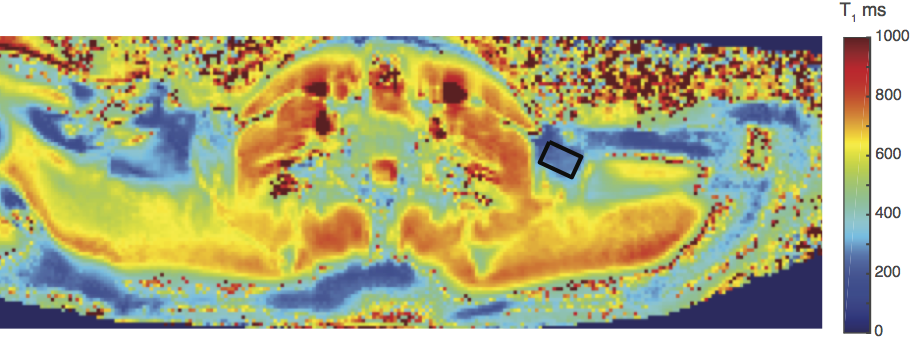
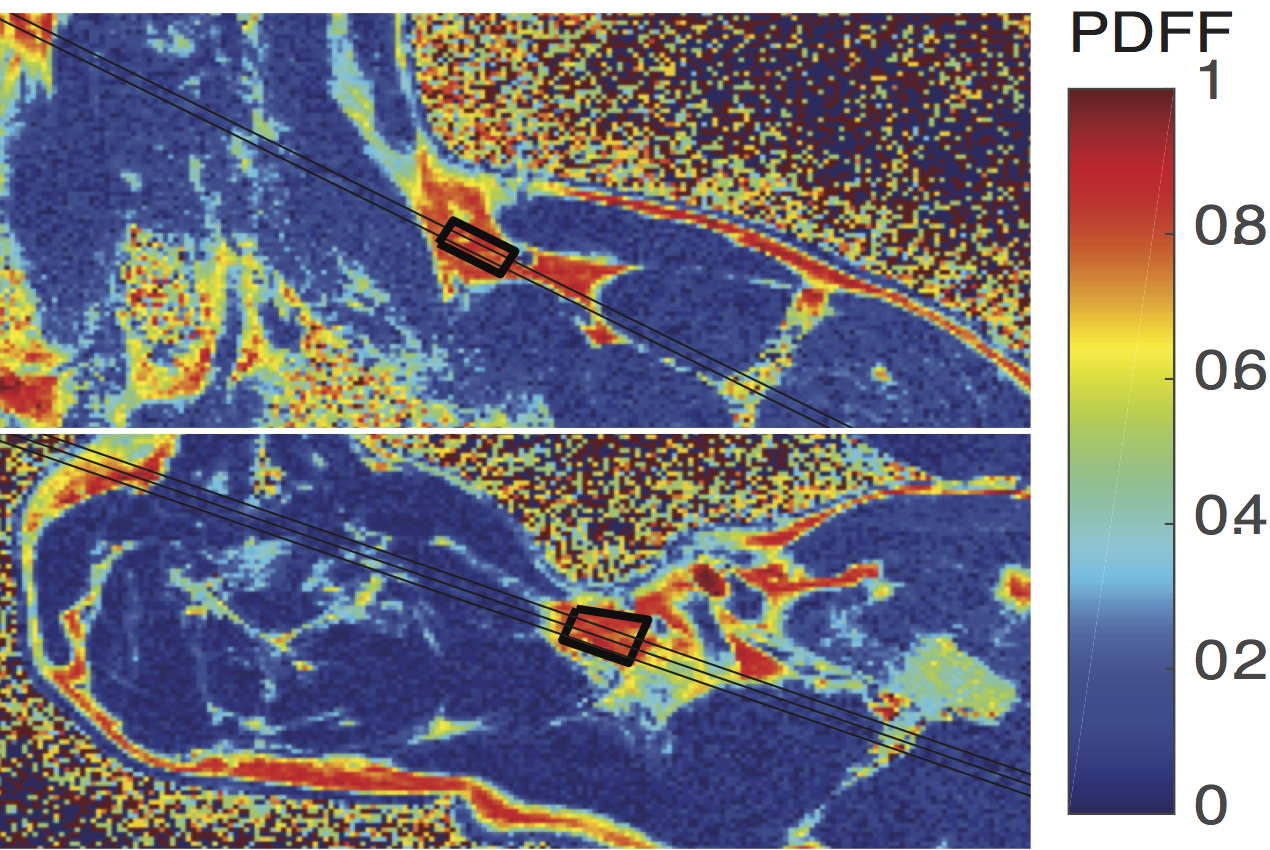
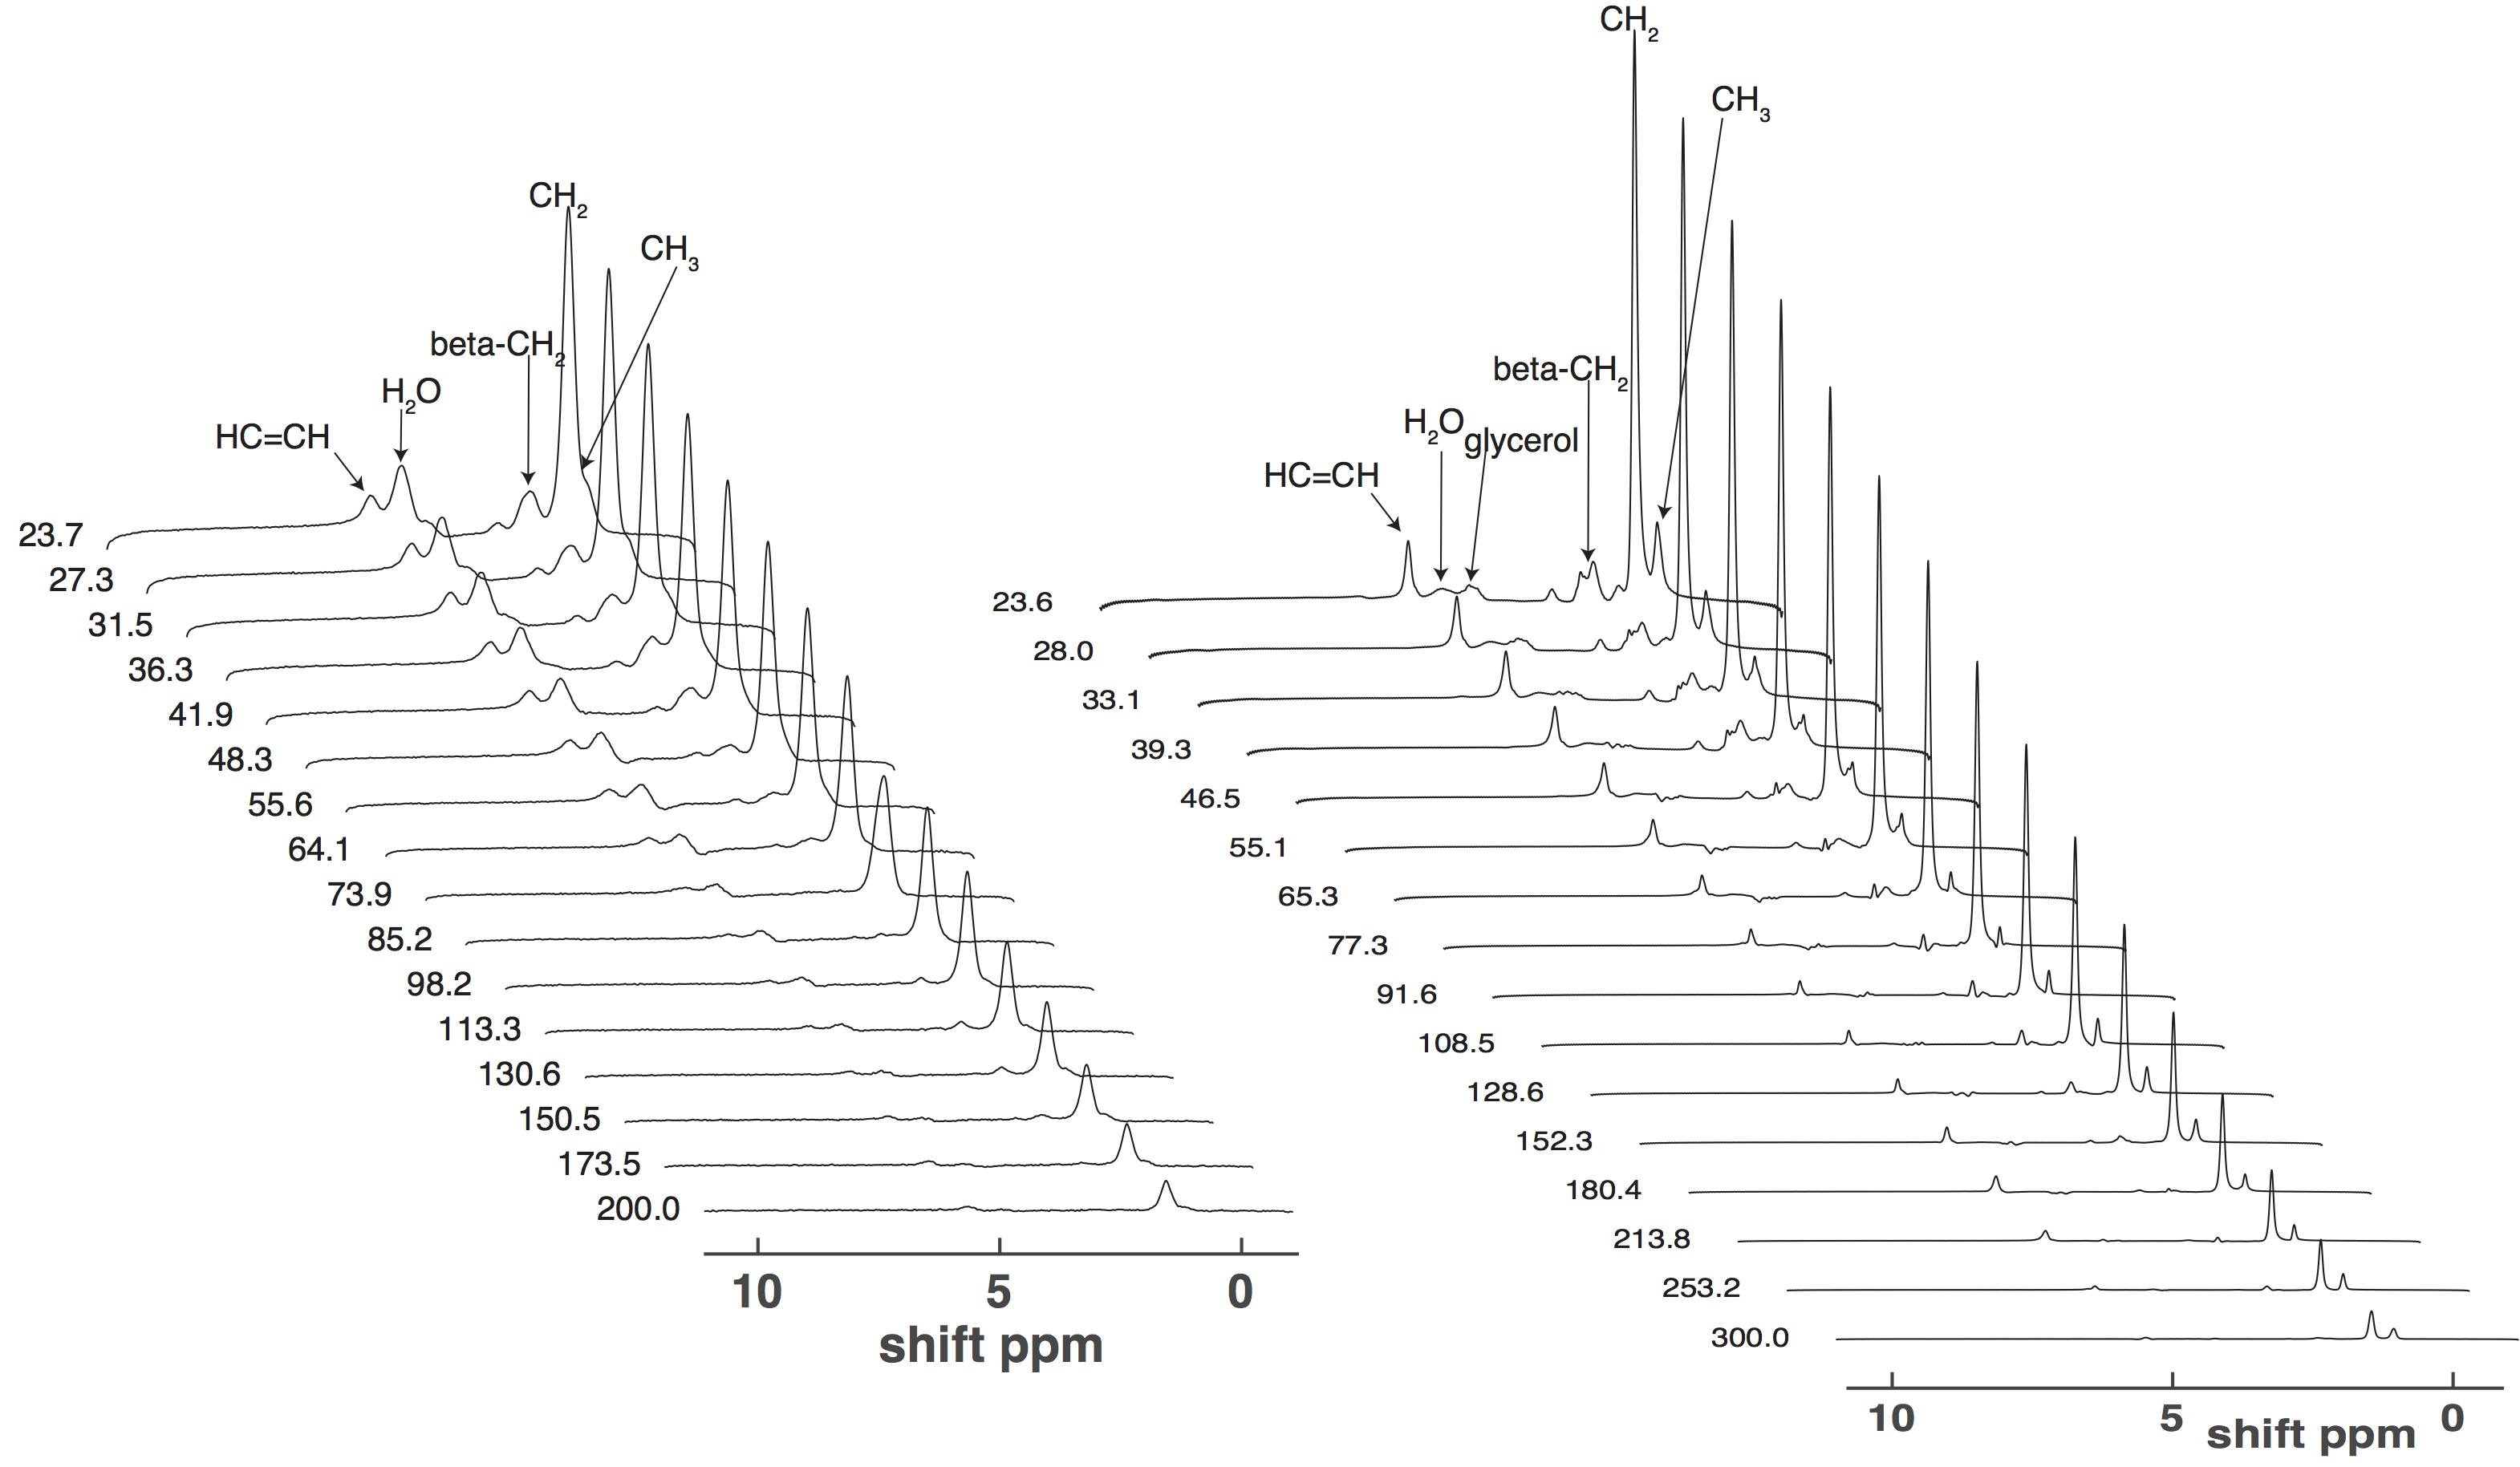
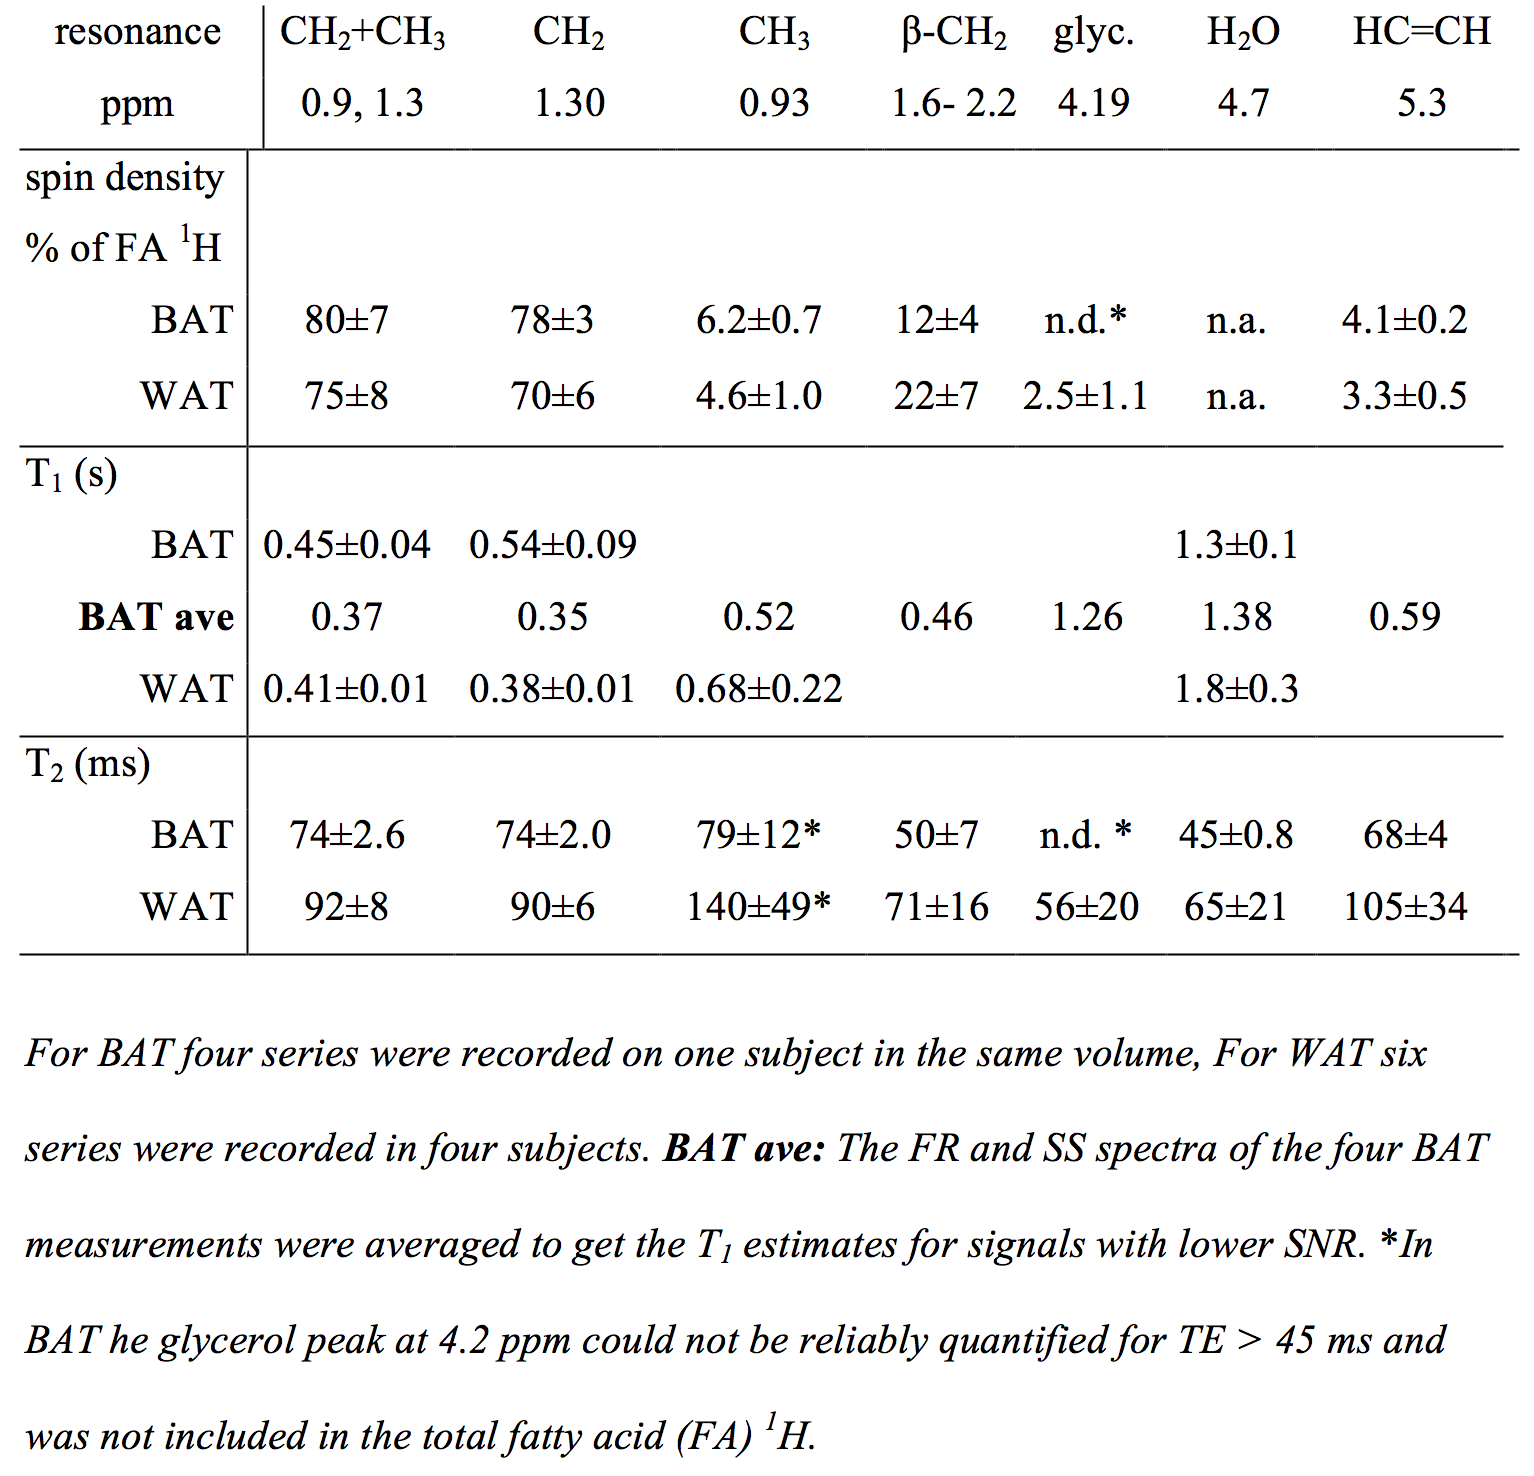
Spin densities and relaxation properties of 1H resonances in human adipose tissues were measured with PRESS1 localized 1H-MRS. For BAT, one male with PET proven high BAT activity in the supraclavicular fat region (see figure 1) the BAT was studied with 1H–MRI and 1H-MRS using a neck coil combined with a flex array surface coil in a Siemens 3T scanner. Saline bags were placed between coil and subject to improve shimming and coil loading. Regions that were active on PET/CT were matched with fat deposits on T2 weighted MR images. High resolution T1 MOLLI2 images were recorded using in-phase GRE readout3 to prevent bias in T1 related to fat content (see figure2). High-res. water-fat images4 were recorded in oblique slices through selected BAT areas. A19x10x8mm MRS volume (offset at -1.7 ppm from water) was selected in the left supraclavicular fat area (see figs. 2 and 3). After B0 field mapping and manual shim correction four series of seventeen spectra were collected. The first fully relaxed (FR) shot in each series was recorded with TE 24ms. Then sixteen spectra were recorded with a logarithmic series of TE from 24 to 200ms (see figure 3A) averaging four shots for each TE at steady state (SS) with TR 0.8s. Spectra were analyzed with AMARES5 time domain fitting in jMRUI. Saturation factors from the FR and shortest TE SS spectra were used to calculate T1s and correct signals before fitting the T2s. The logarithms of signal intensities of lipid signals and water were fitted against TE in linear regression to derive T2 and relaxation corrected spin densities. Proton density fat fractions (PDFF) were calculated from spin densities of water (w) and the summed CH3 and CH2 fat signals (f) as PDFF= f/(w+f) %. In four healthy subjects (age 45±7, range 28-53, one male) the same 1H-MRS TE series were applied (using spine coils) to subcutaneous fat in the posterior torso. The TE range was extended for these studies up to 300 ms and in two subjects an additional series recorded at longer TRs of 1.5 or 2s for which the PDFF and PDFF were corrected with the T1s found with the fast TR series.RESULTS
Water-fat and T1 images of the upper torso and neck failed to show consistent differences in PDFF between subcutaneous WAT and BAT in the same subject probably because the subcutaneous WAT areas were thin. In other subjects with more subcutaneous fat the water content of subcutaneous WAT from imaging is clearly lower. The MRI derived PDFF in WAT was 94±1%(N=4) versus 79±7% from seven ROI within the BAT MRS volume and the contralateral BAT regions. 1H-MRS of BAT confirmed this difference, in six MRS observations of abdominal subcutaneous WAT in four subjects we found PDFF = 92.4±1.7% and the four observations in BAT yielded 67.8 ±1.8%. The much higher water content in BAT is clearly visible in the spectra in figure 3. For BAT and WAT the regression fit of the T2 for lipid CH2 yielded correlations R2=0.995±0.003 (N=4) for BAT and 0.952±0.063 (N=6) for WAT. The T2, T1 and relative spin densities for all spectral components are shown in table 1. Some T1s for small/unresolved resonances in BAT were determined using the averaged spectra from the four FR and four shortest echo SS spectra (BAT ave).DISCUSSION
BAT is often mixed with WAT and only in rare subjects with a large volume of homogeneous BAT can a sufficiently large volume for 1H-MRS be placed. Shimming is a big problem, somewhat reduced by filling spaces with saline bags. 1H-MRS is not a practical method for distinguishing BAT from WAT, but 1H-MRS of BAT can deliver useful information about the relative amplitudes and T2 and T1 relaxation properties of the individual spectral components in BAT. This can be used to develop better water-fat MRI methods that are optimized for BAT and WAT tissues and achieve a more reliable separation of BAT from WAT.CONCLUSIONS
1H-MRS of supraclavicular BAT in humans at 3T is possible with enough spectral quality to yield relaxation properties and relative spin densities of 1H spectral components. This can help the development of MR methods for identifying BAT in humans.Acknowledgements
We would like to thank the NIH and NIDDK for providing the framework and funding for this research and also thank physician assistant Jatin ‘Raj’ Matta, research nurses Suzanne McGehee, Joyce Linderman, post baccalaureates, Courtney Duckworth and Alison Baskin, Marissa Schoepp and PET collaborators William Dieckmann and Corina Millo for their continued efforts and infectious enthusiasm.References
1. Bottomley PA. Spatial localization in NMR spectroscopy in vivo. Ann N Y Acad Sci. 1987;508:333–348.
2. Messroghli DR, Radjenovic A, Kozerke S, et al. Modified look-locker inversion recovery (MOLLI) for high-resolution T1 mapping of the heart. Magn. Reson. Med. 2004;52:141–146.
3. Kellman P, Bandettini WP, Mancini C, et al. Characterization of myocardial T1-mapping bias caused by intramyocardial fat in inversion recovery and saturation recovery techniques. J. Cardiovasc. Magn. Reson. 2015;17:33.
4. Hernando D, Haldar JP, Sutton BP, et al. Joint estimation of water/fat images and field inhomogeneity map. Magn. Reson. Med. 2008;59(3):571–80.
5. Vanhamme L, van den Boogaart A, Van Huffel S. Improved method for accurate and efficient quantification of MRS data with use of prior knowledge. J. Magn. Reson. 1997;129(1):35–43.
Figures