3435
Urine Metabolic profiling of patients with colorectal cancer based on NMR and Pattern Recognition1Radiology Department, Second Affiliated Hospital, Shantou University Medical College, Shantou, People's Republic of China, 2Radiation Oncology, Affiliated Tumor Hospital, Shantou University Medical College, Shantou, People's Republic of China, 3Shantou University Central Laboratory and NMR Unit, Shantou, People's Republic of China, 4Surgery Deparment, Second Affiliated Hospital, Shantou University Medical College, Shantou, People's Republic of China
Synopsis
After our fecal metabonomic study of colorectal cancer (CRC) patients recently published in Oncotarget , we profiled urine metabolites from the same group of CRC patients, 40 age-matched healthy controls (HC), 18 esophageal cancers (EC), using proton nuclear magnetic resonance spectroscopy in conjunction with a multivariate statistics technique. OPLS-DA revealed that each stage of CRC could be clearly distinguished from HC and EC based on their different metabolomic profiles. These altered urine metabolites of CRC patients from HC potentially involved in the disrupted common pathways, and the different metabolites in CRC compare to EC indicated the special of the CRC.
Introduction
Methods
Urine samples were collected from 64 CRC patients (stage I/II: 23; stage III: 19; stage IV: 13; unknow: 9), 40 matched healthy controls (HC),as well as 18 esophageal cancer patients (EC). Samples were extracted with PBS/D2O buffer, and a stock solution of TSP/D20 was added to supernatant prior to analysis by 1H NMR spectroscopy. Spectra of the urine extracts were recorded with a 400MHz Bruker 1D NOESY pulse sequence with the following acquisition parameters: Recycle Delay, RD=1.5s; t1 =3µs; mixing time, tm =100ms; 90o pulse width=7.3us; number of scans, NS=256; number of points, TD=32768; spectral width, SW=8012.82Hz; acquisition time, AQ=2.04s. Water suppression was achieved by irradiation of the water peak during RD and tm. All spectra were preprocessed and then bucketed with the equal width of 0.004ppm. The region of δ4.5~ 5.5 was discarded to eliminate the imperfect water suppression. Each bucket was normalized to the total integral of the spectrum prior to pattern recognition through orthogonal partial least squares-discriminant analysis (OPLS-DA) using the SIMCA-P+14.0 program. Validation of the OPLS-DA model was also performed by means of a permutation test (200 times). The variable importance in the projection (VIP) values of all peaks from OPLS-DA models were taken as a coefficient for peak selection. Mann-Whitney U test and receiver operating characteristic (ROC) analysis in SPSS 20.0 was carried out. Those variables with VIP>1 and p<0.05 were considered as potential biomarker candidates for group discrimination.Result
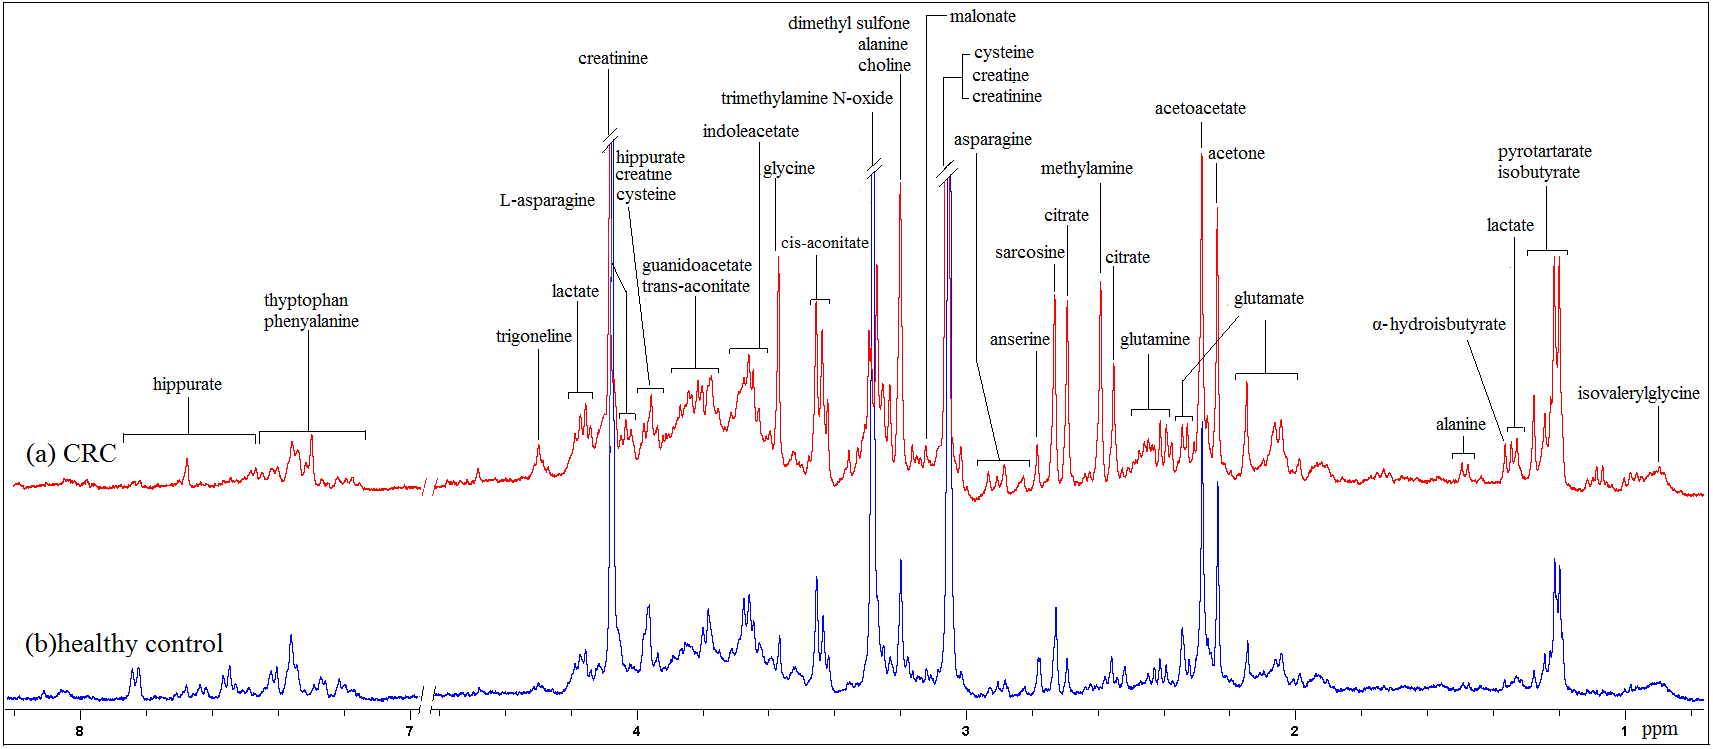
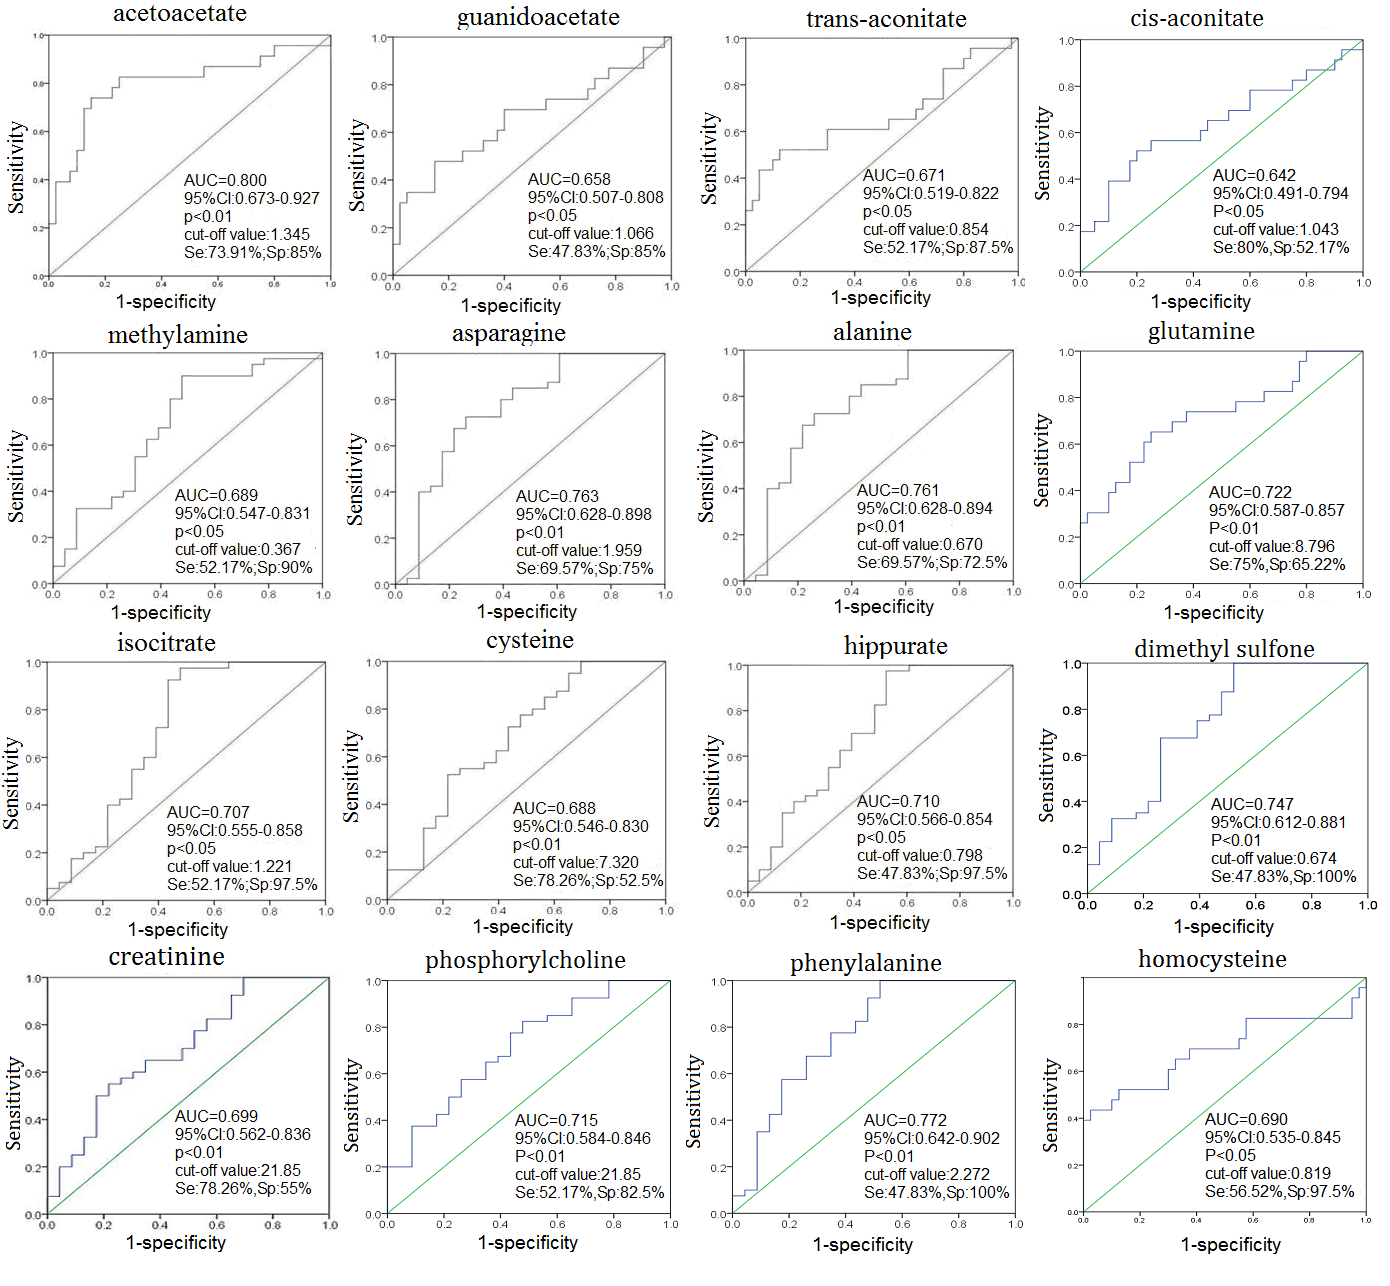
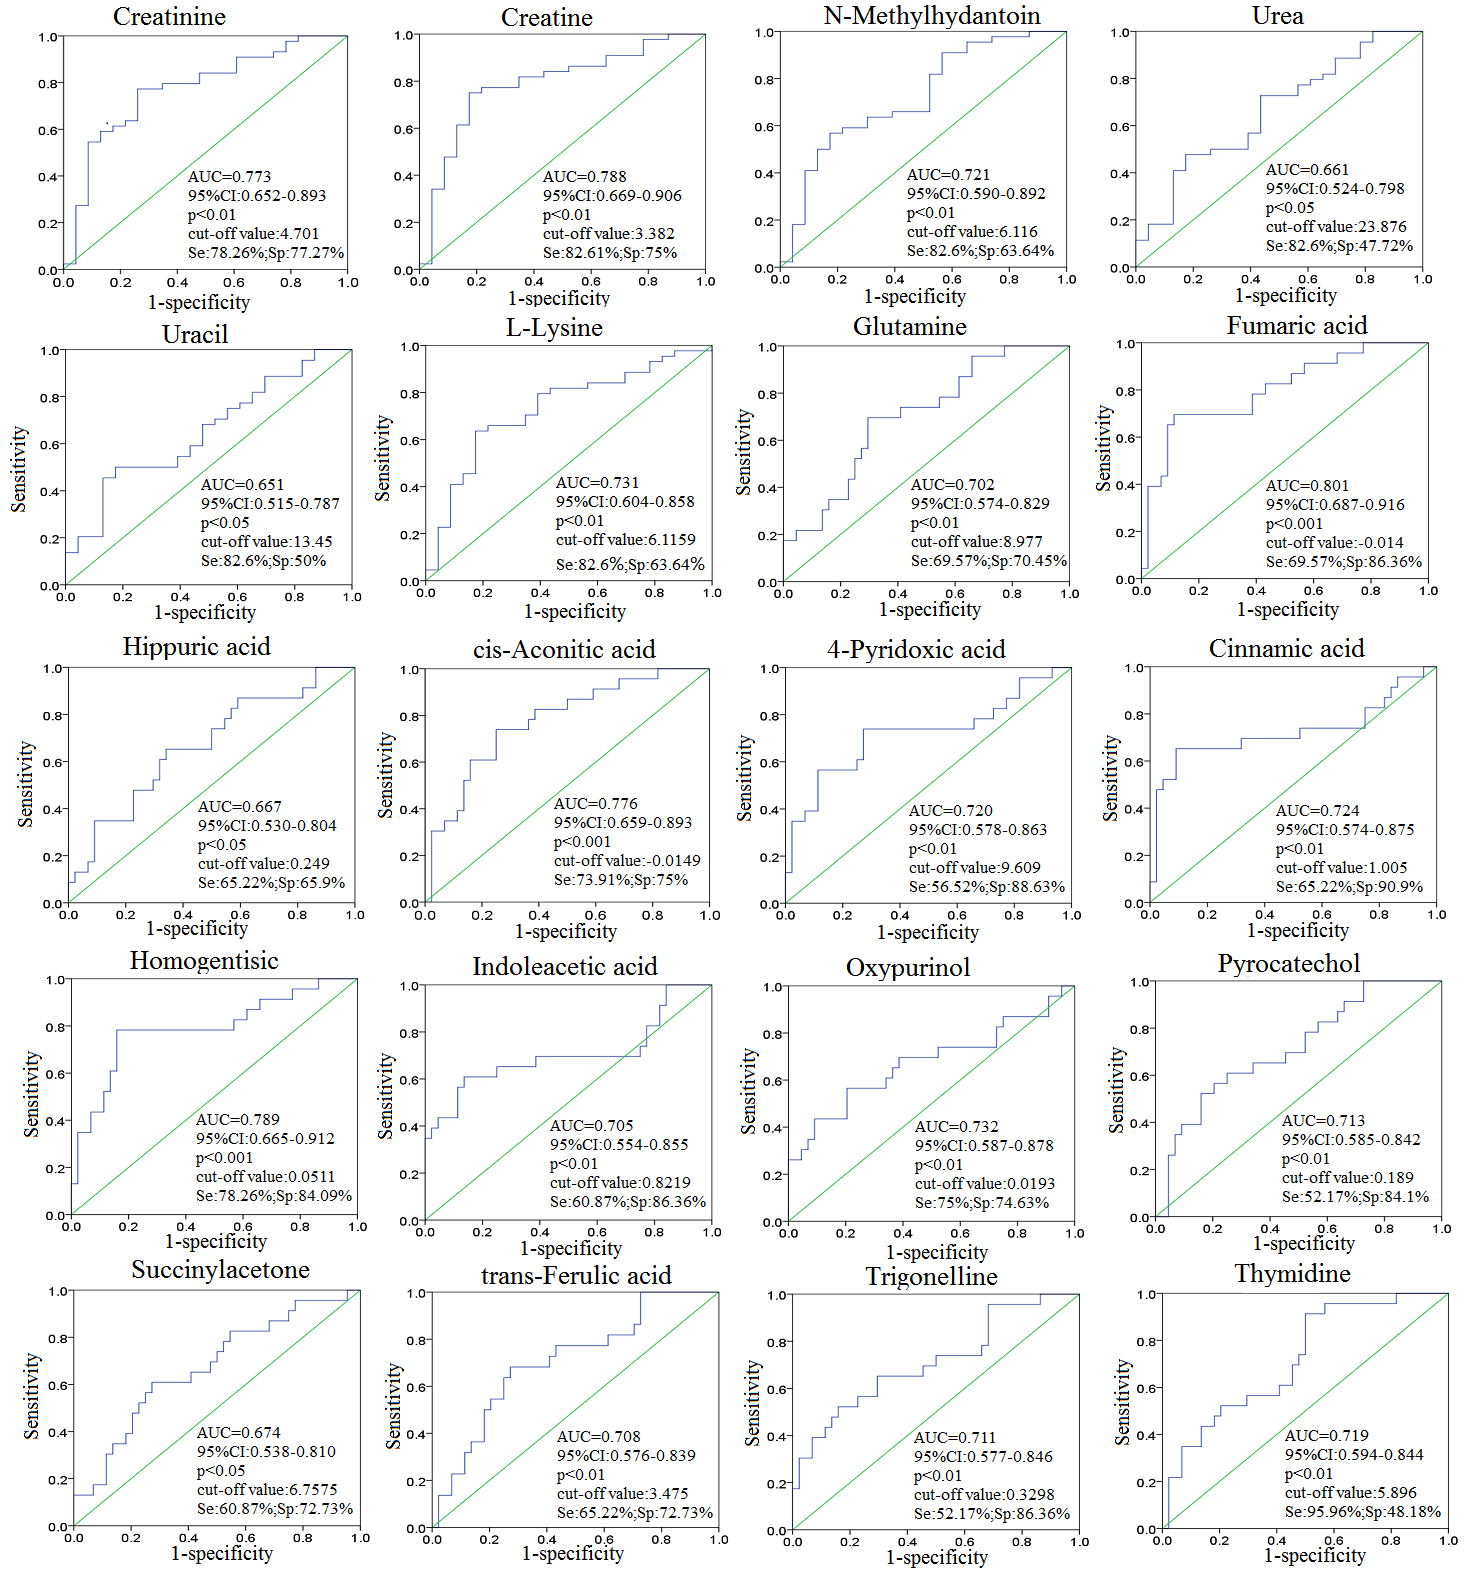
Representative 1D 1H NMR spectra of urine samples obtained from CRC patient and healthy control are shown in Figure 1. The standard one-dimension 1H-NMR spectra gave an overview of all metabolites. The scores plot indicated that different stages of CRC and healthy controls could be clearly separated (Figure 2A). However, the urine metabolic differences between early stage and advanced stage of CRC are less pronounced. Model specificity was confirmed through comparison with esophogeal cancer cohort. The OPLS-DA scores plot showed that the CRC group, EC group and the healthy control group were scattered into different regions, especially between EC samples to the other two groups (Figure 2C). Successive analyses identified distinct disturbances to urine metabolites of CRC patients at early stage (stage I/II), compared with those in cancer free controls, including reduced levels of creatinine, choline, dimethyl sulfone, asparagine, alanine, isocitrate, hippurate, methylamine, cysteine, phenylalanine, and elevated quantities of acetoacetate, glutamine, guanidoacetate, cis-aconitate, trans-aconitate, homocycteine(Figure 3). The metabolite profiles of early stage of CRC and esophageal cancer were also clearly distinguishable obtained the increased metabolites of thymidine, glutamine, fumaric acid, hippuric acid, cis-aconitic acid, 4-pyridoxic acid, cinnamic acid, homogentisic acid, indoleacetic acid, oxypurinol, pyrocatechol, succinylacetone, trans-ferulic acid, trigonelline, and the decreased metabolites of creatinine, creatine, N-methylhydantoin, uracil, urea, lysine in CRC(Figure 4).Conclusion
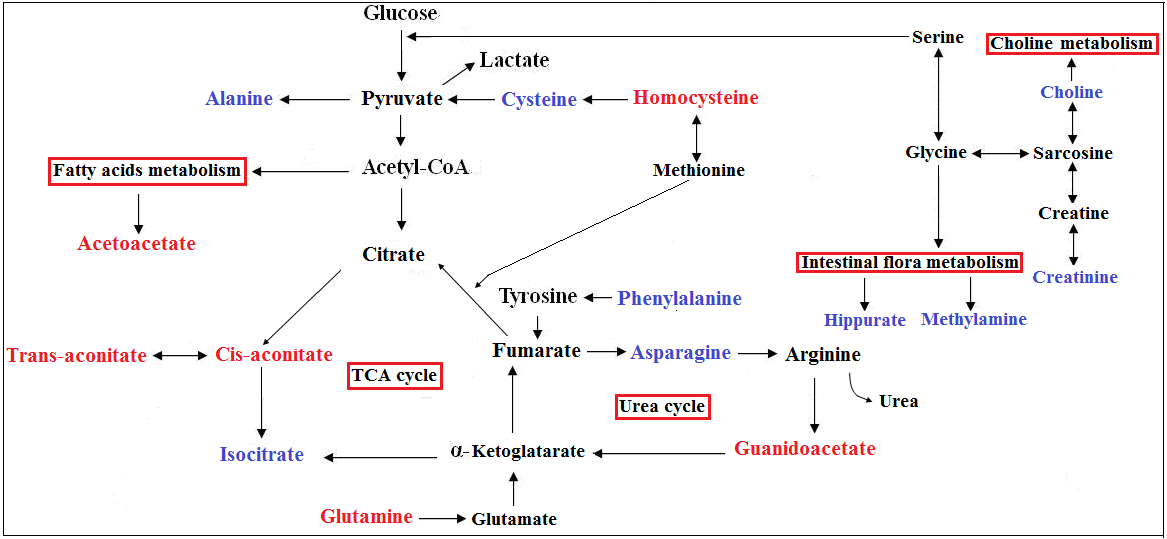
The separated clearly OPLS-DA model among I/II stage of CRC, EC patients and healthy controls indicating that the upper gastrointestinal cancer and the lower digestive cancer have different metabolomic profiles and above-mentioned metabolic perturbations were likely reflective of metabolic alterations specific to CRC. These altered urine metabolites of CRC patients potentially involved in the disrupted common pathways of amino acid metabolism, glycolysis, tricarboxylic acid (TCA) cycle, urea metabolism, choline metabolism and gut microflora metabolism(Figure 5). And the different metabolites in the CRC and EC were relatively to the amino metabolism, gut microflora metabolism and vitamin metabolism. Our findings assessed the important metabonomic variations in urine samples with CRC and, therefore, provided complementary information to fecal and tissue metabonomics for the complete elucidation of CRC underlying metabolic mechanisms.Acknowledgements
National Natural Science Foundation of China (81471729, 81101102), the Science and Technology Planning Project of Guangdong Province ( 2016A020216025), the Research Award Fund for Outstanding Young Teachers in Higher Education Institutions, Guangdong Province (YQ2015245), and the National Natural Science Foundation of Guangdong Province (S2011010004973).References
[1] Torre, L.A., et al., Global cancer statistics, 2012. CA Cancer J Clin, 2015. 65(2): p. 87-108.
[2] Lin, Y., et al., NMR-based fecal metabolomics fingerprinting as predictors of earlier diagnosis in patients with colorectal cancer. Oncotarget, 2016. 16(10).
[3] Y Lin, et al. ISMRM.21 (2015).
[4] Y Lin, et al. ISMRM.22 (2016).
[5] Bouatra, S., et al., The human urine metabolome. PLoS One, 2013. 8(9): p. e73076.
[6] Carrola, J., et al., Metabolic signatures of lung cancer in biofluids: NMR-based metabonomics of urine. J Proteome Res, 2011. 10(1): p. 221-30.
Figures