3434
Characterization of brown and white adipose tissue in 7-year old children1Department of Radiology, Institution of Surgical Sciences, Uppsala University, Uppsala, Sweden, 2Department of Pediatrics, the Institution of Clinical Sciences, The Sahlgrenska Academy, University of Gothenburg, Gothenburg, Sweden, 3Department of Pediatrics, Halland Hospital, Halmstad, Sweden, 4Applied Science Laboratory, GE Healthcare, Uppsala, Sweden, 5Primary Health Care Unit, Department of Public Health and Community Medicine, Institute of Medicine, The Sahlgrenska Academy, University of Gothenburg, Gothenburg, Sweden, 6Department of Pediatric Radiology, The Sahlgrenska University Hospital, Gothenburg, Sweden, 7Antaros Medical, Mölndal, Sweden
Synopsis
The purpose of this study was to characterize and compare brown and white adipose tissue in 7 year-old overweight/obese and normal weight children using whole-body water-fat MRI. Correlations were also performed between the brown adipose tissue measurements and other measurements, such as VAT and SAT volumes. Results overall showed expected differences and associations to several measures relevant for obesity. We conclude that whole-body water-fat MRI of 7 year-old children is feasible and allows characterization of brown and white adipose tissue.
Introduction
Brown adipose tissue (BAT) dissipates chemical energy as heat and might protect against fat accumulation in energy storing white adipose tissue (WAT)1. Water-fat separated MRI can be used for targeting differences in fat fraction (FF) between BAT and WAT, with purpose to distinguish and characterize the two tissues2. In children and adolescents, FF is observed to be lower in supraclavicular adipose tissue (sBAT, with high probability of containing BAT) than in subcutaneous WAT (SAT) and moreover sBAT-FF and SAT-FF are observed to increase with BMI and weight3. The characterization of sBAT and WAT in 7 year-old children is likely an important contribution to metabolic research with long-term objectives including reliable non-invasive assessment of BAT content and function.Purpose
This study aims to characterize and compare sBAT, SAT and visceral adipose tissue (VAT) between 7 year-old overweight/obese and normal weight children. Furthermore, to evaluate the association of sBAT-FF to basic and MRI-derived phenotype data.Methods
Subjects aged 7 years were recruited from a Swedish birth-cohort on healthy children (Halland Health and Growth Study4) in two groups: overweight/obese (OW/OB) and normal weight (NW), matched on birth month and gender. The OW/OB group was defined by overweight or obesity at age 5 years5 (n=27), or waist circumference ≥2SDS at age 12 months (n=2) or 5 years (n=1). The NW group was defined by isoBMI ± 1 SD.
Of 72 children, 53 were included in the study (28 in the OW/OB group) after exclusion due to incomplete or deficient data. The subjects were examined with a whole body 3D fast SPGR 6-echo sequence, using a 3.0T clinical MR system (Discovery 750w, GE Healthcare, Waukesha, WI), producing water, fat and FF images.
MRI was performed in 10 stations of 28 transversal slices each (four stations during breath hold). Scan parameters: TR=6.2ms, TErange=0.9–4.6ms, flip angle=3°, ETL=3, Nshots=2, RBW=±111.11 kHz, FOV=48x28.8cm, matrix=160x128, NEX=0.5, nominal resolution=1.875x1.875x6mm3, total scan time:10–12 minutes. Supine position, no sedation or anesthesia.
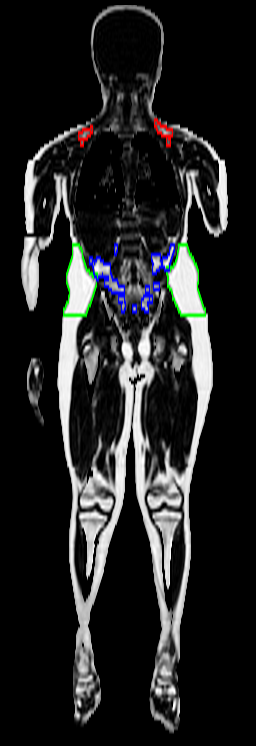
sBAT measurements methodology: Standardized manual delineation was followed by inclusion of voxels with sBAT-FF≥30% (considered as likely BAT) and the resulting volume was measured. Erosion (6-neighborhood structural element) was thereafter performed to decrease partial volume effects. sBAT-FFs was estimated in the eroded volume.
VAT/SAT measurements methodology: Studied volumes were centered on the umbilicus and spanning 126 mm in feet-head direction, containing only voxels with FF≥50%. The body was segmented from the background using thresholding of the summed water-fat images. Threshold level was determined slicewise using Otsu's method6. Arms were automatically removed. VAT and SAT were automatically segmented using in-house developed software. Bones and adipose tissue near the spine belonging to neither depot was manually removed. Minor errors were manually corrected. Erosion was performed similarly to the sBAT analysis before FF measurements.
The OW/OB and NW groups were compared using Mann-Whitney U-test. Associations between sBAT-FFs and remaining parameters were studied using Pearson correlation. p-values < 0.05 were considered statistically significant.
Results
An example of the segmented volumes can be seen in Figure 1.
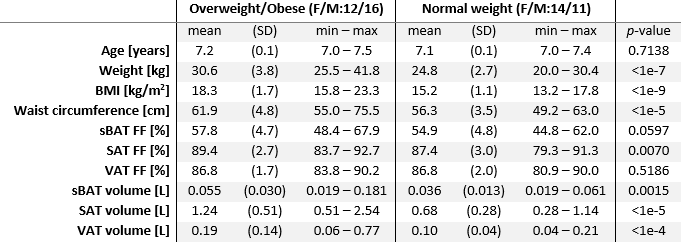
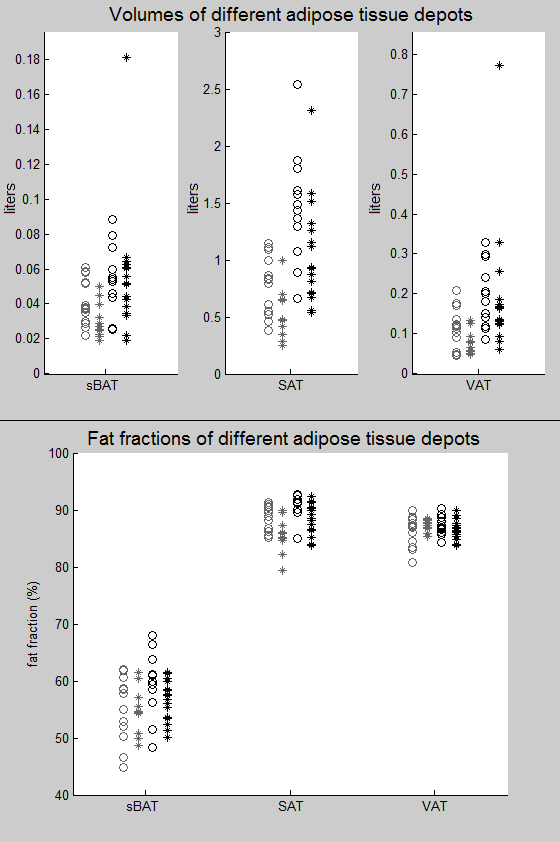
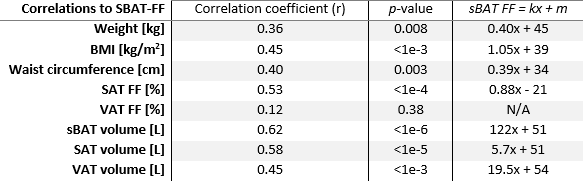
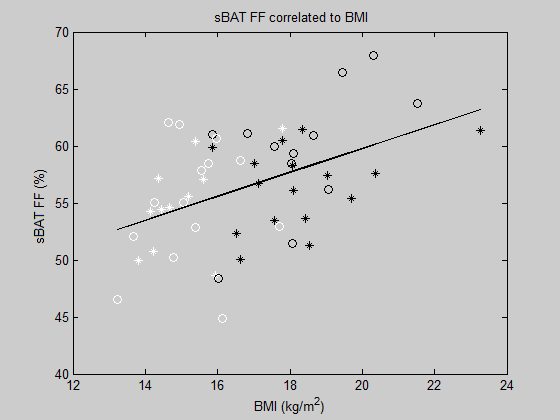
Results from the OW/OB and NW groups and observed inter-group differences are shown in Table 1. Comparison of FF and volume (Figure 2) of sBAT, VAT and SAT between lean and obese subjects resulted in a trend of higher sBAT-FF and significantly higher sBAT-vol in the OW/OB group. SAT-FF, SAT-vol, VAT-vol and waist circumference were higher in the OW/OB subjects than NW subjects but no difference was observed in VAT-FF. Moreover, SAT-FF and SAT-vol were observed to be higher in girls than boys (p<0.01 and p=0.04, respectively) no other gender differences were observed. Correlation between sBAT FF and other parameters are shown in Table 2 (plot of sBAT-FF vs BMI in Figure 3).
Discussion
sBAT-FF was significantly lower compared to WAT-FF in these young children, which indicates presence of functional BAT. The strong relation between sBAT-FF and different fat volumes indicates the importance for compensation of these parameters in studies of BAT using water-fat MRI. This link is probably due to the mixture of brown and white adipocytes in sBAT and the ‘whitening’ of brown adipocytes when inactive7.
The children had BAT FFs higher than what has previously been measured in infants3, but lower than children in the age 9.2-19.0 years old3, and even lower compared to adults2. This is in line with the idea that the BAT gets less ‘brown’ with age.
Conclusions
Whole-body water-fat MRI of 7 year-old children allows characterization of sBAT and WAT that identifies expected differences and associations in a group of normal weight and overweight/obese boys and girls.Acknowledgements
We thank the children and their parents who participated and our research nurses Eivor Kjellberg and Ann-Katrine Karlsson. We also thank Linnéa Bergman for her assistance at the examinations.References
[1] Yoneshiro T, Aita S, Matsushita M, Okamatsu-Ogura Y, Kameya T, Kawai Y, Miyagawa M, Tsujisaki M and Saito M. Age-related decrease in cold-activated brown adipose tissue and accumulation of body fat in healthy humans. Obesity (Silver Spring). 2011;19(9):1755-60
[2] Lundström E, Strand R, Johansson L, Bergsten P, Ahlström H and Kullberg J, Magnetic resonance imaging cooling-reheating protocol indicates decreased fat fraction via lipid consumption in suspected brown adipose tissue. PLoS One. 2015;10(4):e0126705
[3] Hu HH, Yin L, Aggabao PC, Perkins TG, Chia JM and Gilsanz V. Comparison of brown and white adipose tissues in infants and children with chemical-shift-encoded water-fat MRI. J Magn Reson Imaging. 2013;38(4):885–96.
[4] Almquist-Tangen G, Strömberg U, Holmén A, Alm B, Roswall J, Bergman S and Dahlgren J. Influence of neighbourhood purchasing power on breastfeeding at four months of age: a Swedish population-based cohort study. BMC Public Health. 2013;15;13:1077
[5] Cole TJ, Lobstein T. Extended international (IOTF) body mass index cut-offs for thinness, overweight and obesity. Pediatr Obes. 2012;7(4):284-94.
[6] Nobuyuki Otsu (1979). "A threshold selection method from gray-level histograms". IEEE Trans. Sys., Man., Cyber. 9 (1): 62–66. doi:10.1109/TSMC.1979.4310076. Bartelt, Alexander, and Joerg Heeren. "Adipose tissue browning and metabolic health." Nature Reviews Endocrinology 10.1 (2014): 24-36.
Figures