3433
Clinical evaluation of the early renal hypoxia in Type 2 Diabetes based on BOLD-MRI1The 4th center hospital of TianJin, Tianjin, People's Republic of China, 2Inner Mongolia people's hospilal, Inner Mongolia, People's Republic of China, 3Philips Healthcare, Beijing, People's Republic of China
Synopsis
Till now the type 2 diabetes (T2DM)
is more and more prevalent, and diabetic nephropathy (DN) has become the main
leading cause of end-stage renal disease (ESRD). However the onset of DN is
always ambiguous. In recent years, many studies focused on the change of renal
oxygenation in diabetes and showed renal hypoxia especially in medulla. Blood
oxygen level dependent magnetic resonance imaging (BOLD-MRI) is a non-invasive
method that can assess hypoxia in prostate gland by utilizing the endogenous
contrast generated by paramagnetic deoxyhemoglobin.
Target audience
Researchers and clinicians with an interest in functional magnetic resonance imaging of kidney.Purpose
Type 2 diabetes mellitus (T2DM) is a prevalent chronic disease worldwide and diabetic nephropathy (DN) has become the main leading cause of end-stage renal disease (ESRD) [1] . The onset of DN is always ambiguous, and renal function deteriorates progressively in clinical phase. Blood oxygen level dependent magnetic resonance imaging (BOLD-MRI) is a non-invasive method that can assess hypoxia in prostate gland by utilizing the endogenous contrast generated by paramagnetic deoxyhemoglobin [2] . Precious studies showed that R2* quantification using BOLD-MRI is sensitive to oxygenation status in kidney [3] . Our study aimed to evaluate the renal oxygenation in type 2 diabetes, discover the early changes of kidney by using BOLD-MRI and to investigate the relationship between the renal GFR and the R2* values.Methods
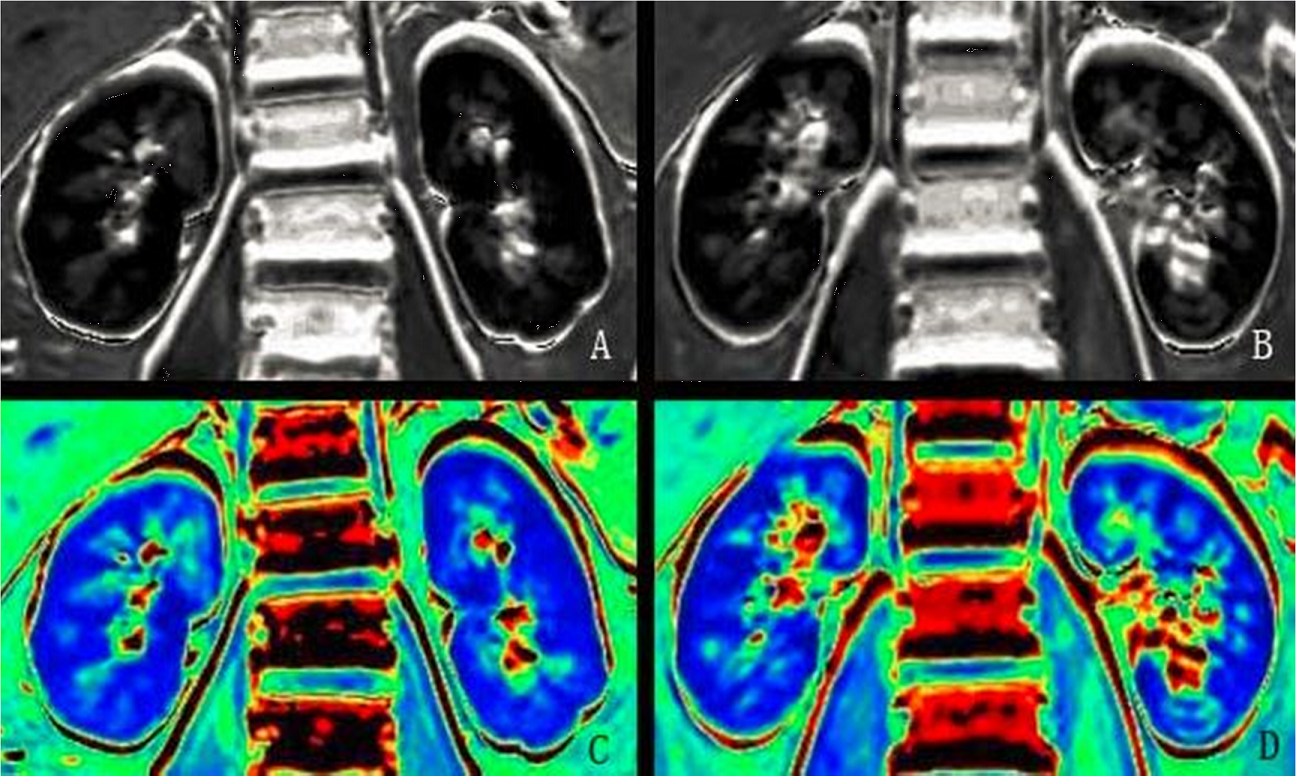
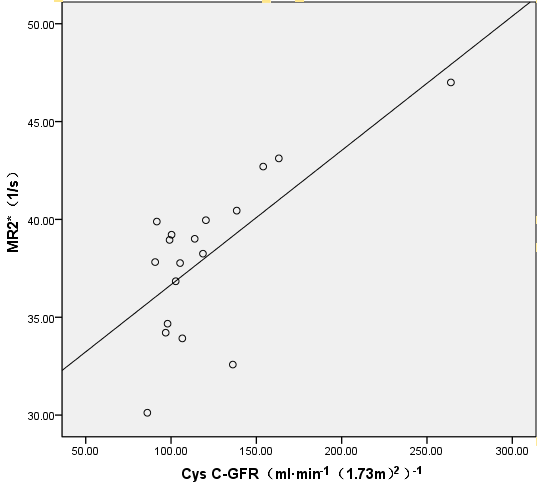
Eighteen patients with type 2 diabetes (mean age 47.5±12.1 years, 8 female and 10 male) and twenty-two healthy controls (mean age 48.4±11.3 years, 10 female and 12 male) with similar age were recruited. The two group subjects successfully passed blood and urine tests including serum cystatin C(Cys C), blood urea nitrogen(BUN), serum creatinine(SCr), complete blood count, urine protein (PRO), microalbumin (mAlb), β2-microglobulin. Prior to MRI scan, all subjects were asked to refrain from food and water for four hours. Kidney BOLD-MRI studies were performed on a 3.0T scanner (Achieva TX; Philips Healthcare, Best, the Netherlands) using multiple T2*-weighted gradient echo sequence. Five slices with 5mm thickness with a gap of 1mm were obtained in the coronal plane as well as following parameters: TR=200ms; TE=2.5-32.6ms, echo time spacing=4.3 ms; flip angle=45°; bandwidth=266Hz/pixel; matrix=320×320; FOV= 30cm. The medullary R2* (MR2*) and cortical R2*(CR2*) values were extracted and quantified on BOLD-MRI, then compared between patients with type 2 diabetes and healthy controls using Student’s t-tests in IBM SPSS Statistics 22.0 (Armonk, New York, USA) and the Pearson correlation analysis was carried out to investigate the relationship between the renal Cys C-GFR computed from Cys C and the R2* values where P <0.05 indicated significant different.Results
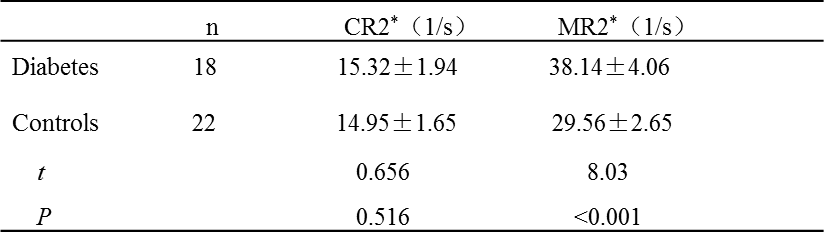
As shown in Table 1, compared with healthy controls, the MR2* values in diabetes were significantly increased while the CR2* values were not significantly different between the two groups. The CR2* values were significantly lower than MR2* values, largely due to the higher concentrations of deoxyhemoglobin in the medulla.
Discussion
Our results showed the R2* value was considerably lower in cortex than that in medulla, which was consistent with previous studies [3] . Compared with healthy controls, the MR2* values in diabetes were significantly increased, it was presumed that the medullary hypoxia was predominantly caused by increased oxygenation consumption in diabetes, which may indicate the early clinical stage of diabetic nephropathy. This is a preliminary study with limited time for recruiting patients, but we will include more patients and volunteers in future for further validation. Conclusion: From our preliminary results, we have found that BOLD-MRI can detect and assess the renal hypoxia in diabetes in an early stage. Hypoxia in medulla was more sensitive than in cortex. And the MR2* values may reflect the renal function alteratioon.Acknowledgements
No acknowledgement found.References
[1] Jones CA, Krolewski AS, Rogus J, et al. Epidemic of end-stage renal disease in people with diabetes in the United States population: do we know the cause? Kidney Int 2005; 67(5):1684-1691.
[2] Chopra S, Foltz WD, Milosevic MF, et al. Comparing oxygen-sensitive MRI (BOLD R2*) with oxygen electrode measurements: a pilot study in men with prostate cancer. Int J Radiat Biol 2009; 85(9):805-813.
[3] Yin WJ, Liu F, Li XM, et al. Noninvasive evaluation of renal oxygenation in diabetic nephropathy by BOLD-MRI. Eur J Radiol. 2012, 81(7):1426-1431.
Figures