3432
Supraclavicular and gluteal adipose tissue PDFF is associated to volumes of VAT and SAT and to anthropometric obesity markers in healthy adults1Department of Diagnostic and Interventional Radiology, Technical University of Munich, Munich, Germany, 2Else Kröner Fresenius Center for Nutritional Medicine, Technical University of Munich, Munich, Germany, 3Philips Research Laboratory, Hamburg, Germany
Synopsis
Proton density fat fraction (PDFF) mapping has been emerging as important metabolic phenotyping parameter in obesity enabling spatially-resolved fat quantification in multiple organs. PDFF of adipose tissue has also recently gained significant attention due to the interest in developing biomarkers of brown fat which is assumed to be present in the adult supraclavicular fossa. However, it remains unknown how adipose tissue PDFF relates to other fat depots and anthropometric parameters. The present study aims to investigate the relationship of the supraclavicular and gluteal fat PDFF with SAT and VAT volumes and anthropometric obesity markers.
Purpose:
The selection of optimal treatment and lifestyle interventions in patients with metabolic diseases is in tremendous need for better risk stratification strategies. MRI-based metabolic phenotyping quantifying different fat depots has been proposed as a methodology to improve risk stratification in obesity and diabetes [1]. MRI has been traditionally used to quantify the subcutaneous adipose tissue (SAT) volume and the visceral adipose tissue (VAT) volume [2]. Proton density fat fraction (PDFF) mapping based on a multi-echo gradient echo acquisition has also recently enabled spatially-resolved fat quantification in multiple organs and liver PDFF has been emerging as an important metabolic phenotyping parameter [3]. In addition, recent reports have suggested that PDFF values in the supraclavicular fossa can be indicative of the presence of brown fat even in adults [4,5]. However, it remains unknown how the PDFF of adipose tissue relates to other fat depots and anthropometric parameters. Therefore, the purpose of the present study was to investigate the relationship of the PDFF of supraclavicular and gluteal fat with SAT and VAT volumes and anthropometric obesity markers.Methods:
Subjects & measurements: For this prospective study, 30 healthy subjects (20 females and 10 males; median BMI 22.7 kg/m2, range 17.4-39.1 kg/m2; median age 29 years, range 22-68 years) were recruited. Subjects underwent an MRI of the neck and the abdomen/ pelvis on a 3T scanner (Ingenia, Philips Healthcare). In order to measure the supraclavicular and gluteal PDFF, a six-echo multi-echo gradient echo sequence with bipolar gradients was used: TR = 12 ms, TE1 = 1.24 ms, ΔTE = 1.0, flip angle = 5°, bandwidth = 1413 Hz/pixel, 268x200x93 acquisition matrix size, FOV = 400x300x140 mm3, 1.5 mm isotropic voxel size, SENSE with R = 2.5. For the abdomen and pelvis, a two-point Dixon sequence with two stacks was used: TR = 4.0 ms, TE1/TE2 = 1.32/2.6 ms, flip angle = 10°, bandwidth = 1004 Hz/pixel, 332x220 acquisition matrix size, FOV = 500x446 mm2, acquisition voxel = 1.5x2.0x5.0 mm3, 44 slices, SENSE with R = 2.5.
Data analysis: PDFF maps were generated using the online complex-based fat quantification algorithm, accounting for known confounding factors including the presence of multiple fat peaks, a single T2* correction and phase errors. In order to determine volumes of SAT and VAT, a custom-built post-processing algorithm was used for automatic classification of the different abdominal tissue compartments based on the water-separated and fat-separated images from the 2-point Dixon scan [6]. VAT and SAT volumes were normalized by height (ml/cm). For segmentation of the supraclavicular and subcutaneous fat, a custom-built MATLAB-algorithm was used, delineating the deep supraclavicular and gluteal subcutaneous fat pockets bilaterally. BMI, waist circumference and waist-to-height-ratio were recorded as anthropomorphic obesity markers.
Results:
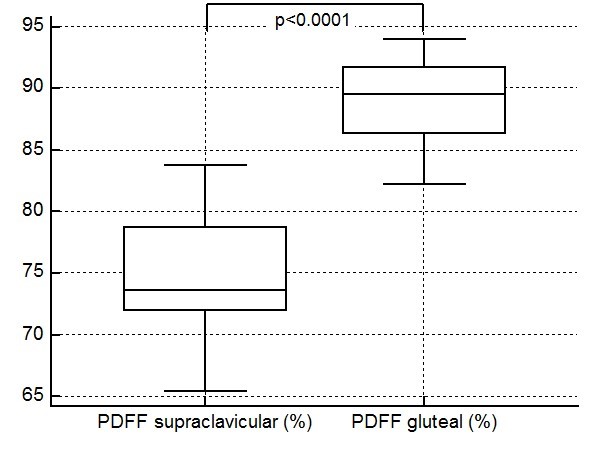
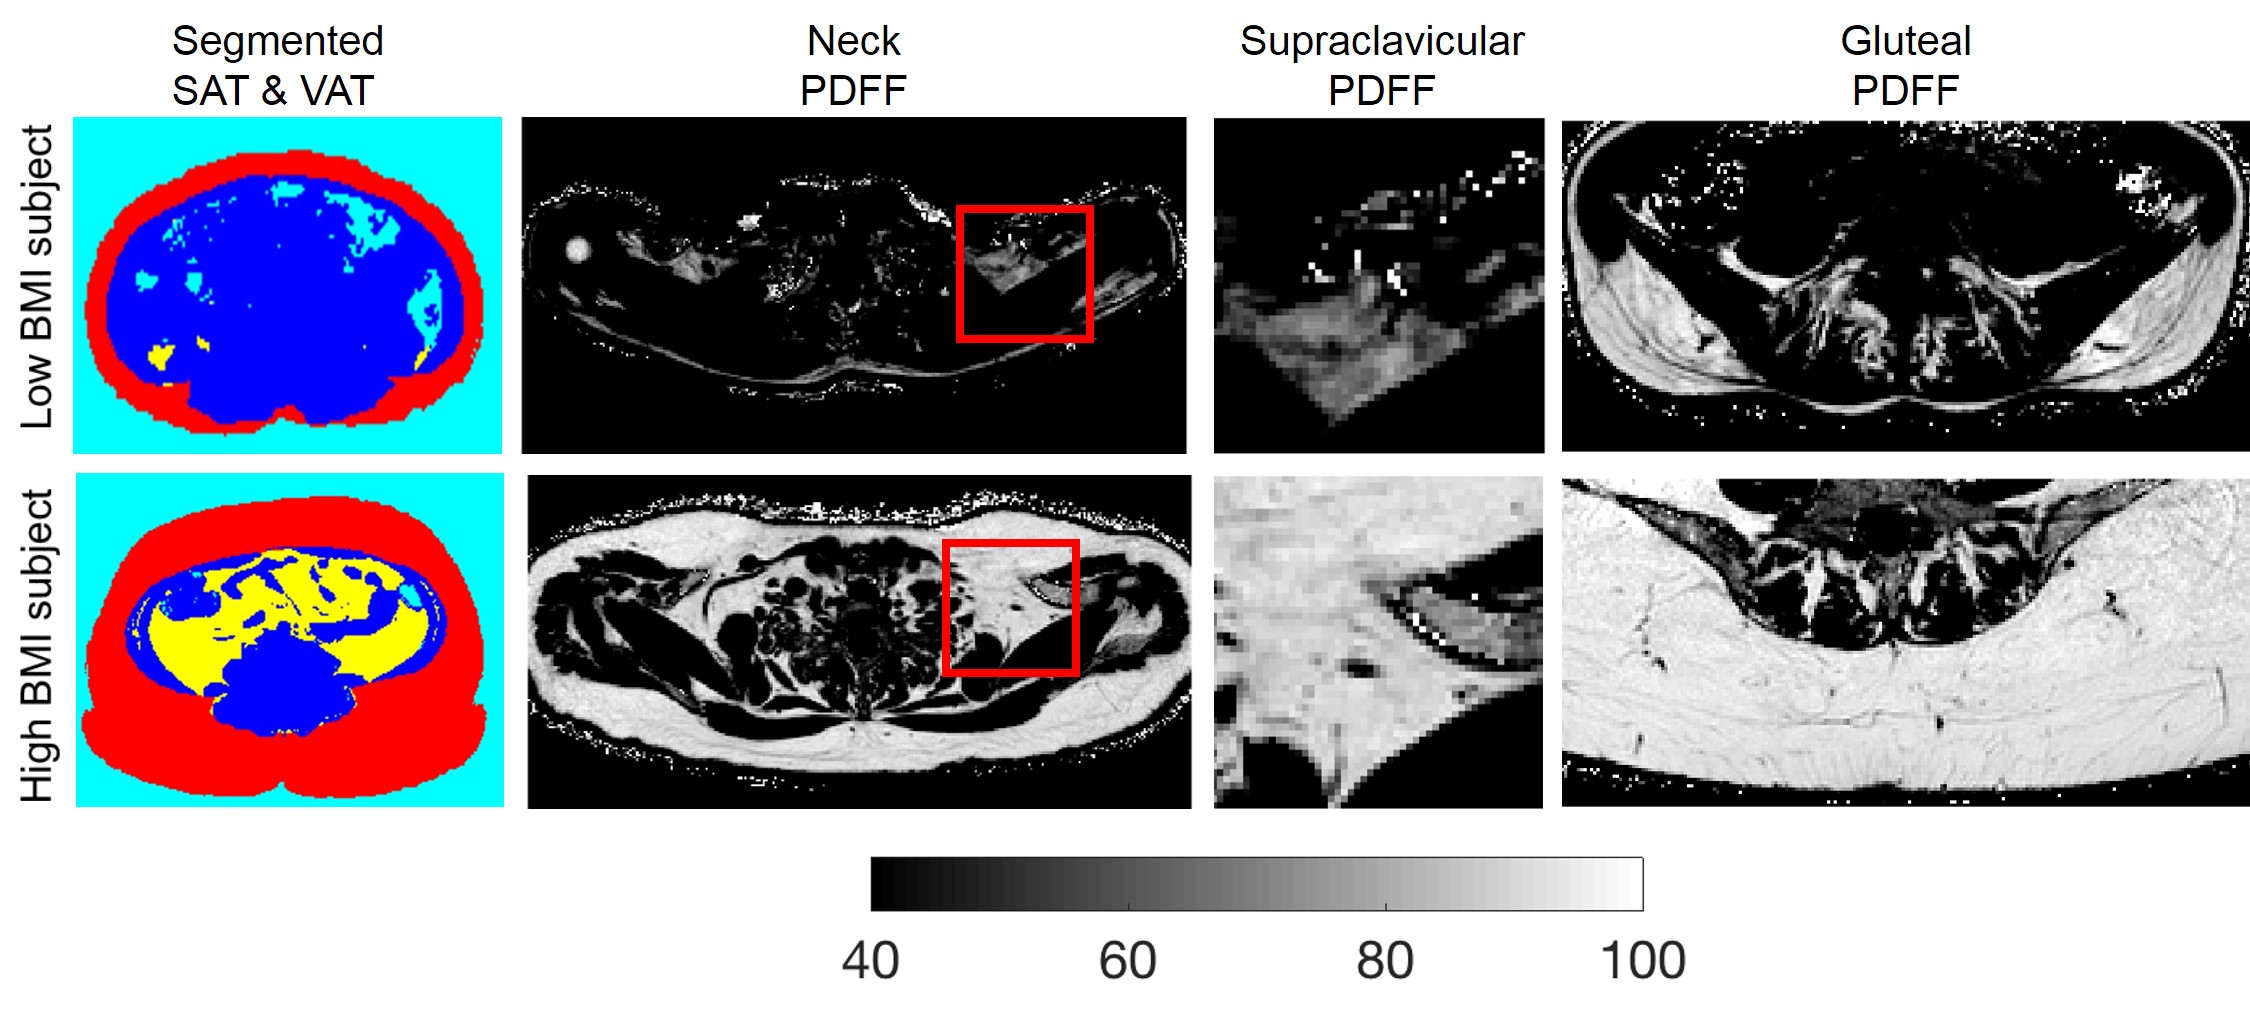
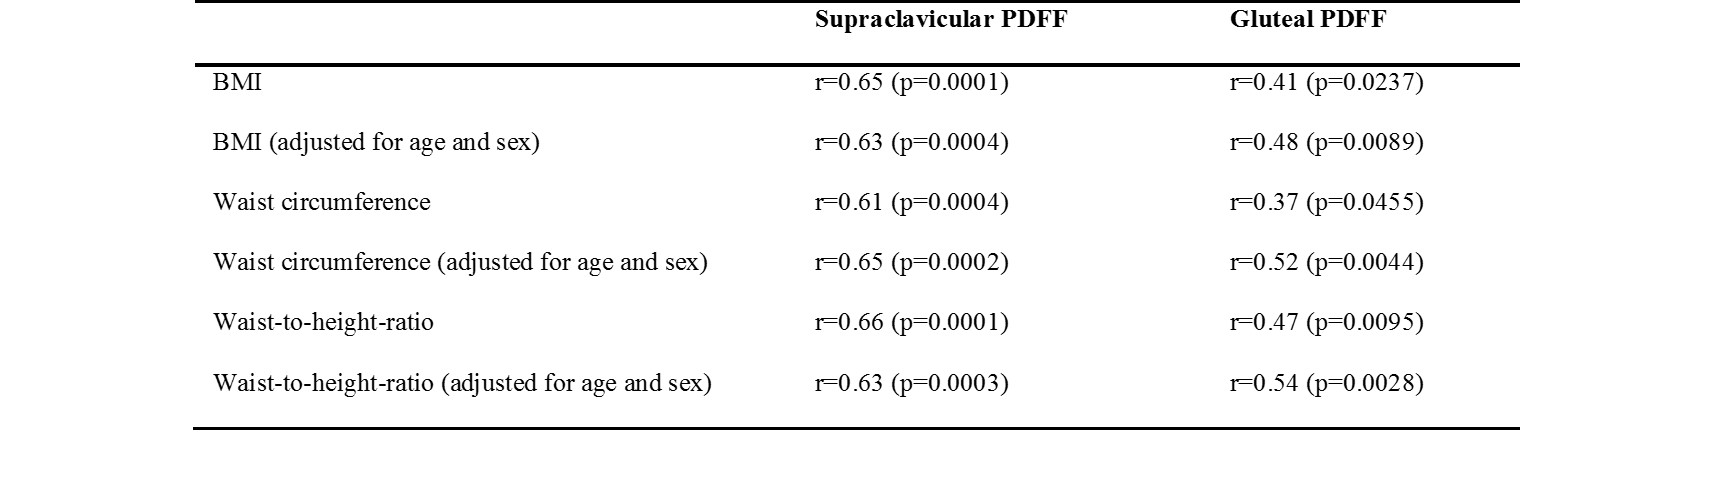
PDFF in the supraclavicular fossa was 74.1% ±4.5 (65.4-83.8) and the PDFF of subcutaneous gluteal fat was 89.1% ±3.2 (82.2-94), resulting in in a highly significant difference in PDFF between the supraclavicular fat and subcutaneous gluteal fat (p < 0.0001) (Fig.1). Fig. 2 shows the SAT/VAT segmented regions and the PDFF maps of supraclavicular and gluteal region in a low and a high BMI subject. The subject with high BMI has higher SAT/VAT volume, and higher supraclavicular and gluteal PDFF than the low BMI subject. PDFF in supraclavicular as well as gluteal fat was positively associated with VAT volume (r=0.67, p=0.0001; r=0.56, p=0.0013 respectively) and SAT volume (r=0.64, p=0.0001; r=0.53, p=0.0024, respectively). Correlations with anthropometric obesity markers are listed in Table 1.Discussion & Conclusion:
The present study shows a highly significant difference between the PDFF in different fat regions, pointing towards brown fat being present in the supraclavicular adipose tissue in adults. Furthermore, PDFF of the analyzed adipose tissue depots is correlated to both MR-based and anthropometric markers of obesity. The correlation of supraclavicular PDFF with obesity markers is consistent with the assumed relationship between brown fat and obesity. To the best of our knowledge the correlation of the gluteal PDFF with SAT and VAT volumes has never been reported before. The above association is also consistent with previous findings relating CT-based SAT attenuation to obesity markers [7]. Therefore, the presents findings suggest that adipose tissue PDFF can not only identify the presence of brown fat in the supraclavicular adipose tissue, but might also serve as new biomarker in subcutaneous adipose tissue for improving the characterization of the obese phenotype, risk stratification and selection of appropriate treatment and lifestyle interventions options in clinical routine.Acknowledgements
The present work was supported by the European Research Council (grant agreement No 677661, ProFatMRI) and Philips Healthcare.References
[1] Thomas, Obesity 20:76, 2012
[2] Machann, Radiology 257:353, 2010
[3] Hu, NMR Biomed 26:1609, 2013
[4] Fransssens, NMR Biomed 29:48, 2016
[5] Franz, J Nucl Med 56:1742, 2015
[6] Cordes, J Magn Reson Imaging 42:1272, 2015
[7] Rosenquist, J. Am. Coll. Cardiol 6:762, 2013
Figures