3431
Anti-FGFR1/KLB treatment reduces hepatic fat fraction in a murine model of NAFLD1Biomedical Imaging, Genentech, Inc., South San Francisco, CA, United States, 2Molecular Biology, Genentech, Inc., South San Francisco, CA, United States, 3Research Pathology, Genentech, Inc., South San Francisco, CA, United States
Synopsis
Anti-FGFR1/KLB is a novel experimental therapy to treat metabolic disorders and reverse lipid accumulation in the liver. MRI estimates of proton density fat fraction demonstrated a dose-dependent anti-FGFR1/KLB treatment effect in a murine model of NAFLD.
Introduction and Purpose
Anti-FGFR1/KLB is a novel experimental therapy to treat metabolic disorders and reverse lipid accumulation in the liver (1). As anti-FGFR1/KLB moves into the clinic, proton density fat fraction (PDFF) MRI provides a non-invasive measure to assess hepatic lipid content in the clinic. The goal of this study is to confirm that PDFF can detect an anti-FGFR1/KLB treatment effect in a murine model of NAFLD. This will provide support to use PDFF as an imaging biomarker for anti-FGFR1/KLB clinical development.Methods
Animal model
Male C57BL/6 mice were placed on a high-fat diet (HFD) at the age of 6 weeks. Treatment was initiated after 19 weeks of HFD. Animals were given IP injection of either 3mg/kg anti-FGFR1/KLB, 20mg/kg anti-FGFR1/KLB, or 20mg/kg isotype control antibody at week 19 and week 21; a fourth group of age-matched mice were kept on normal chow throughout and no antibody treatment (n=8/group). HFD animals were randomized into treatment groups based on pre-treatment PDFF estimates of hepatic fat fraction.
MRI
All experiments were done on a Varian/Agilent 9.4T (Agilent Technologies, Santa Clara, CA) preclinical MRI system equipped with a 6cm ID gradient coil with a maximum gradient of 100G/cm, and a 40mm millipede volume RF coil (ExtendMR, Milpitas, CA). Fat fraction measurements employed a multi-echo gradient-echo sequence with TE = 1.07, 2.14, 3.21, 4.28, 5.35, and 6.42ms; TR = 200ms; flip angle 20°; matrix size 64x64 (zero-filled to 128x128); and 64 averages for a total scan time of approximately 14 minutes. The FOV was 40x40mm2, with 8 1mm thick slices. Before fat fraction calculations, the reconstructed images were filtered using the Adaptive Restoration Filter available in Analyze 11.0 (AnalyzeDirect, Overland Park, KS) with a 3x3x1 kernel. Data was fitted according to a 6-echo model (2) to yield the water and fat components using in-house software, and the fat fraction calculated. ROIs were drawn manually in Analyze 11.0 on the first gradient echo image and then transferred to the fat fraction image for fat quantification.
Triglyceride assay
The animals were taken down within 5 days of the MRI session, and the liver removed for ex-vivo determination of the total triglyceride (TGL) content (Cayman Chemical Company, Ann Arbor, MI).
Histology
Harvested livers were fixed in 10% neutral buffered formalin. The right liver lobe was processed, embedded in paraffin, sectioned at 5µm and stained with Hematoxylin and Eosin. Microscopic grading for lipidosis was performed on the right liver lobe at X200. A pathologist determined the % area of tissue which was replaced by lipid. Grades were assigned as follows: 0) <5%, 1) 5-10%, 2) 10-20%, 3) 20-40%, 4) 40-60%, and 5) >60%.
Data analysis
Results are expressed as mean ± SEM. All statistical analysis was performed in JMP (SAS Institute, Cary, NC) using a significance level of 5%. A Tukey-Kramer group-wise comparison was done at baseline to verify that there was no initial difference between the HFD groups. To test changes in fat fraction, a t-test was performed on delta values between each of the post-dosing and the pre-dosing fat fraction. Correlations between fat fraction and TGL or lipidosis were assessed by linear regression.
Results
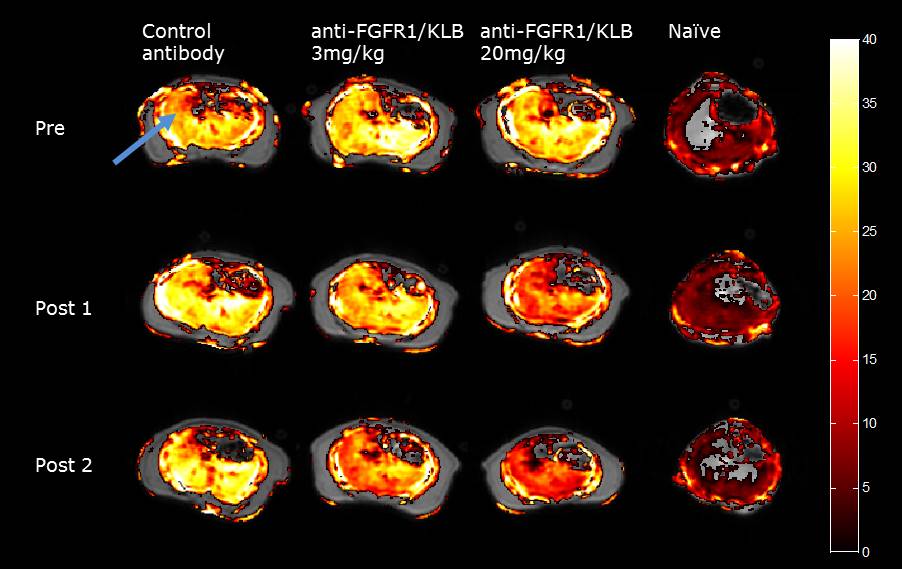
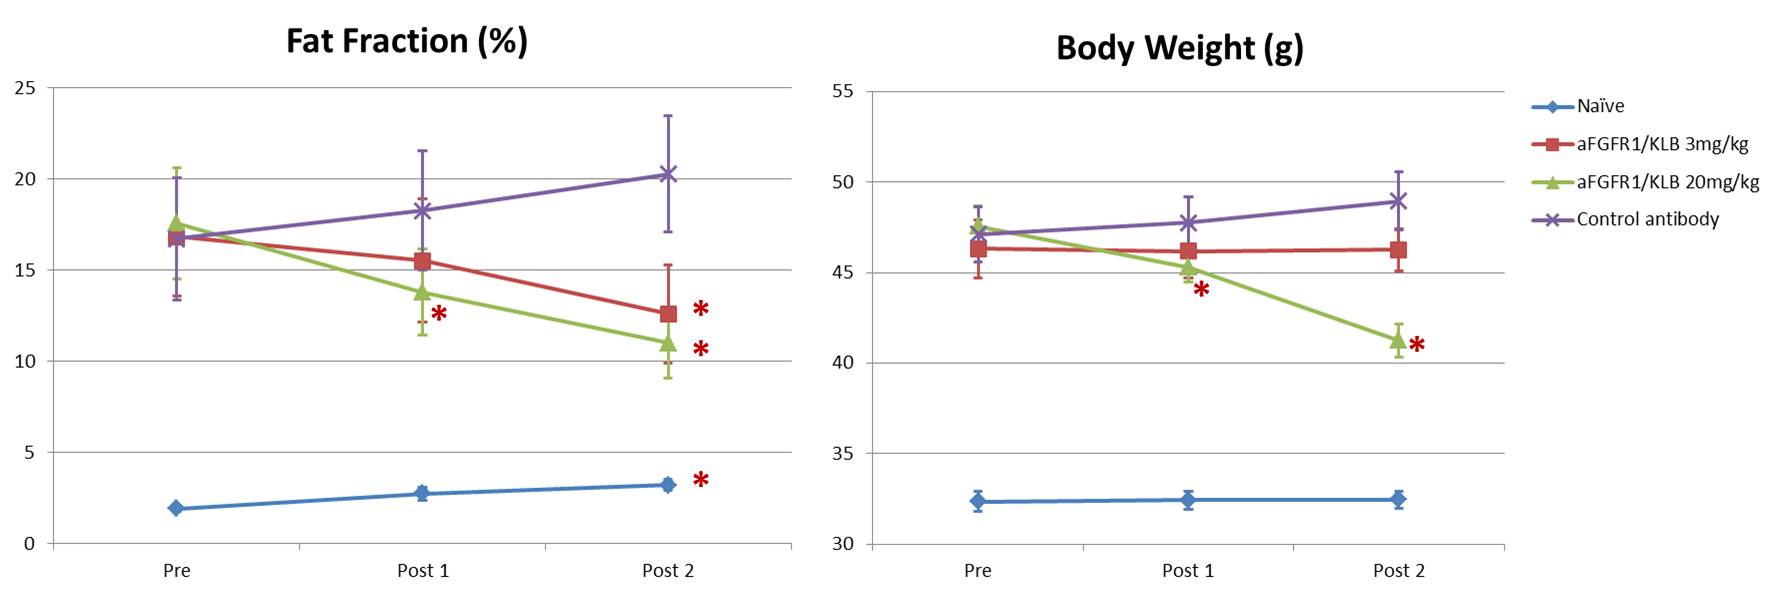
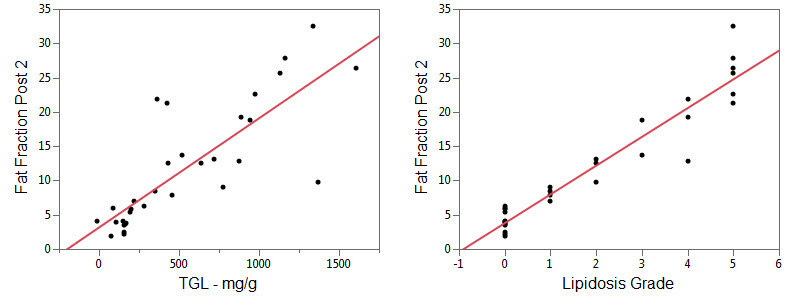
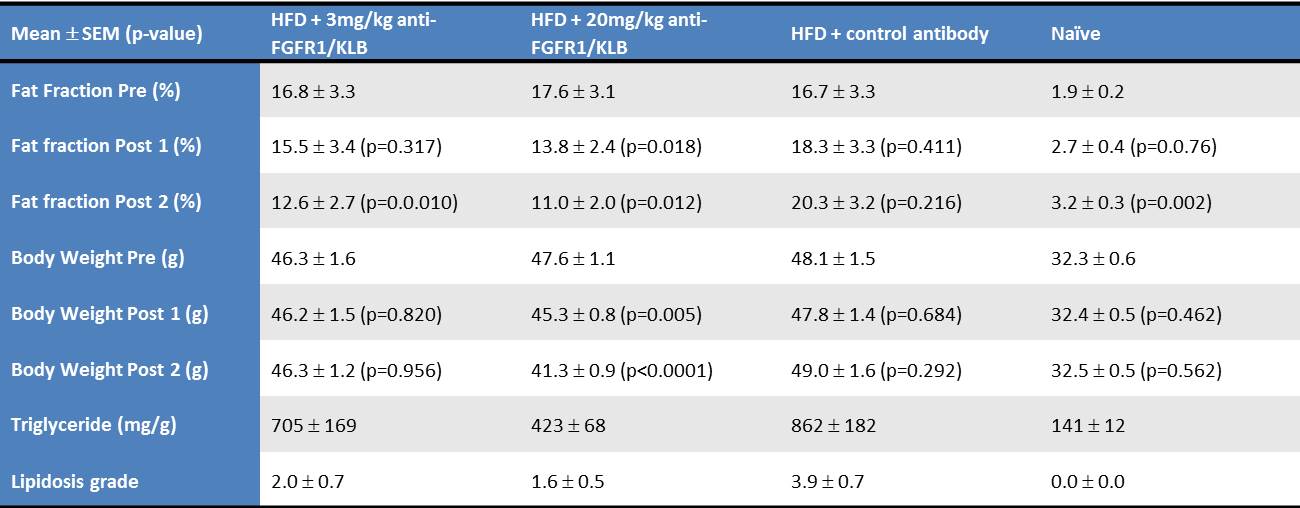
All results are summarized in Table 1. Representative PDFF maps from each treatment group (anti-FGFR1/KLB or control) are shown in Figure 1. There were no significant differences between the mean fat fraction in the 3 HFD groups prior to treatment (Tukey-Kramer, p > 0.99), but the mean fat fraction were all higher than in the naïve group (p < 0.005). The hepatic fat fraction was reduced by treatment with anti-FGFR1/KLB but not control, but only the high dose of anti-FGFR1/KLB resulted in a reduction in body weight, Table 1, Figure 2. The final hepatic fat fraction (PDFF) is well correlated with both triglyceride levels and lipidosis grade, Figure 3.Discussion and Conclusion
This study demonstrated that a pre-clinical PDFF method can detect an anti-FGFR1/KLB treatment effect in a murine model of NAFLD, thus establishing the utility of PDFF as an imaging biomarker for anti-FGFR1/KLB clinical development. There appeared to be a dose-dependent response to the anti-FGFR1/KLB treatment. Interestingly, the significant reduction in hepatic fat fraction in the low dose group was not mirrored by a reduction in body weight in the same group, suggesting that anti-FGFR1/KLB reduces hepatic fat before adipose fat.Acknowledgements
No acknowledgement found.References
1. Kolumam et al. Sustained Brown Fat Stimulation and Insulin Sensitization by a Humanized Bispecific Antibody Agonist for Fibroblast Growth Factor Receptor 1/βKlotho Complex. EBioMedicine 2015, 730-743.
2. Mashhood et al. Reproducibility of Hepatic Fat Fraction Measurement by Magnetic Resonance Imaging, JMRI 2013, 37, 1359-1370.
Figures