3429
Determination of Droplet Size Distribution in Brown Adipose Tissues by Diffusion NMR Spectroscopy1Laboratory of Molecular Imaging, Singapore Bioimaging Consortium, Singapore, Singapore, 2Singapore Institute for Clinical Sciences, Singapore
Synopsis
Non-Invasive Imaging of Brown Adipose Tissue is of significant interest due to its potential to combat obesity and diabetes. In this study, we have utilized diffusion spectroscopy to estimate the droplet size distribution in chow and high-fat diet fed brown adipose tissues obtained from rodents. The high-fat diet BAT exhibited
Purpose
To determine the droplet size distribution in brown adipose tissues by diffusion NMR spectroscopy in control and high-fat diet fed tissues obtained from rodents.Introduction
White adipose tissue (WAT) and brown adipose tissue (BAT) are two types of fat, which essentially perform opposite functions in whole body energy metabolism. WAT is distributed with large unilocular lipid droplets whereas BAT is heterogeneous with multilocular lipid droplets1. Dynamic remodeling of lipid droplets occurs during BAT activation. High-fat diets result in excessive accumulation of lipid droplets and have been associated with metabolic dysfunction leading to obesity and diabetes. The white adipocytes are larger in size and can be evaluated directly from histology whereas it is a challenge to determine the droplet size in BAT. High-fat diet results in excessive accumulation and expansion of lipid droplets resulting in metabolic dysfunction2. Diffusion spectroscopy permits evaluation of restricted behavior, and droplet size estimation by modelling the restriction3, 4, 5. In this study, we have evaluated the droplet size distribution in control and high-fat diet BAT.Materials and Methods
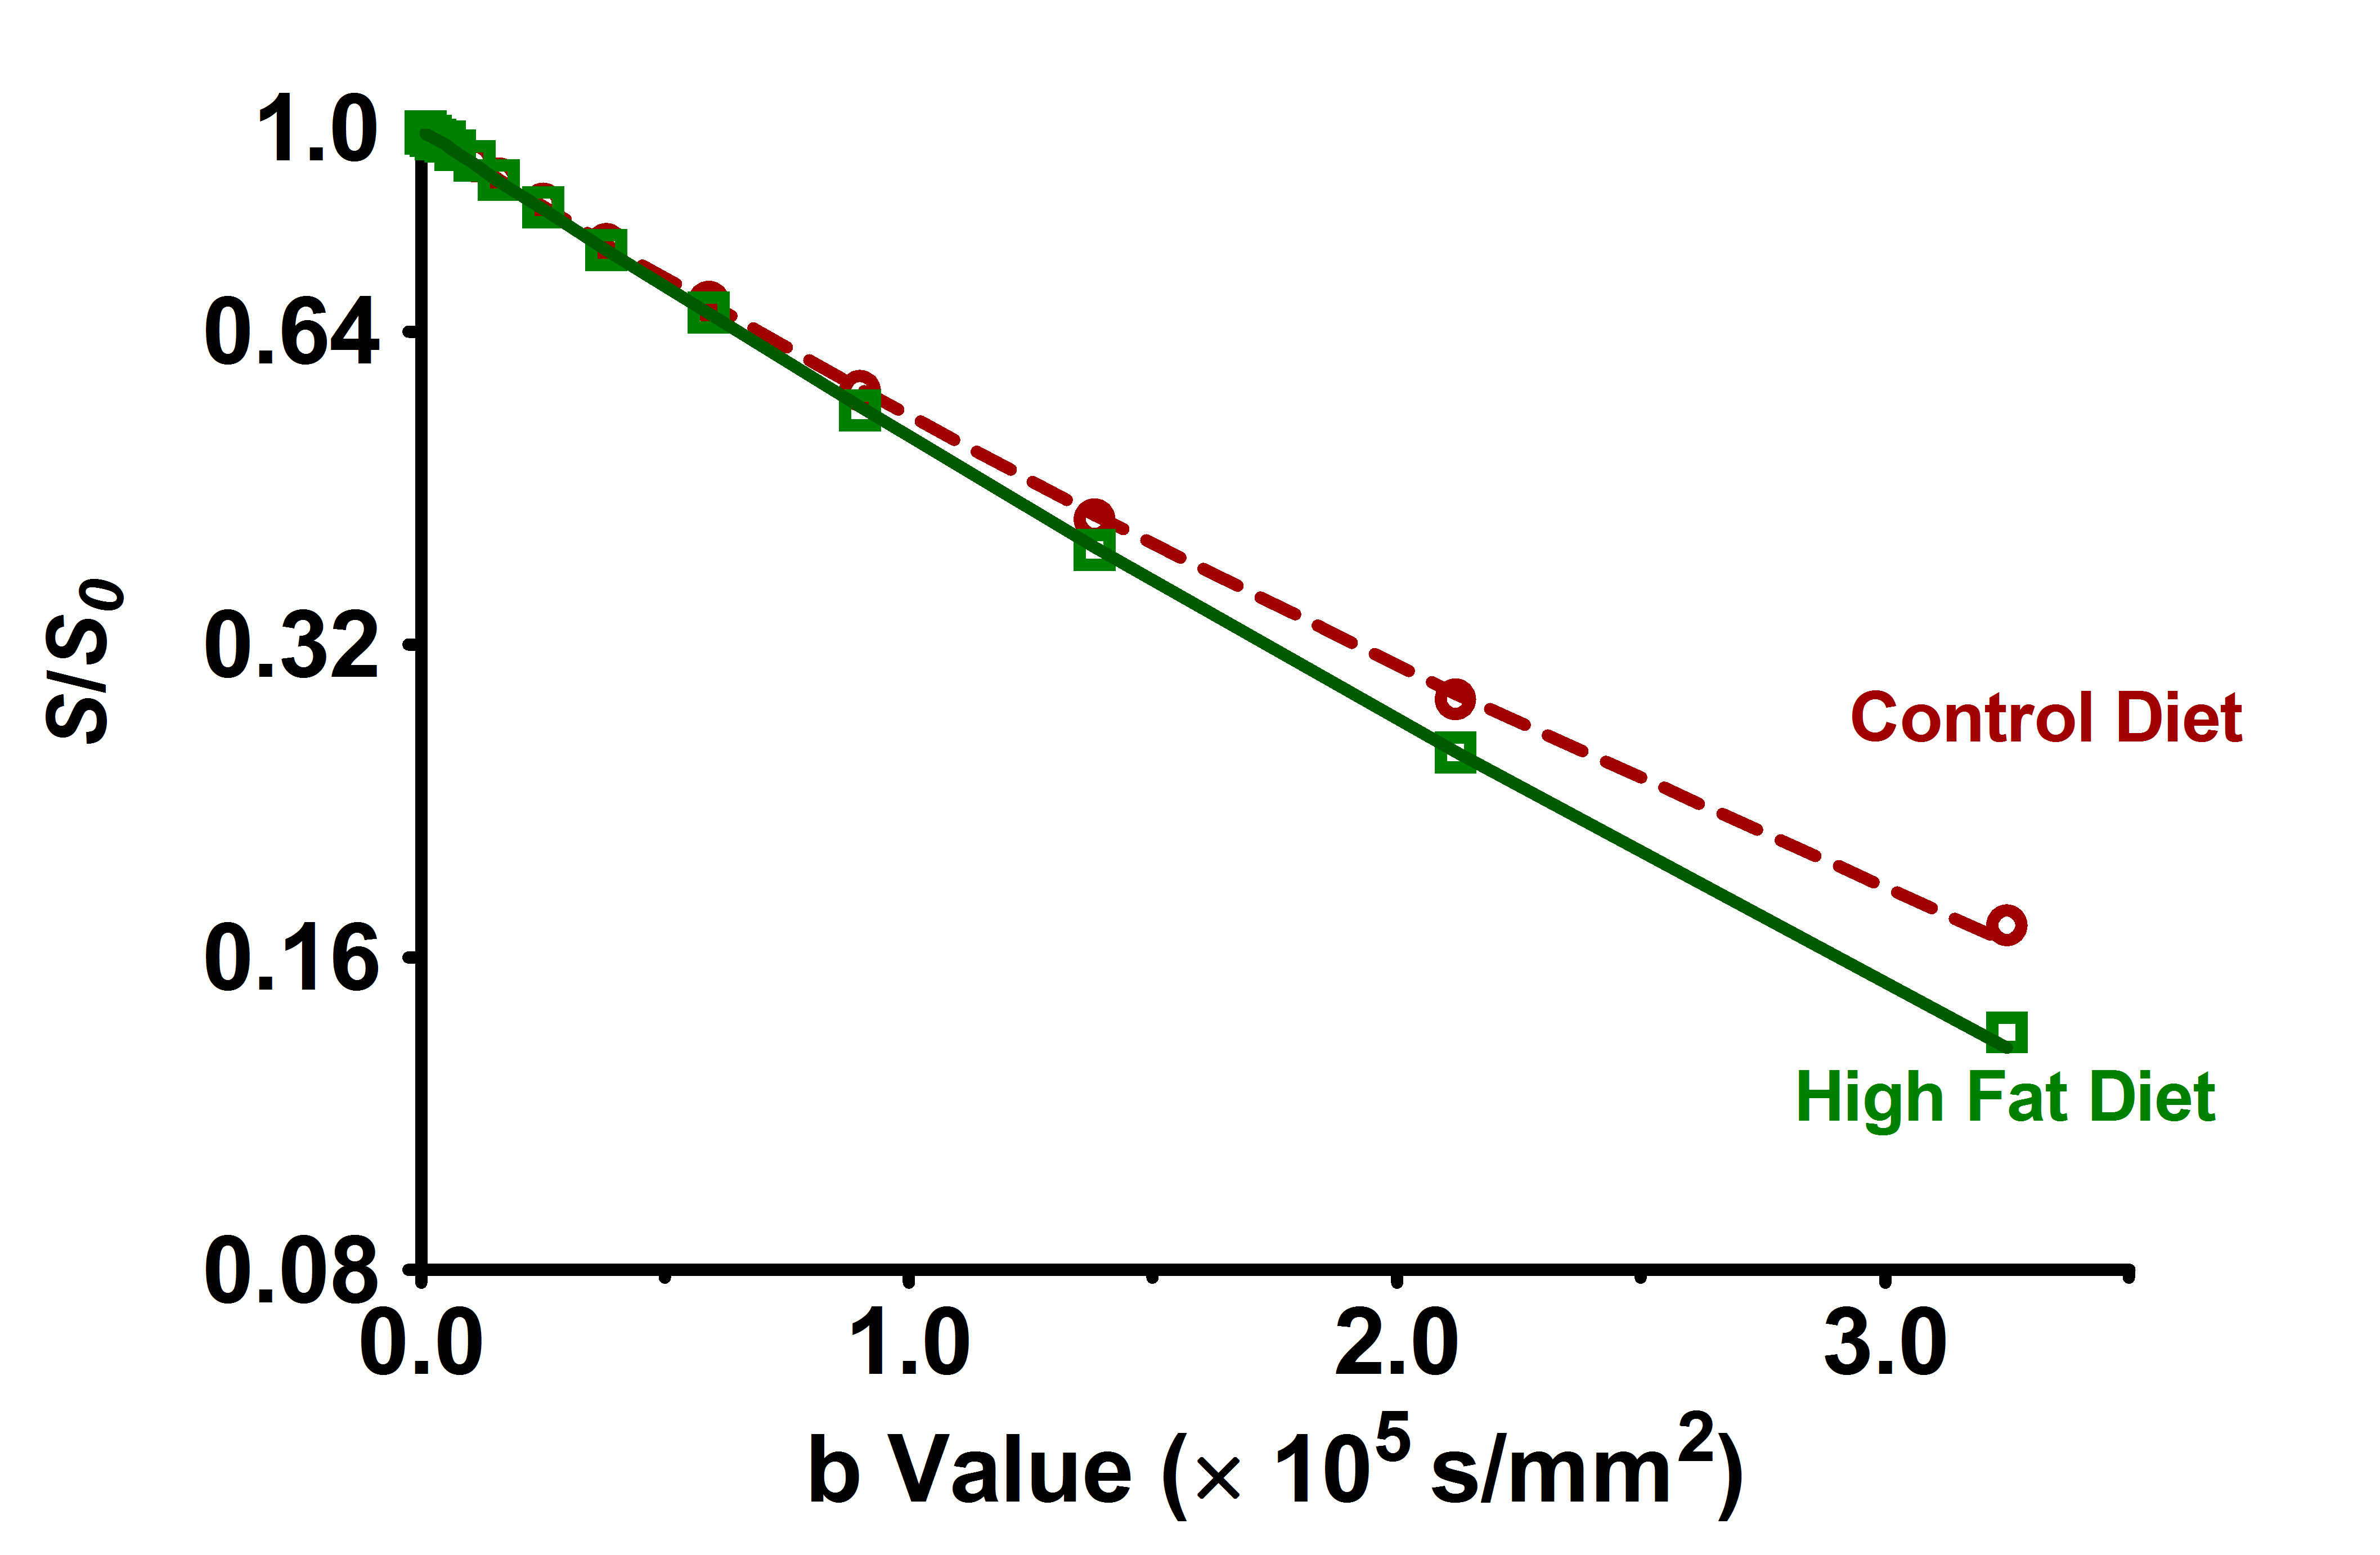
All animal protocols were approved by the local institutional committee. Twelve male Wister rats at seven weeks of age were randomized into control and high-fat diet. Tissue samples (150–200 mg) were obtained at 15 weeks of age from the interscapular BAT. Samples were placed between susceptibility-matching plugs in a NMR tube and experiments were performed with an AVANCE III 9.4T NMR spectrometer using a 5-mm indirect detection broadband probehead with an actively shielded z-gradient coil. The diffusion experiments were performed with varying diffusion times (Δ = 0.25, 0.5, 1 and 2 s) with gradient pulse duration (δ = 10 ms), and gradient switching interval (τ = 0.5 ms). The spectral area under the most prominent fat peak at ~1.3 ppm was integrated and fitted to Stejskal–Tanner equation $$S = S_{0}e^{-\gamma^{2}g^{2}\delta^{2}\left(\triangle-\frac{\delta}{2}-\frac{\tau}{3}\right)D}$$ to calculate the apparent diffusion coefficient (ADC). The distribution of lipid droplet size with radius R and diffusion D, can be assessed by modelling the restricted diffusion behavior, as described by Murday and Cotts3 and simplified by Garasanin et al.4 assuming the rapid convergence of the Bessel function:
$$S(R)= S_{0}(R) exp\left[\frac{-54 g^2 R^2 γ^2 \left[3\left\{exp \left(\frac{-13D(∆-δ)}{3R^2}\right)-2 exp\left(\frac{-13Dδ}{3R^2}\right)-2 exp \left(\frac{-13D∆}{3R^2} \right)+exp \left(\frac{-13D\left(∆+δ\right)}{3R^2} \right)+2\right\} R^2-26Dδ\right]}{15379D^2}\right]$$
The observed NMR signal is the volume weighted average and described by the log normal probability distribution function P(r) expressed as:
$$ S_{0bs} = \frac{\int_{}^{}S(r)r^{3} P(r)dr} {\int_{}^{}r^{3} P(r)dr}=\frac{\sum_{R_{min}}^{R_{max}}S(r)r^{3}P(r)}{\sum_{R_{min}}^{R_{max}}r^{3}P(r)}$$
where the denominator is a normalization constant, and Rmin and Rmax are the minimum and maximum droplet radii, respectively. We assume here that almost all of the fat molecules within a droplet in BAT hit the boundary during 2 s at least once. The NMR signal attenuation at diffusion time Δ = 2 s was fitted to above equation with a nonlinear least squares fit to obtain the mean radius and variance of the distribution.
Results & Discussion
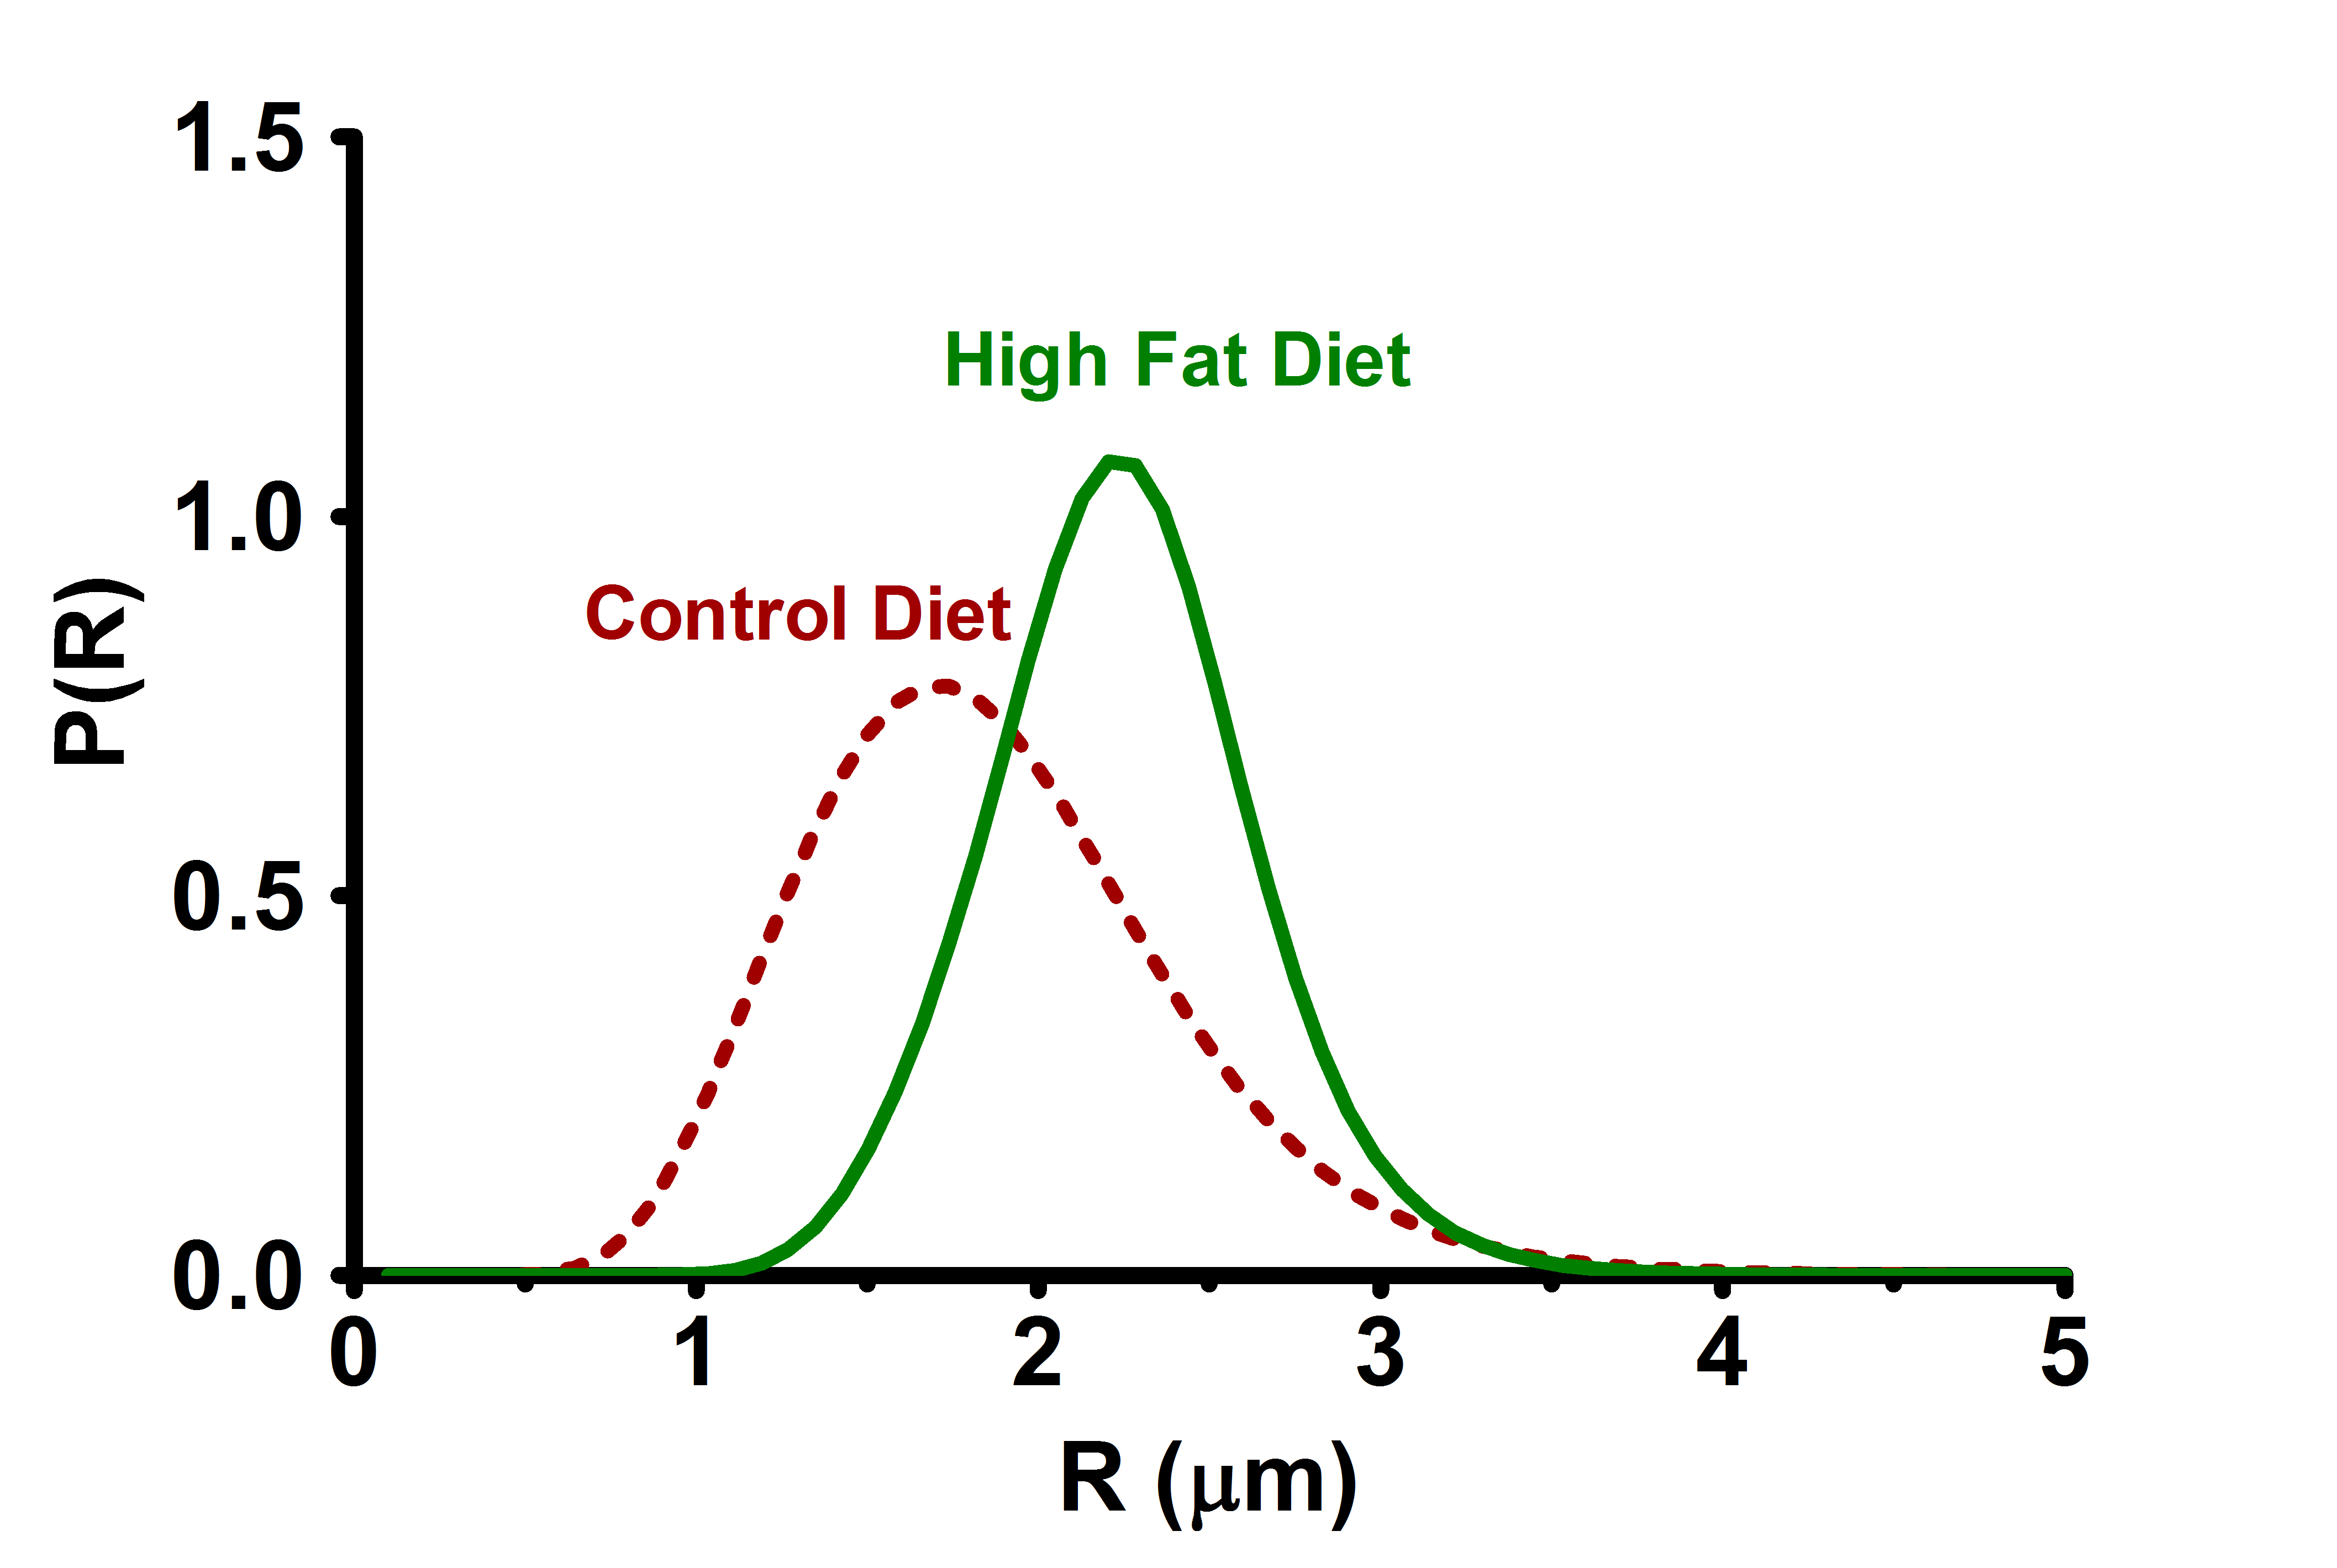
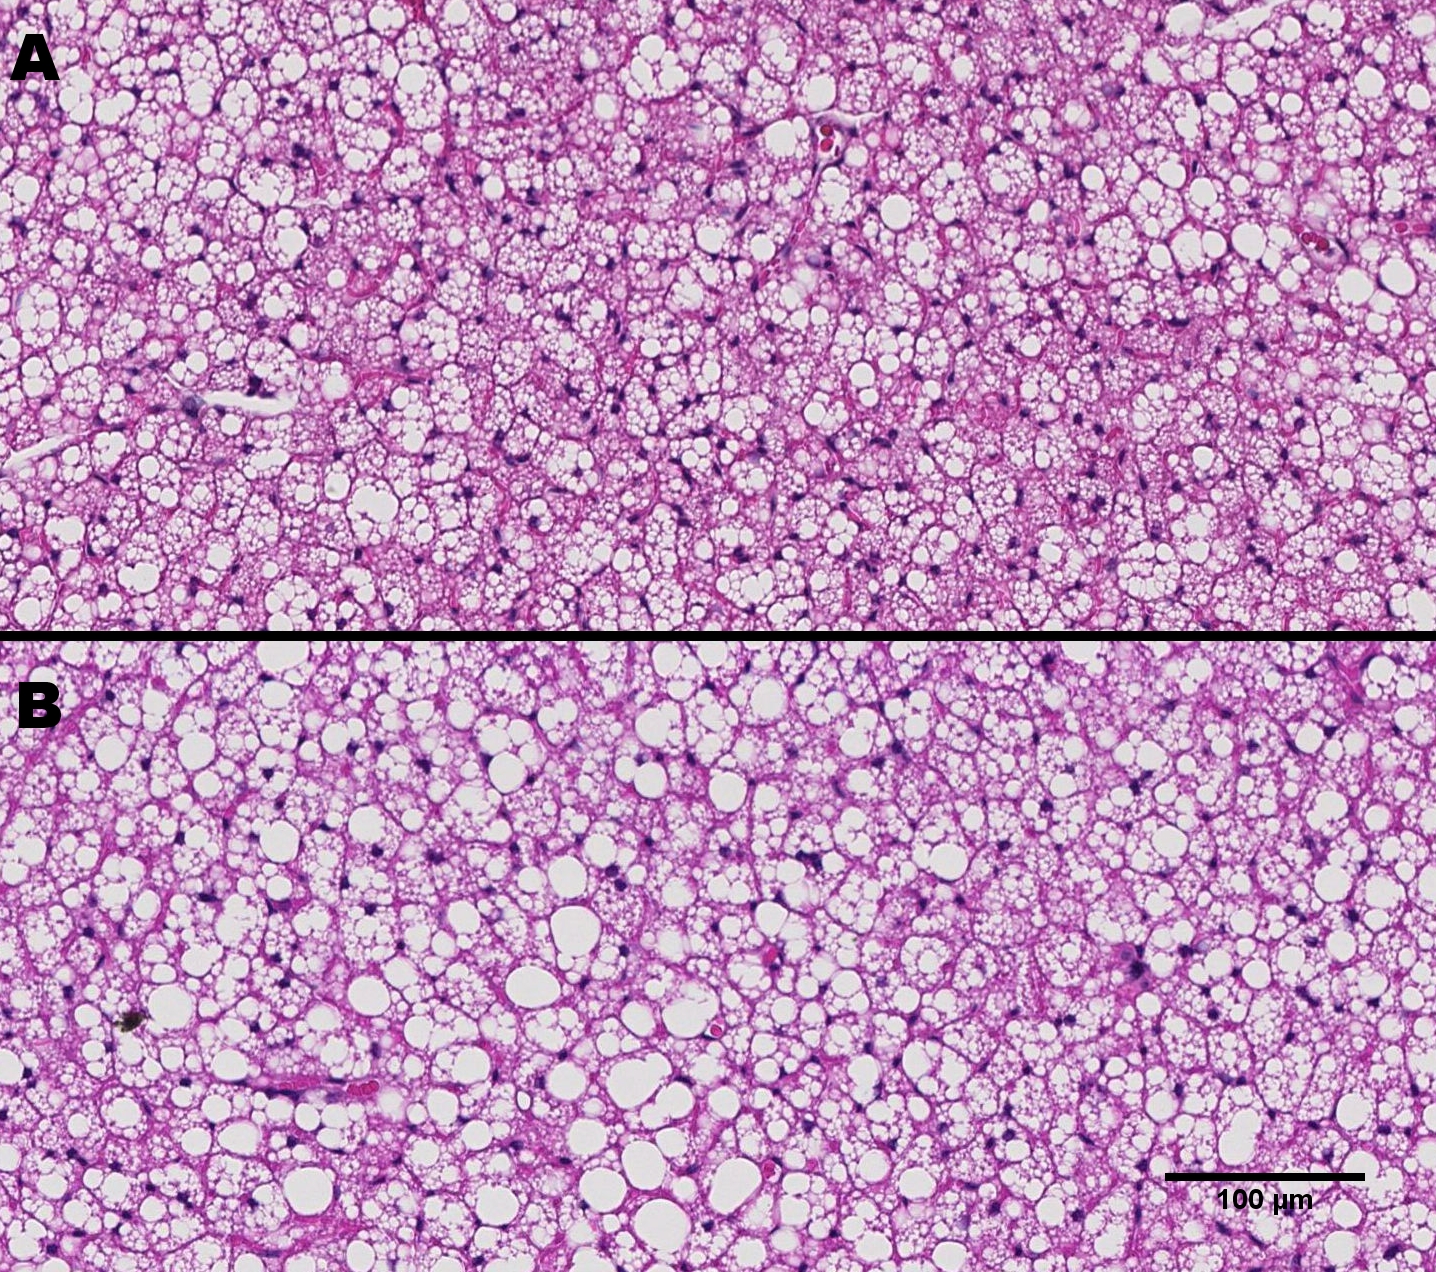
A significant reduction in ADC values is observed with increased diffusion time. With varying diffusion time from 0.5 to 2 s the ADC values for control group changed from 0.94 × 10⁻⁵ mm2/s to 0.63 × 10⁻⁵ mm2/s whereas in high fat the ADC changed from 0.95 × 10⁻⁵ mm2/s to 0.71 × 10⁻⁵ mm2/s. Both control and high-fat groups demonstrate a clear upward drift of the decay curves with increase of diffusion time Δ from 0.25 s to 2 s. An upward drift and reduction in ADC confirmed the restricted diffusion in BAT3, 4, 5. The high-fat BAT demonstrated a smaller upward drift compared to the control diet BAT, indicating reduction in restriction in high-fat BAT probably due to the increase in the droplet size. The fitting of signal decays in control and high-fat diet BAT by the Murday and Cotts model is shown in Figure 1. The log-normal distribution of the droplet size in BAT estimated from the optimized fitting parameters for control and high-fat tissues at Δ = 2 s is shown in Figure 2. The distribution curve was discretized to 64 intervals within the radius range of 0.1 to 5 mm. An increase in the mean of distribution was observed for high-fat diet BAT, which is consistent with the histological data (Figure 3). At diffusion time of Δ = 2 s, the droplet diameter (polydispersity) was estimated to be 4.04 ± 0.70 (0.40 ± 0.28) μm for control diet BAT and 4.62 ± 0.10 (0.26 ± 0.10) μm for high-fat diet BAT, respectively.Conclusion
The droplet size distribution in BAT can be determined by Diffusion spectroscopy. This approach can be extended to determine dynamic changes of lipid droplet remodeling during activation with metabolic interventions. Non-invasive measurement of lipid droplet size is also a potential way to investigate hyperplastic and hypertrophic expansion of adipose tissues.Acknowledgements
No acknowledgement found.References
1. Cinti, S. 2006. The role of brown adipose tissue in human obesity. Nutr. Metab. Cardiovasc. Dis. 16: 569–574.
2. Dorfman, S. E., D. Laurent, J. S. Gounarides, X. Li, T. L. Mullarkey, E. C. Rocheford, F. Sari-Sarraf, E. A. Hirsch, T. E. Hughes, and S. R. Commerford. 2009. Metabolic implications of dietary trans-fatty acids. Obesity (Silver Spring). 17: 1200–1207.
3. Murday, J. S., and R. M. Cotts. 1968. Self-diffusion coefficient of liquid lithium. J. Chem. Phys. 48: 4938.
4. Garasanin, T., T. Cosgrove, L. Marteaux, A. Kretschmer, A. Goodwin, and K. Zick. 2002. NMR self-diffusion studies on PDMS oil in water emulsion. Langmuir. 18: 10298–10304.
5. Cao, P., S. J. Fan, A. M. Wang, V. B. Xie, Z. Qiao, G. M. Brittenham, and E. X. Wu. 2015. Diffusion magnetic resonance monitors intramyocellular lipid droplet size in vivo. Magn. Reson. Med. 73: 59–69.
6. Fieber, W., V. Hafner, and V. Normand. 2011. Oil droplet size determination in complex flavor delivery systems by diffusion NMR spectroscopy. J. Colloid Interface Sci. 356: 422–428.
Figures