3424
Zero-TE computed Diffusion Weighted Imaging Technique for the abdomen1MRI Systems Development Department, Toshiba Medical Systems Corporation, Tochigi, Japan
Synopsis
In this study is to adapt the short-TE cDWI (sTE-cDWI) technique, including the “Zero-TE”, validated previously in the brain4 to the abdominal region. The algorithm under evaluation allows computing diffusion images for arbitrary combinations of TE and b-value based on three acquisitions (3-points method). With this method we demonstrate it is possible to suppress T2 shine-through effects and as well as improve the signal-to-noise and contrast-to-noise ratios of tissues with short T2 and low ADC. The clinical benefits of the method and the preliminary results on volunteers are discussed.
PURPOSE
A computed diffusion imaging (cDWI) algorithm was previously presented to improve lesion detection in oncology cases in the body.[1-3] This algorithm works by computing high b-value (b) equivalent images from relatively low b images. More recently a short-TE cDWI (sTE-cDWI) technique was proposed for the brain allowing computing diffusion images with arbitrary combinations of TE (including zero) and b.[4] With this method it is possible to suppress T2 shine-through effects and improve the SNR and CNR of tissues with short T2 and low ADC.
Since a clinically achievable body DWI sequence requires relatively longer TEs (50-80ms) to acquire the b=500~1000s/mm2 for the cDWI algorithm, resulting images are intrinsically T2-weighted. As such, cDWI is affected by T2 shine-through effects and may be unable to distinguish between cellular disease and tissues with long T2. It is therefore relevant to adapt the sTE-cDWI technique to the abdomen, allowing for high b (b>500s/mm2) and short TE (TE<50ms) diffusion images to be generated.
In this study we adapted the sTE-cDWI technique, including the “Zero-TE”, to the abdomen, achieving improved CNR and SNR by computing images with arbitrary b and TE, as well as reducing T2 shine-through effects. Results were tested on two healthy volunteers.
METHODS
Theory: For a SEEPI2D (mDWI) with a set TE and b, the intensity for a pixel location characterized by known T2 and ADC parameters can be modeled as:
$$S(TE,b)=k*exp[-TE/T2]*exp[-b*ADC] ---- (1)$$
k being an arbitrary coefficient. In this study, the following cDWI methods were considered:
(A) Same-TE cDWI[1-3]:
A 2-points technique is used, measuring mDWI signals at the same TE=TE2 for two different b-values (b1<b2). In these conditions the ADC image is obtained by solving (1):
$$ADC=-ln[S2(TE2,b2)/S1(TE2,b1)]/(b2-b1) ---- (2)$$
The cDWI image at the original TE=TE2 and for an arbitrary b=bc can then be obtained by replacing (2) into (1):
$$Sc(TE2,bc) =S1(TE2,b1)*exp[-(bc-b1)*ADC] ---- (3)$$
(B) Short-TE cDWI[4]:
The cDWI image at TE=TE1 (TE1<TE2) and b=bc can be computed with a 3-points technique, by replacing S1 in (3) with a separately acquired S3(TE1,b1):
$$Sc(TE1,bc) =S3(TE1,b1)*exp[-(bc-b1)*ADC] ---- (4)$$
(C) Zero-TE cDWI[4]:
Similarly to the ADC parameter, the tissue T2 can be obtained from (1) by measuring two mDWI with the same b=b1 and different TEs (TE1<TE2):
$$1/T2=-ln[S1(TE2,b1)/S3(TE1,b1)]/(TE2-TE1) ----- (5)$$
By replacing the calculated ADC (2) and T2 (5) in (1), we can compute the diffusion image at arbitrary TE=TEc and b=bc as:
$$Sc(TEc,bc) =S3(TE1,b1)*exp[-(TEc-TE1)/T2]*exp[-(bc-b1)*ADC] ----- (6)$$
With this method it is now possible to compute sTE-cDWI images free of T2-effects (TEc=0).
Volunteers study: The models described above were validated on two volunteers. Abdominal axial scans through the liver were acquired on a Toshiba 3T MR system using a single-shot SEEPI2D sequence. Acquisition parameters for the 3-points mDWI scans were: TE1=25ms with b1=0s/mm2 and TE2=38ms with b1=0 and b2=800s/mm2. TE3=50ms and TE4=75ms with b1=0s/mm2 were also acquired for a more accurate assessment of the T2map. Motion probing gradients were applied in six non-collinear directions. The cDWI signals for bc=800, 1000 and 1500s/mm2 were calculated at different TEc values, including TEc=0ms (Figure 1). ROIs were drawn on the liver, cholecyst, spleen, and the erector spinae muscle. SNR related to spleen SD and CNR with respect to the muscle were measured for each ROI (Table 1).
RESULTS AND DISCUSSION
Volunteers’ scans demonstrated an increased SNRs in the liver compared to the cholecyst for the cDWI at (TE1, b)=(25, 0) (method-B) with respect to (TE2, b)=(38, 0) (method-A). The liver-to-muscle CNR increased for shorter TEs, suggesting that the sTE-cDWI method can improve the characterization of tissues with short T2. The SNR of the cholecyst at (TE, b)=(75, 800) was reduced in short-TE cDWI images even at the same b=800s/mm2, suggesting that T2 shine-thorough effects are reduced in short-TE cDWI images.
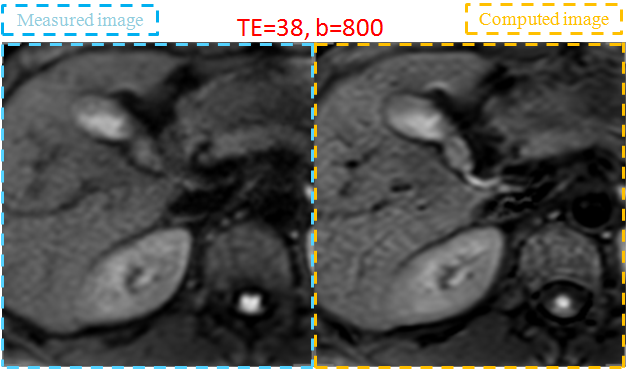
The Zero-TE cDWI (method-C) has a pure PDwi contrast, therefore a decreased signal for (TE, b)=(0, 800) is descriptive of the diffusion properties without T2 shine-thorough effects.
Although method-C requires 3-points images, it yields the benefit of providing DWI images with significantly reduce T2-effects (ADC dominant), in addition to ADC and T2 maps. Instead of the S3 image a multiecho FSE scan can be utilized.
CONCLUSION
In this study we adapted the sTE-cDWI technique[4] to the relevant case of abdominal imaging. The method demonstrated to benefit the SNR and CNR of tissues with shorter T2 and low ADC when compared to the conventional cDWI method. Additionally the technique proved capable or suppressing T2 shine-through effects. While further investigation is necessary, the method is expected to be clinically useful for an improved characterization of short-T2 tumors in the abdomen and liver.Acknowledgements
No acknowledgement found.References
1. Blackledge MD, Leach MO, Collins DJ, et al. Computed Diffusion-weighted MR Imaging May Improve Tumor Detection. Radiology: 261,573-581(2011).
2. Ueno Y, Takahashi S, Kitajima K, Kimura T et al. Computed diffusion-weighted imaging using 3-T magnetic resonance imaging for prostate cancer diagnosis. Eur Radiol 23,3509-16 (2013).
3. Kimura T, Machi Y. Computed Diffusion Weighted Imaging Under Rician Noise Distribution. In: Proceedings of the 20th Annual Meeting of ISMRM, 2012;p3574.
4. Kimura T, Machi Y et al. A short-TE Computed Diffusion Imaging (cDWI). In: Proceedings of the 23th Annual Meeting of ISMRM, 2015;p2929.
Figures
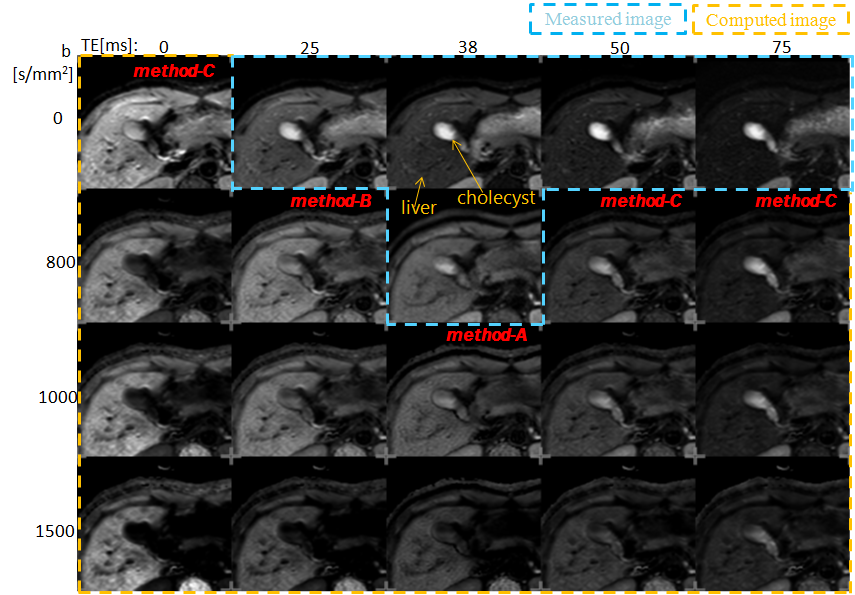
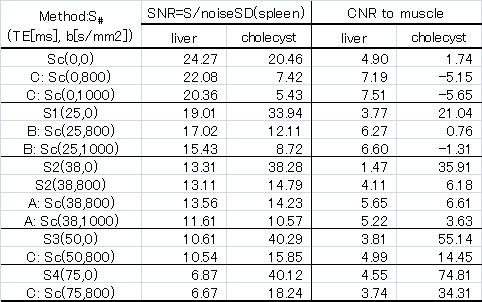
Table 1: SNR and CNR measurements for ROI drawn on the liver, cholecyst, spleen, and the erector spinae muscle for the sTE-cDWI images reproduced in Figure 1. The spleen was used as the reference organ for measuring the noise SD to be used in the SNR calculation.