3420
Diffusion-Weighted Liver MRI in Forensic Medicine: A new radiological approach1Diagnostic & Interventonal Radiology, University Medical Center Hamburg-Eppendorf, Hamburg, Germany, 2KH Rostock, 3Children's Hospital Oakland
Synopsis
In this original study and the first of its kind, the characteristic postmortem time course of liver ADC values were assessed over 24h after death. This results could be important as potential marker for tissue quality in liver transplantation. With the knowledge of the ex vivo data, DWI may be added to the MRI methods for a virtual autopsy.
Introduction
Diagnostic radiology has been playing more and more an important role in the forensic medicine in the past decades1,2. DWI has been widely applied in clinical routine to characterize abnormal tissue changes (e.g. ischemia and necrosis) in in vivo organs with the diagnostic potential to detect ischemic lesions within one hour after symptom onset in the brain3. The aim of this study was to measure the ADC in postmortem liver in the time course of 23 hours after death to assess the time-dependent changes of water diffusion caused by ischemia, and following stages of cell lysis and to compare these values to in vivo data of healthy controls.Material and Methods
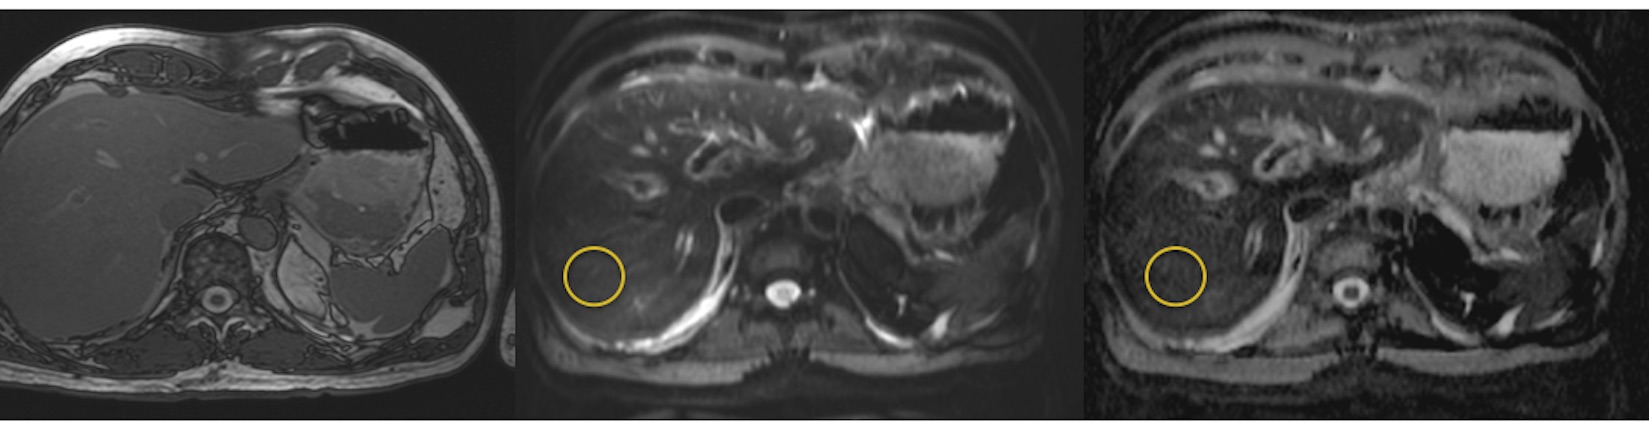
21 corpses were examined (mean age 70.5 ± 8.7years) in a time course of 23 hours after death. All examinations were performed on a 1.5 T MRI scanner. For the morphological orientation a localizer and a HASTE-sequences (TR 1840 ms, TE 125 ms, FoV 350 mm, slice thickness 0.7cm) in transverse, coronal and sagittal orientation were performed. Scans were repeated in intervals of one hour and core temperature was measured rectally prior to scans. DWI was generated in transversal orientation: TR 3000ms; TE 74ms; slice thickness 6mm; voxel size 0.9x0.9x5 mm3; 20 slices, and NEX 10 with a gradient pulse b1 = 50, 400, and 800 s/mm2. DWI was performed with a trace weighted sequence type (3 orthogonal directions). According to this equation, pixelwise ADC-maps were generated as grey values using the Siemens based software (Siemens, Germany). Postmortem diffusion weighted imaging (DWI) of the liver was performed with diffusion gradient values b= 50, 400, and 800 s/mm2. Mean ADC values were calculated from regions of interest (ROIs) in the right (RL) and left liver lobe (LL) and compared to healthy volunteers (n=5) and to literature.Results
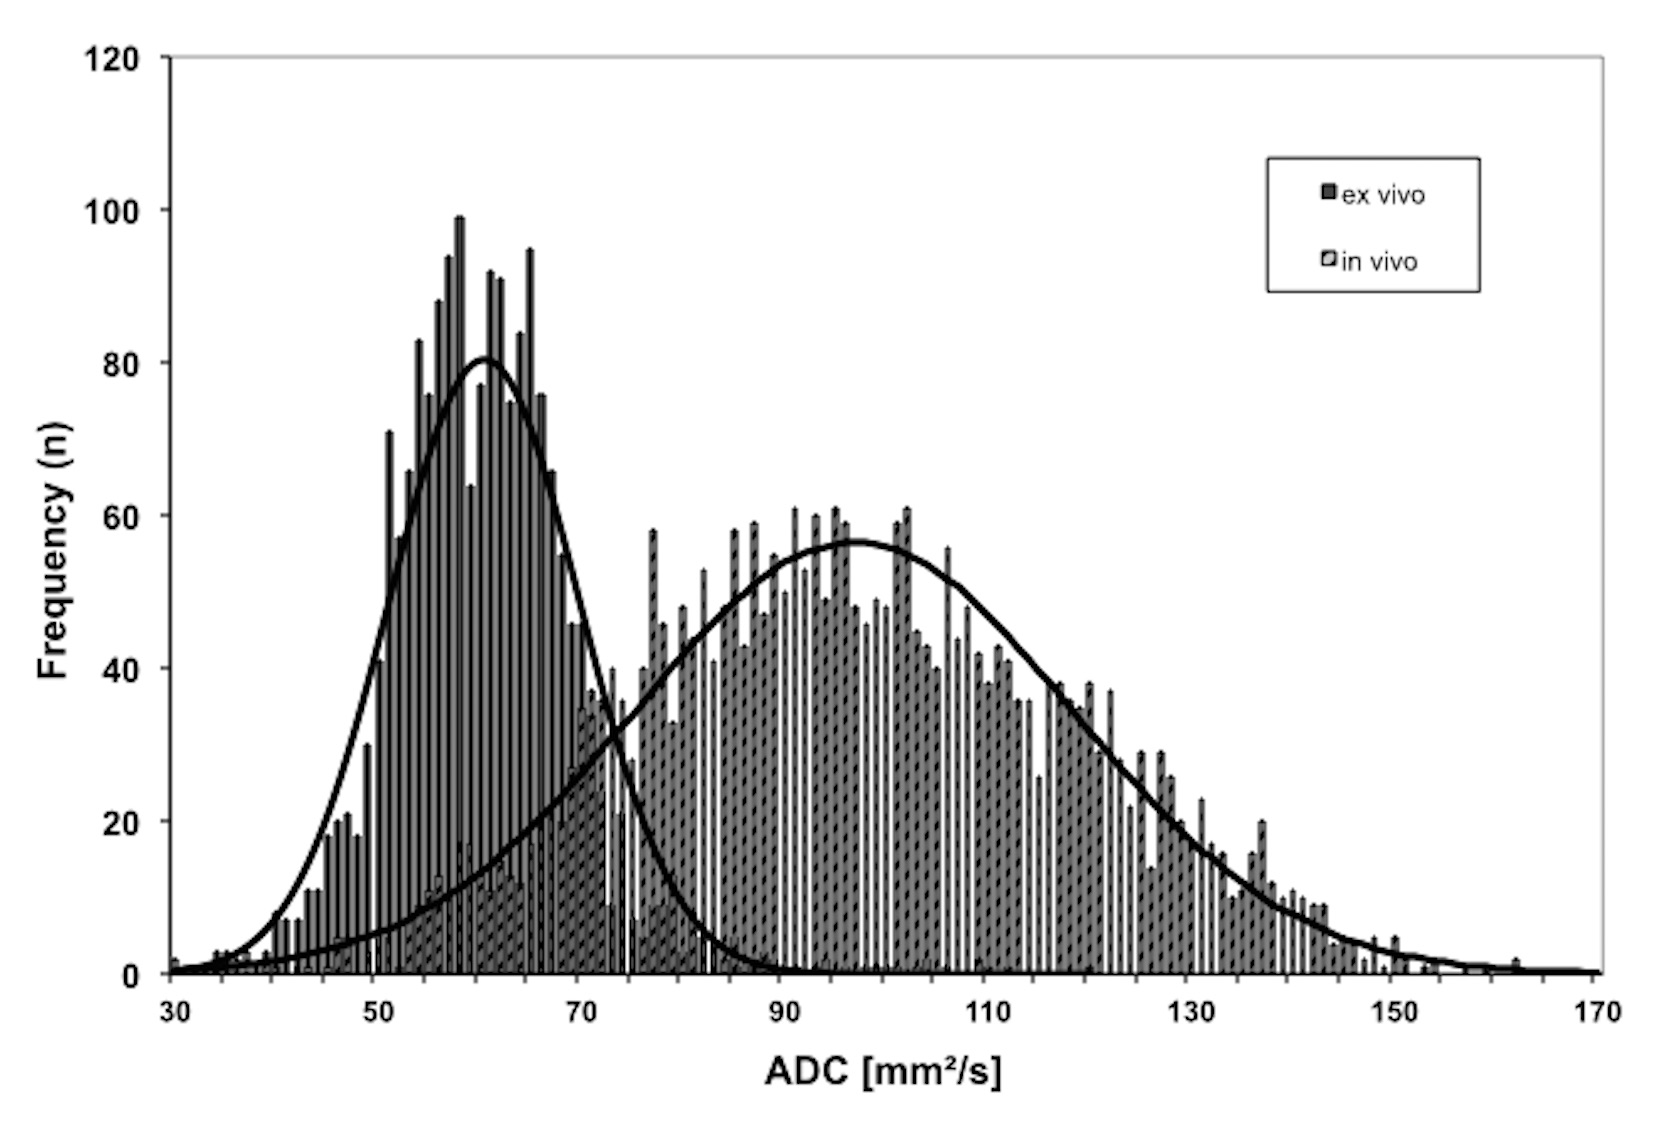
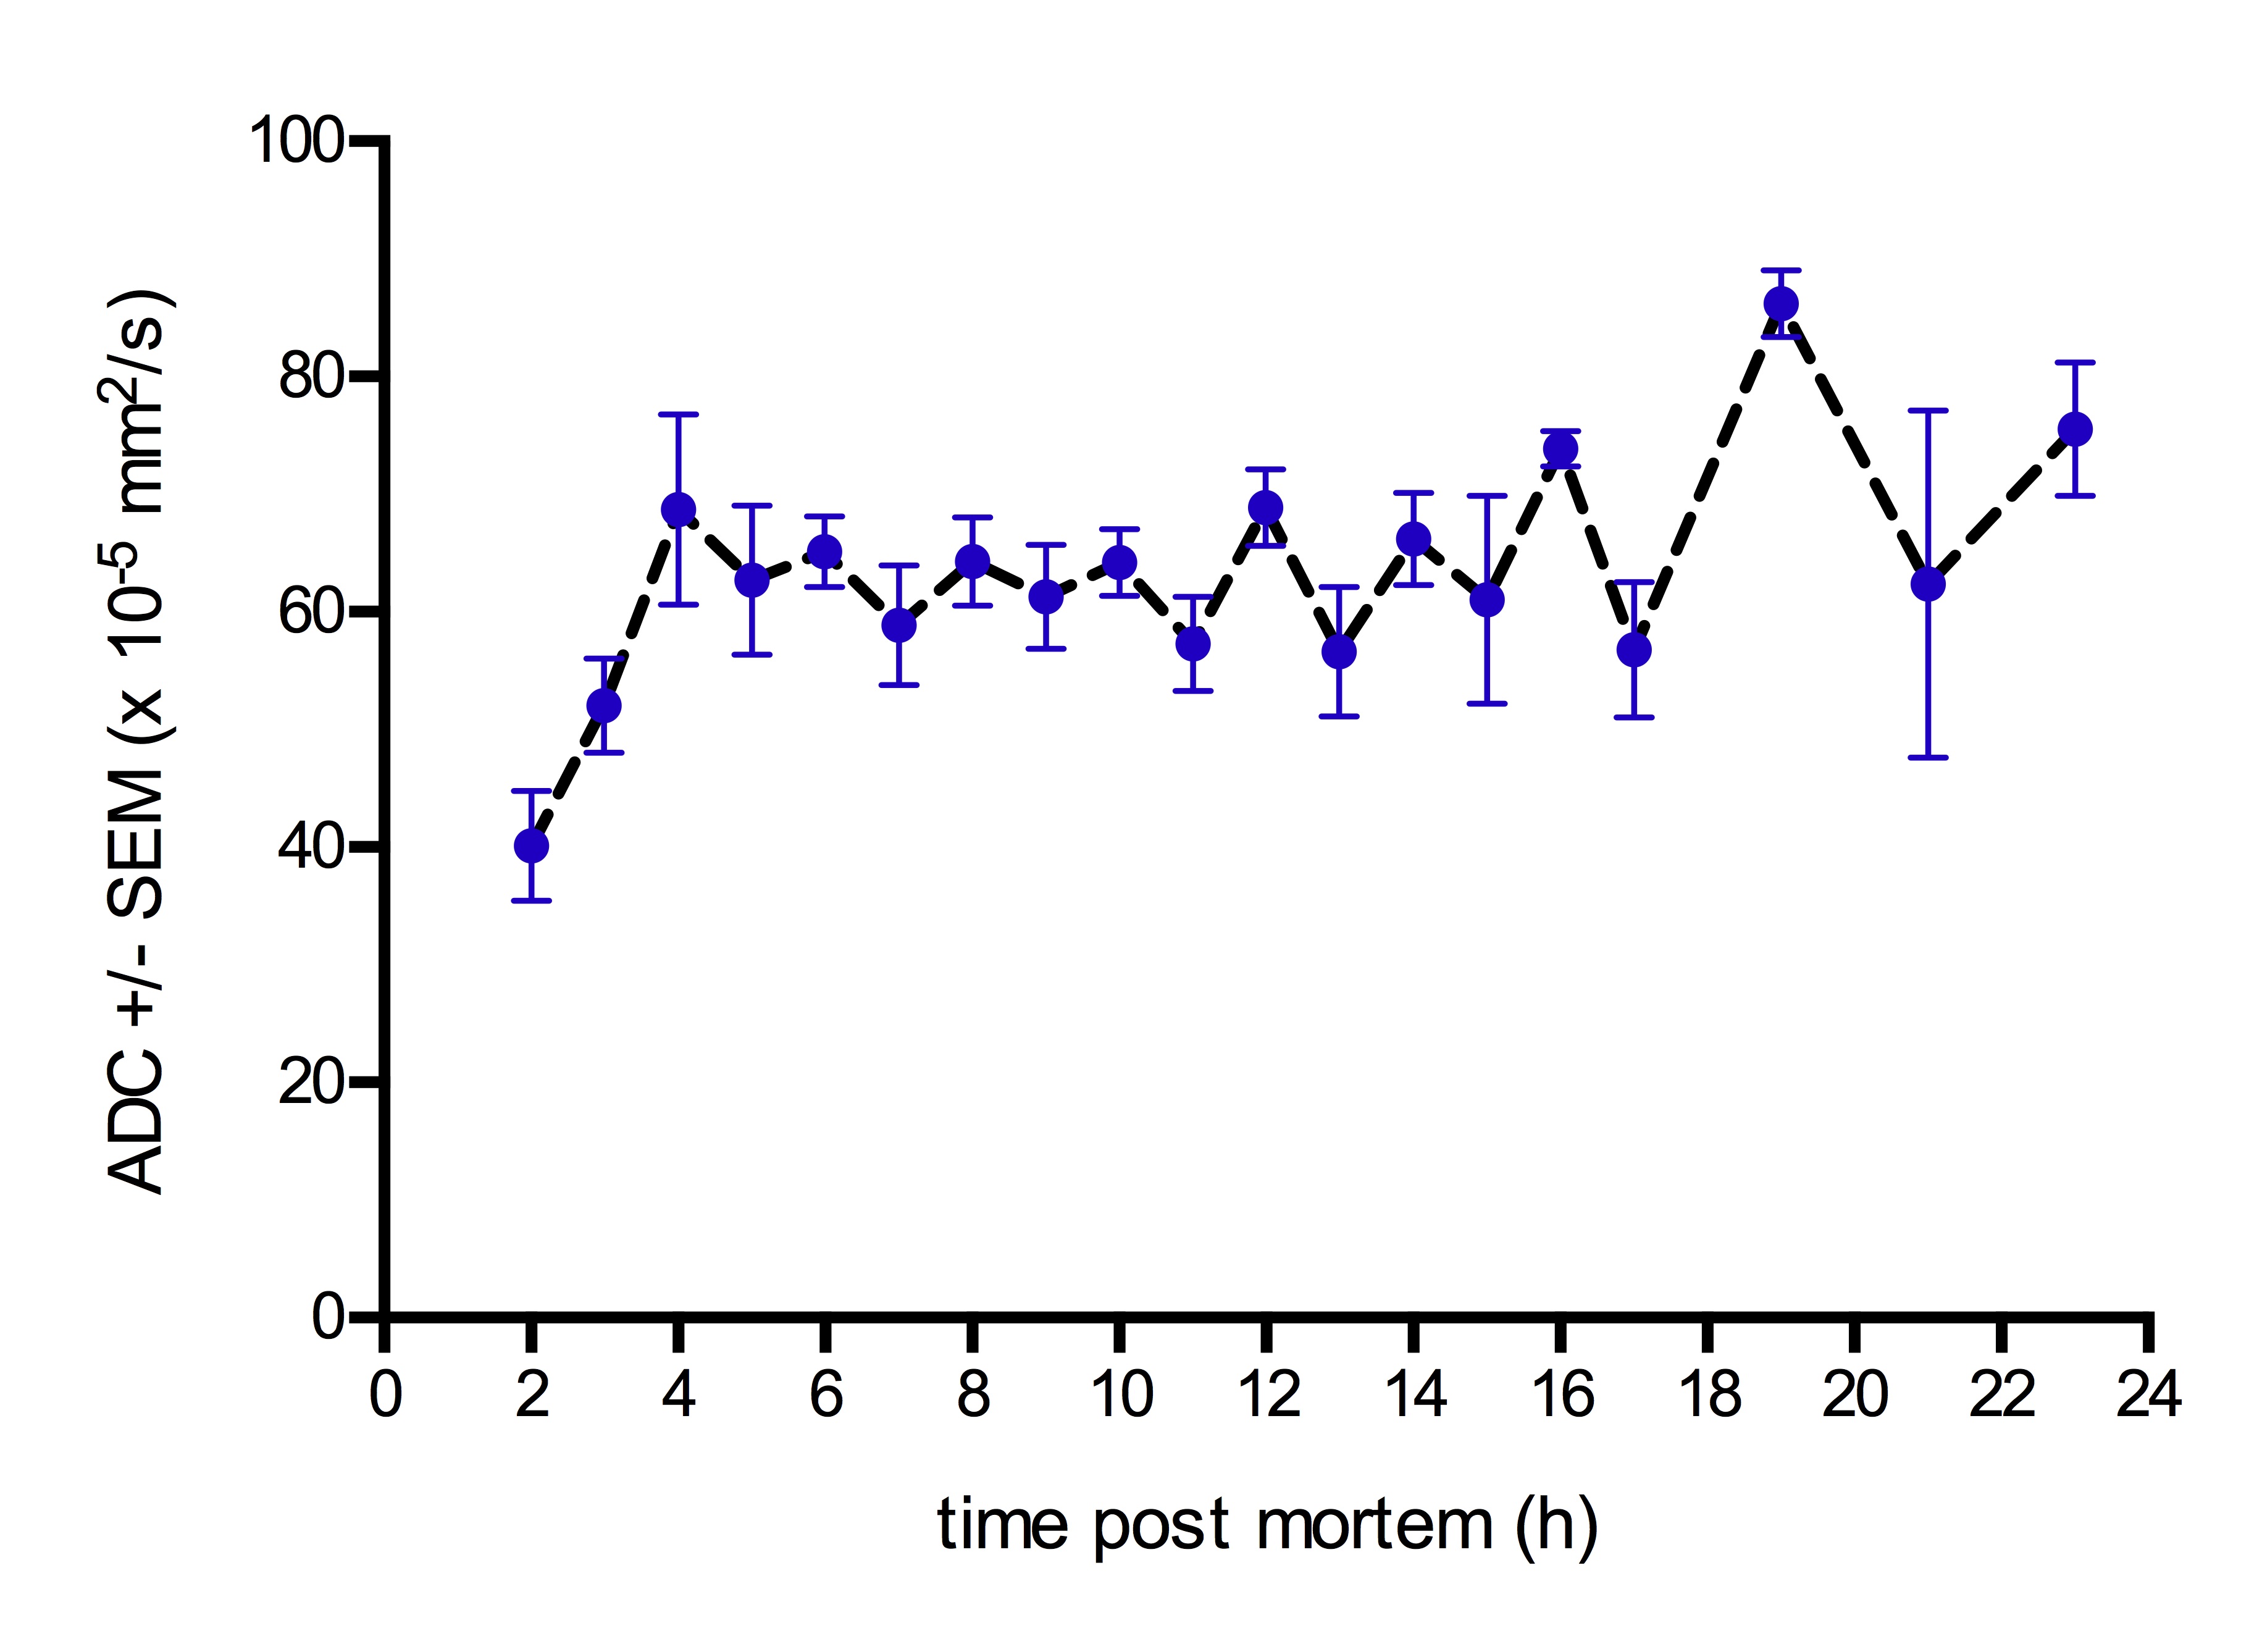
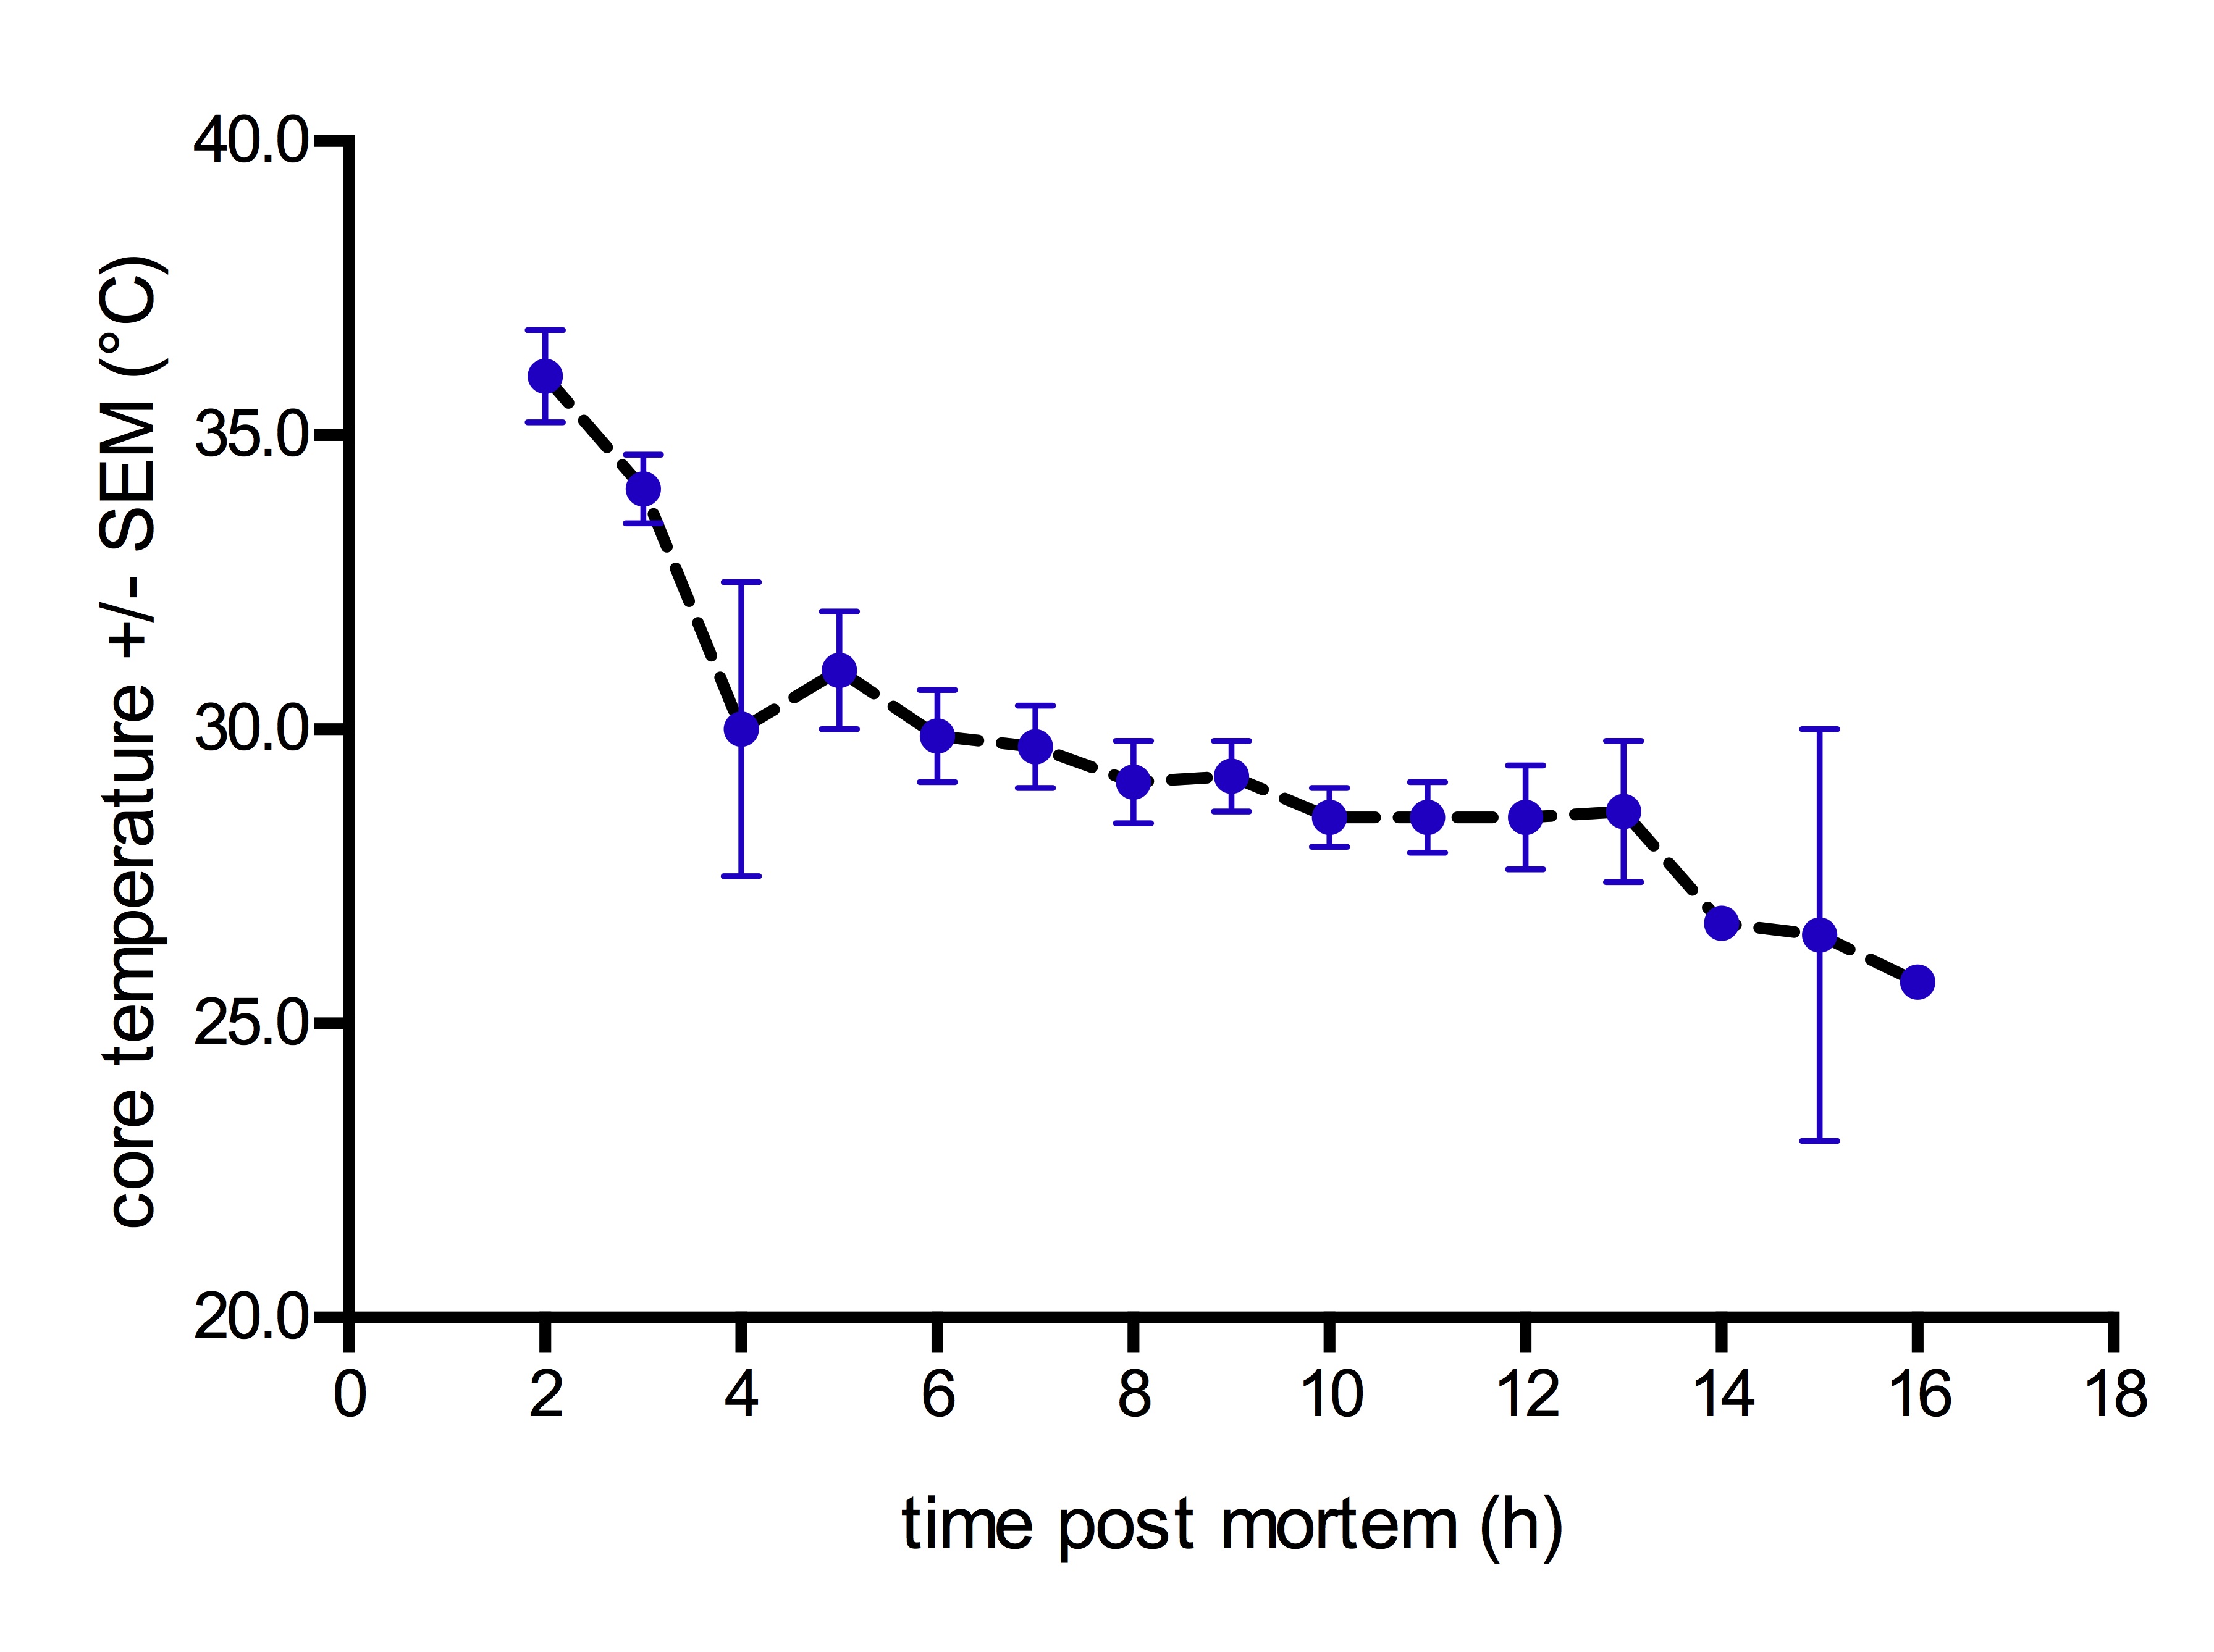
The ex vivo median liver ADC was 62.2 ± 20.7 · 10-5 mm2/s (range 17.7 to 138.7 · 10-5 mm2/s) and differed significantly from in vivo median ADC values of 110.0 ± 15.6 · 10-5 mm2/s (range 96.9 to 136.5 · 10-5 mm2/s), p<0.0001. The distribution of ADC in the postmortem group and controls followed a pattern, which could be described by a Gaussian distribution, see Figure 2. Figure 3 illustrates the postmortem time course of ADC values. Both the RL and LL showed a characteristic ADC time course. Averaged for both liver lobes, there was an increase of the median ADC (± SEM) from 40.1 ± 4.7 · 10-5 mm2/s (2 h p.m.) to 68.7 ± 8.1 · 10-5 mm2/s (4 h p.m.), followed by a stable plateau between 4 to 11 hours p.m. After 12 hours p.m. the distribution of ADC was highly variable within the postmortem group and the time course, followed by a final increase to 75.5 ± 5.7 · 10-5 mm2/s at 23 h p.m. The rectally measured body core temperature showed a characteristic decreasing time pattern from 36.0 to 25.7°C (Figure 4). In the examined time interval, the individual ADC averaged for the RL and LL, inversely correlated to the body core temperature (r= -0.67; Confidence Interval -0.77 to -0.55, p< 0.001), Figure 5.Discussion
This present study is the first of its kind and demonstrates that diffusion capacities of solid organs undergo time-specific changes after the death, which can be assessed using postmortem repetitive MRI-scans in the time frame of 24 hours. The postmortem mean ADC differed significantly from in vivo measurements of healthy control and could be described by a Gaussian distribution. Compared to a recently published study of Athurs et al. 4, the mean (± SD) ADC obtained in this study resulted to be lower (62.2 ± 20.7 · 10-5 mm2/s vs. 88.0 ± 39.0 · 10-5 ± mm2/s). This deviation could be explained by the selection of the ex vivo study cohort (adults versus fetal and childhood cases) and the correction for temperature. The prior study only looked at one time point after death, which the authors describe as one limitation of this study. New aspect compared to prior studies examining hepatic ADC postmortem, this present study was unique by following the changes of the ADC over up to 23 hours and showed a characteristic time course, characterized by a stable plateau in the first 11 hours postmortem, which could not be shown in prior studies.Conclusion
The characteristic postmortem time course of liver ADC values could be important as potential marker for tissue quality in liver transplantation. With the knowledge of the ex vivo data, DWI may be added to the MRI methods for a virtual autopsy.Acknowledgements
No acknowledgement found.References
1. Farina J, Millana C, Fdez-Acenero MJ, et al. Ultrasonographic autopsy (echopsy): a new autopsy technique. Virchows Arch 2002;440(6):635-639.
2. Brogdon BG. Scope of forensic radiology. Crit Rev Diagn Imaging 2000;41(1):43-67.
3. Fiehler J, Fiebach JB, Gass A, et al. Diffusion-weighted imaging in acute stroke--a tool of uncertain value? Cerebrovasc Dis 2002;14(3-4):187-196.
4. Arthurs OJ, Price GC, Carmichael DW, et al. Diffusion-weighted perinatal postmortem magnetic resonance imaging as a marker of postmortem interval. Eur Radiol 2015;25(5):1399-1406.
5. Kozak LR, Bango M, Szabo M, Rudas G, Vidnyanszky Z, Nagy Z. Using diffusion MRI for measuring the temperature of cerebrospinal fluid within the lateral ventricles. Acta Paediatr 2010;99(2):237-243.
Figures