3418
Application of Fast SE-EPI-based T2 Mapping in Prostate, with Comparison to Conventional CPMG-Based T2 Mapping1MR Collaboration NE Asia, Siemens Healthcare, Shanghai, People's Republic of China, 2Department of Radiology, Tongji Hospital,Tongji Medical College, Huazhong University of Science and Technology, Wuhan, People's Republic of China, 3Shanghai University of Medicine & Health Sciences, Shanghai, People's Republic of China, 4Siemens Shenzhen Magnetic Resonance Ltd., Shenzhen, People's Republic of China
Synopsis
This study compared a fast SE-EPI-based T2 mapping method with a conventional CPMG-based method. The SE-EPI method is based on multi-TE data and can be integrated into a diffusion sequence with very fast acquisition speed (around 30 s). The voxel-by-voxel and region of interest (ROI)-based comparisons were performed using two methods, which showed that their T2 maps have a strong correlation. In addition, the clinical validation showed that the T2 maps of the two methods have similar statistical significance and can be used to differentiate between prostate cancer (PCa) and benign prostatic hyperplasia (BPH). This work suggests that the SE-EPI-based method is a quick quantification method, and could be used or combined with diffusion and other quantification methods for multi-parametric analysis. In addition, it may also have potential applications in body regions which are susceptible to motion artifacts.
Purpose
The combination of T2 and ADC mapping has shown great potential in improving the accuracy of tumor differentiation and grading in the prostate1,2, while the conventional CPMG-based method of T2 mapping, which is based on spin echo sequence, is relatively slow in clinical application. In the previous work3, a SE-EPI-based T2 mapping method is used, instead of the CPMG-based method, with much faster acquisition speed. The SE-EPI-based method can be integrated into a diffusion scan and can simultaneously acquire perfectly matched T2 and ADC mapping. In this study, we applied this method to the prostate and aimed to 1) compare the T2 mapping results with the CMPG-based method; 2) show its clinical value in the differentiation of prostate cancer (PCa) and benign prostatic hyperplasia (BPH).Methods
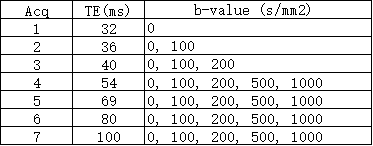
The SE-EPI datasets were acquired by using a prototype SE-EPI-based diffusion sequence, containing multiple b-values and multiple TE times. A total of 7 acquisitions were acquired, with 7 TE times from 32 to 100 ms, and each acquisition contained different b-value ranges, from 0 to 1000 s/mm² (Table 1). Other sequence parameters were: TR = 4500 ms, FOV 171 x 214 mm², slice thickness 3 mm, acquisition matrix 72 x 90. The CPMG sequence was based on a spin echo sequence; 6 echoes were acquired with TE times from 10 to 60 ms, with TR = 2000 ms, FOV 256 x 256 mm2, slice thickness 3 mm, acquisition matrix 192 x 256. For SE-EPI data, the T2 maps were calculated using a linear-least-square fitting method at each b value, with the equation: S (b, TEn) = S (b, 0) · exp (- TEn/T2), where S (b, TEn) is the signal at the n-th TE, and S (b, 0) and T2 are the fitted variables. The algorithms were implemented using MATLAB.
A total of 28 prostate datasets were collected with 55 detected lesions (6 normal, 22 BPH, 9 inflammation, 18 PCa with Gleason-score > 6) using a 3 T system (MAGNETOM Skyra, Siemens Healthcare, Erlangen, Germany). For the comparison of T2 mapping methods, 1) a voxel-by-voxel correlation analysis was performed, where the SE-EPI-based T2 map is nonlinearly registered to the CPMG-based T2 map using Elastix (http://elastix.isi.uu.nl), and the voxel-wise data were selected by drawing a ROI on the prostate region from the registered CPMG T2 map; 2) a ROI-based correlation analysis was then performed; 55 ROIs were drawn on both T2 maps, and the Pearson correlation coefficient was acquired. In the group analysis, the T2 maps at b = 0, 100, 500, 1000 s/mm² and ADC maps were used.
Experiments & Results
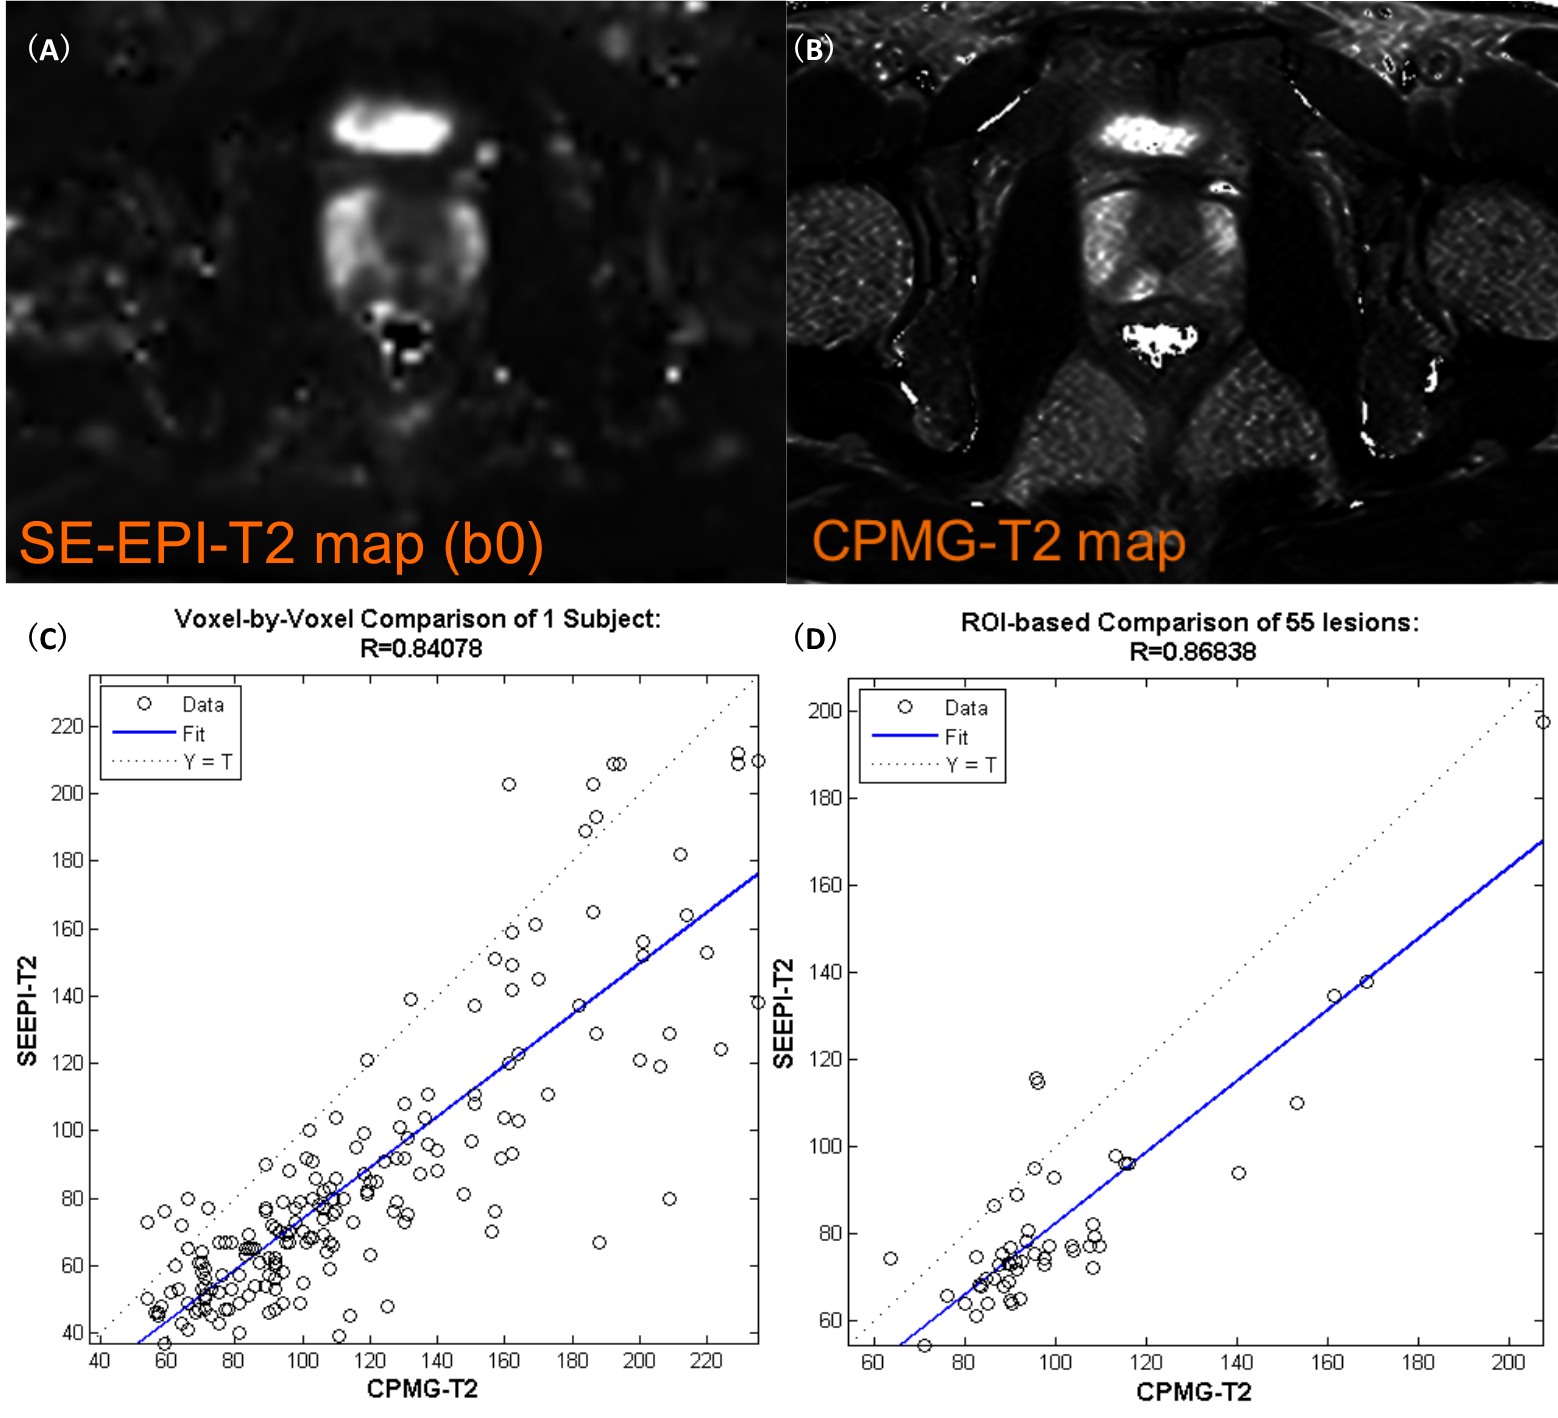
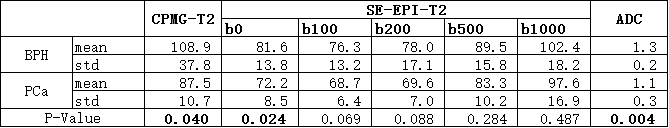
In the T2 mapping methods comparison, both voxel-by-voxel and ROI-based correlation analysis showed that the proposed SE-EPI-based method and the CMPG-based method had a strong correlation, with very high correlation coefficients at 0.84 and 0.87, respectively, and also with highly matched anatomic structures (Figure 1). The correlation of the two methods is also calculated with the following relationship: T2SE-EPI= 0.82 • T2CPMG + 0.51. The group analysis of imaging parameters showed that the SE-EPI (at b = 0) and CPMG-based T2 values showed a significant difference between BPH and PCa, with mean and standard deviation 108.9 ± 37.8 vs 87.5 ± 10.6 (CPMG) and 81.6 ± 13.8 vs 72.2 ± 8.5 (SE-EPI). ADC also showed a very significant difference.Discussion & Conclusion
The proposed SE-EPI-based T2 mapping method showed a high correlation to the conventional CPMG-based method. Although the absolute T2 value of the SE-EPI-based method is not equivalent to that of the CPMG-based method (this may be due to resolution difference or T2* contamination from EPI readout or T1 contamination of later echoes in multi-echo spin-echo sequence), the strong correlation indicates that the clinical application of T2 relaxometry quantification could be feasible with the SE-EPI-based method in differentiate various tissue types (Figure 1). The analysis of prostate data also found that the T2 maps of both methods were useful in differentiating PCa from BHP with equivalent statistical power (Figure 2). The first benefit of the SE-EPI-based method is fast acquisition. In our study, 6-7 echoes were needed to generate a robust T2 map, which takes around 30 s. Secondly, the T2 and ADC maps were perfectly matched. Therefore, the joint analysis of T2 and diffusion parameters was straightforward. In conclusion, the SE-EPI-based method could serve as a quick quantification method in multi-parametric analysis, and may also have potential applications in body organs susceptible to motion artifacts. The limitation of the method is the low spatial resolution and image distortion, which could be improved by adopting readout-segmented-EPI, Zoomed-EPI and/or slice-specific-shimming techniques.Acknowledgements
No acknowledgement found.References
[1] Chaitra Badve et al., ISMRM 2015. [2] T. Miyamoto, ECR 2014. [3]Min-xiong et al., ISMRM. 2016.Figures