3416
Relationship between diffusion kurtosis imaging and RSI: application to prostate cancer1University of California San Diego, San Diego, CA, United States, 2NTNU, Trondheim, Norway
Synopsis
This study explored the relationship between restriction spectrum imaging (RSI) and diffusion kurtosis imaging. Regions of interest for suspicious lesions and background tissue were identified in four patients with PIRADS 5 lesions. Kurtosis was estimated using either the signal fractions obtained from the RSI fit or the cumulant expansion for the NMR diffusion signal. A strong relationship was observed between RSI-derived restricted signal fraction and RSI-derived kurtosis. The performance of these two metrics was comparable in discriminating between suspicious lesions and background prostate tissue, and both outperformed the cumulant expansion approximation to kurtosis.
Introduction
Diffusion weighted magnetic resonance imaging has shown clinical utility in the characterization of prostate cancer1. Recently, advanced techniques such as restriction spectrum imaging2,6 (RSI) and diffusion kurtosis imaging3 (DKI) have shown promise by focusing on the slow-moving restricted water compartment (RSI), or quantifying the degree of heterogeneity of the diffusion environment (DKI). This study explores the relationship between these two techniques, and their discriminatory ability in a group of patients with highly suspicious prostate lesions (PIRADS 5).Methods
In this retrospective study, four patients with PIRADS 5 lesions underwent T2 imaging and an advanced multi-shell diffusion protocol at 3T. The diffusion protocol consisted of 4 non-zero b-values of 200, 1000, 2000, and 3000 s/mm2, each acquired at 6 unique diffusion directions. In addition, 6 instances of non-diffusion weighted images (b=0 s/mm2) were acquired. The diffusion data were pre-processed by correcting for distortions arising from B0 inhomogeneity4, and for the presence of Rician noise5. Regions-of-interest were drawn on the T2 images (resampled into diffusion space) in each patient for voxels corresponding to suspicious lesions and background prostate tissue. The RSI mixture model included three isotropic Gaussian response functions, representing restricted, hindered, and free water compartments. The diffusion coefficients of the 3 components were set globally across all voxels and patients as 0.1, 1.5, and 3 μm2/ms so as to represent restricted, hindered, and free diffusion, respectively. The per-voxel signal fraction of each component was calculated as the corresponding signal weighting divided by the sum of all three signal weightings. RSI-derived cellularity index (RSI-CI) refers to the signal fraction of the restricted compartment. The per-voxel excess kurtosis (herein kurtosis) was estimated using two methods. The first method derived the kurtosis from the RSI spectrum (RSI-K) using the signal fractions obtained from the RSI fit (Equation 1).
$$RSI-K=\frac{\sum_{n=1}^{3} f_n[D_n-\sum_{n=1}^{3}f_nD_n]^2}{(\sum_{n=1}^{3}f_nD_n)^2}$$
Where f represents the signal fraction of each component, and D represents the corresponding diffusion coefficient7. The second method derived the kurtosis using the cumulant expansion for the NRM diffusion signal7. Using b-values of 0, 1000, and 2000 s/mm2, the cumulant expansion kurtosis (CE-K) can be estimated using Equation 2.
$$CE-K=12\frac{(D^{(1000)}-D^{(2000)})}{2000\times(2D^{(1000)}-D^{(2000)})^2}$$
Where D(X) corresponds to the DTI estimate of the diffusion coefficient using the (0,X) pair of b-values and is calculated using Equation 3. In this case, S is the average signal intensity across all gradient directions (for non-zero b-values) or instances (for b = 0 s/mm2).
$$D^{(X)}=\frac{ln[\frac{S(b=0)}{S(b=X)}]}{X}$$
Results
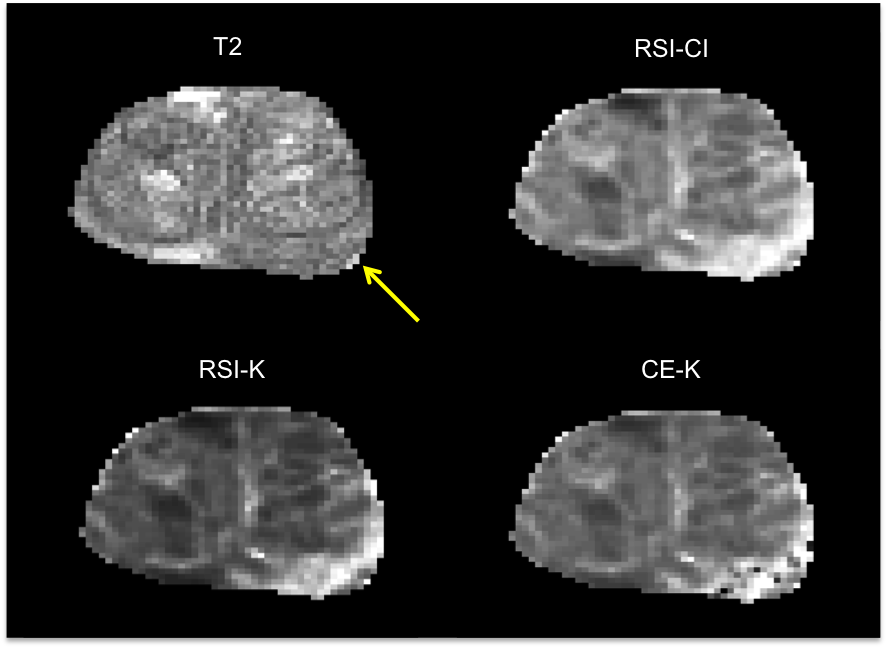
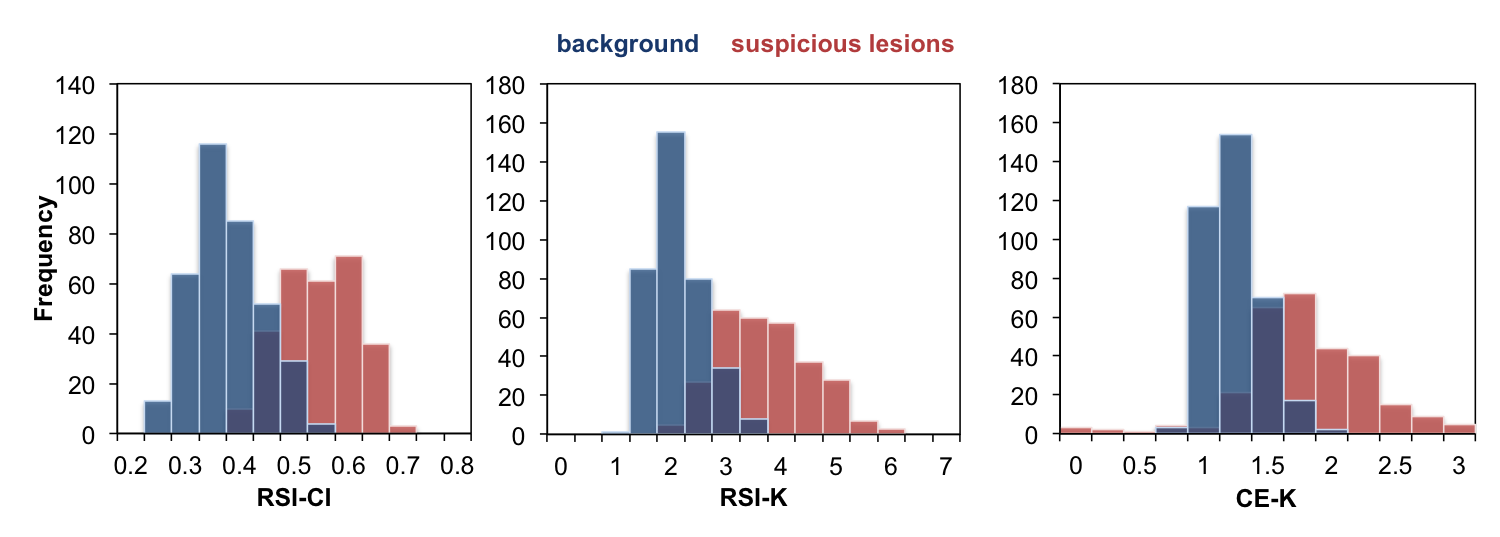
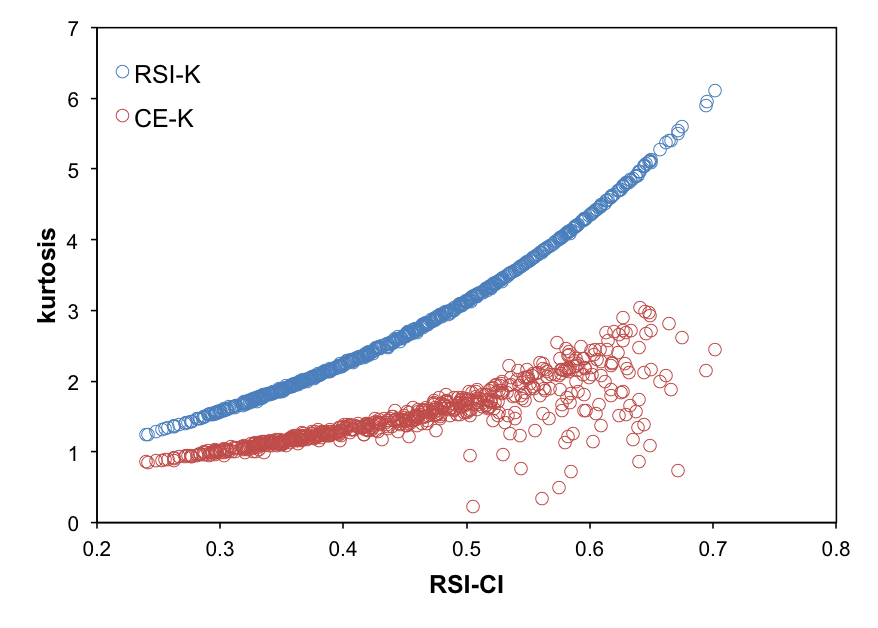
Maps of RSI-CI, RSI-K, and CE-K as well as the corresponding T2-weighted image are shown in Figure 1 for a representative patient. Histograms of the distributions of each of the three metrics for suspicious lesions and background prostate tissue across all patients are shown in Figure 2. Receiver operator characteristic curves were generated for each metric and the corresponding area under the curve (AUC) was calculated as 0.96, 0.96, and 0.88 for RSI-CI, RSI-K, and CE-K respectively. The relationship between the kurtosis metrics and RSI-CI across all patients is illustrated as a scatter plot in Figure 3. The Pearson correlation coefficient between RSI-CI and RSI-K was 0.98, while that between RSI-CI and CE-K was 0.38.Discussion
RSI-CI and RSI-K showed similar ability to discriminate between suspicious lesions and background tissue, as evidenced by similar AUC values. Figure 3 suggests that there exists a strong relationship between these two metrics and thus contain similar information. CE-K showed good discriminatory ability between suspicious and background prostate, although with a lower AUC than RSI-CI and RSI-K. It is important to note that CE-K is calculated using less data than the other two metrics. Many of the studies showing kurtosis as an imaging biomarker in prostate cancer have used the CE-approximation, as it is easy to calculate and does not require non-linear fitting of diffusion coefficients. However, our data demonstrates that the variance in CE-K increases for higher RSI-CI, presumably due to instabilities in Equation 2 as D(2000) approximately equals to D(1000). RSI is able to provide a more stable, and mathematically exact, estimate of kurtosis over a broader range of b-values, while not suffering from the pitfalls of non-linear fitting by fixing the diffusion coefficients across the entire prostate and solely estimating the per-voxel signal weightings.Conclusion
Kurtosis can be calculated from the RSI spectrum parameters using the general analytic form for a mixture of Gaussians. In prostate cancer, both the RSI-derived restricted signal fraction and RSI-derived kurtosis perform equally well in discriminating between suspicious lesions and background tissue and both outperform the cumulant-expansion approximation to kurtosis while maintaining an efficient (linear) estimation framework.Acknowledgements
General Electric, Investigator Initiated Research, Award BOK92325 (N.W.)References
1. Panagiotaki E, Chan RW, Dikaios N, et al. Microstructural characterization of normal and malignant human prostate tissue with vascular, extracellular, and restricted diffusion for cytometry in tumours magnetic resonance imaging. Invest Radiol. 2015;50(4):218-227. doi:10.1097/RLI.0000000000000115.
2. Rakow-Penner R a, White NS, Parsons JK, et al. Novel technique for characterizing prostate cancer utilizing MRI restriction spectrum imaging: proof of principle and initial clinical experience with extraprostatic extension. Prostate Cancer Prostatic Dis. 2015;18(October 2014):1-5. doi:10.1038/pcan.2014.50.
3. Rosenkrantz AB, Sigmund EE, Johnson G, et al. Prostate Cancer: Feasibility and Preliminary Experience of a Diffusional Kurtosis Model for Detection and Assessment of Aggressiveness of Peripheral Zone Cancer. Radiology. 2012;264(1):126-135. doi:10.1148/radiol.12112290.
4. Rakow-Penner RA, White NS, Margolis DJA, et al. Prostate diffusion imaging with distortion correction. Magn Reson Imaging. 2015;33(9):1178-1181. doi:10.1016/j.mri.2015.07.006.
5. Gudbjartsson H, Patz S. The Rician distribution of noisy MRI data. Magn Reson Med. 1995;34(6):910-914. doi:10.1002/mrm.1910340618.
6. White NS, Leergaard TB, D’Arceuil H, Bjaalie JG, Dale AM. Probing tissue microstructure with restriction spectrum imaging: Histological and theoretical validation. Hum Brain Mapp. 2013;34(2):327-346. doi:10.1002/hbm.21454.
7. Jensen JH, Helpern JA. MRI quantification of non-Gaussian water diffusion by kurtosis analysis. NMR Biomed. 2010;23(7):698-710. doi:10.1002/nbm.1518
Figures