3415
Effects of Echo Time on Diffusion Quantification of Prostate1Department of Radiology, Tongji Hospital, Tongji Medical College, Huazhong University of Science and Technology, Wuhan, People's Republic of China, 2MR Collaboration NE Asia, Siemens Healthcare, Shanghai, People's Republic of China
Synopsis
We performed multi-b value and multi-TE diffusion imaging with two repetition on healthy human prostate to evaluate the influence of TE on reproducibility and quantification of IVIM diffusion model. The result showed that the Dstar and f parameters of IVIM model had high CVs and particularly high variability, while conventional ADC and D showed high reproducibility and a moderate TE-dependency in the peripheral zone and mild TE-dependency in the central zone. This work suggests that using diffusion parameters as quantitative biomarkers should consider the reproducibility and TE-dependency in clinical studies.
Introduction/Purpose
Quantitative parameters derived from diffusion-weighted MR imaging (DW-MRI) are being used for lesion characterization. The IVIM (intravoxel incoherent motion) is one of DWI model widely applied, while its application in characterizing prostate cancer are controversial[1, 2]. The acquisition parameters such as the b-value, echo time, the number of averages may influence the estimated parameters. Hence, we hypothesis that TE may be one of the parameters that affect IVIM measurement variability, and this study aim to investigate the effects of TE on reproducibility and diffusion quantification of normal prostate.Methods
Eight consenting volunteers were recruited. The MR images were acquired with a 3 T system (MAGNETOM Skyra, Siemens, Erlangen, Germany) using an 18-element body coil above and a spine coil underneath the pelvis. All examinations included axial T2-W images, axial DW MR images with 9 b values (0, 10, 20, 50, 100, 200, 500, 800, 1000s/mm2). The DWI data were scanned 6 times with variable TE values of 60, 70, 80, 90, 100, 120 ms. The other parameters are consistent for all scans. TR = 2000ms, field of view (FOV) = 225 * 180mm, slice thickness = 5mm, number of averages = 4. Two repetition examinations were performed, and the volunteers were asked to rest for a duration of 15-20 minutes and come back to the scanner before the second examination. Thus, in total, each volunteer underwent 12 DWI image series. The diffusion data were processing with a prototype tool called Body Diffusion Toolbox. The ADC map of mono-exponential model and D, Dstar, f maps of IVIM model were calculated. For each of diffusion examination, regions of interest (ROIs) were drawn on b = 0 images with TE = 60 ms. On the three largest axial image at the midgland level, ROIs were drawn within the outer border of the peripheral zone (PZ) and central gland (CZ), respectively. Then the ROI was copied to the other series (TE = 70, 80, 90, 100, 120 ms) within one examination. The repeat measures coefficient of variation was calculated for each parameter. Pearson correlation coefficients were used to test the relationships between diffusion indices and TE.Results
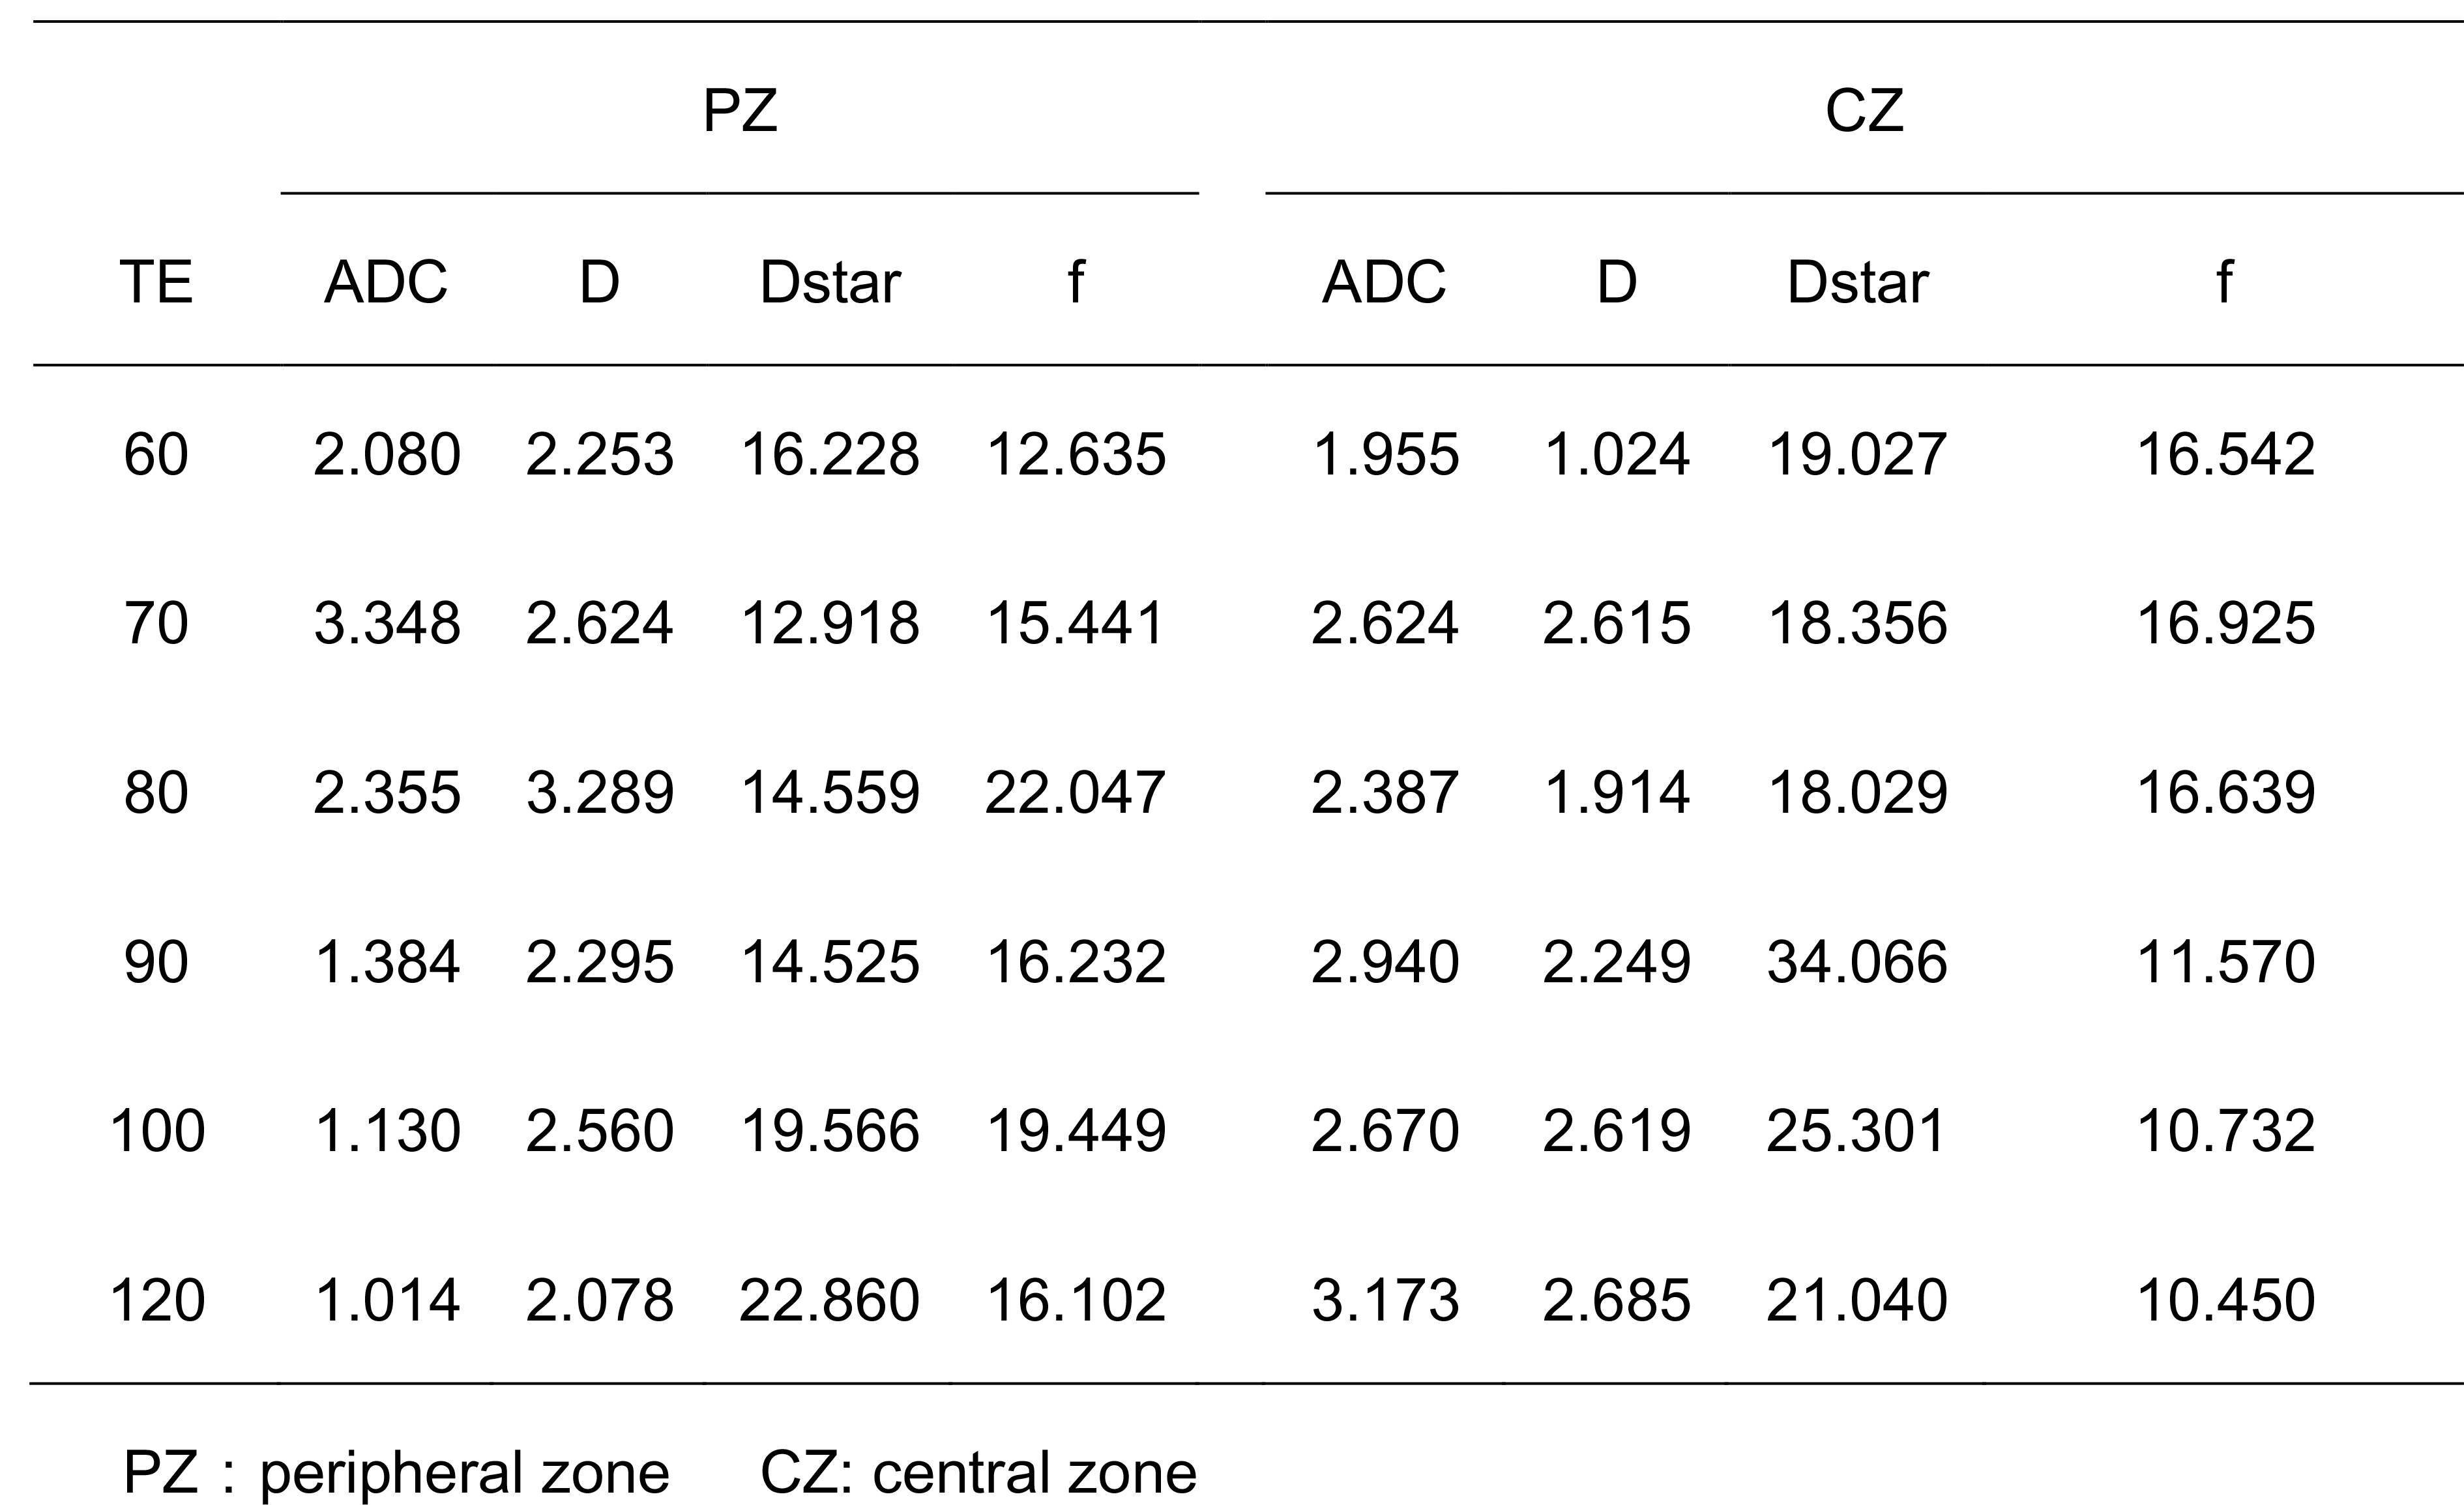
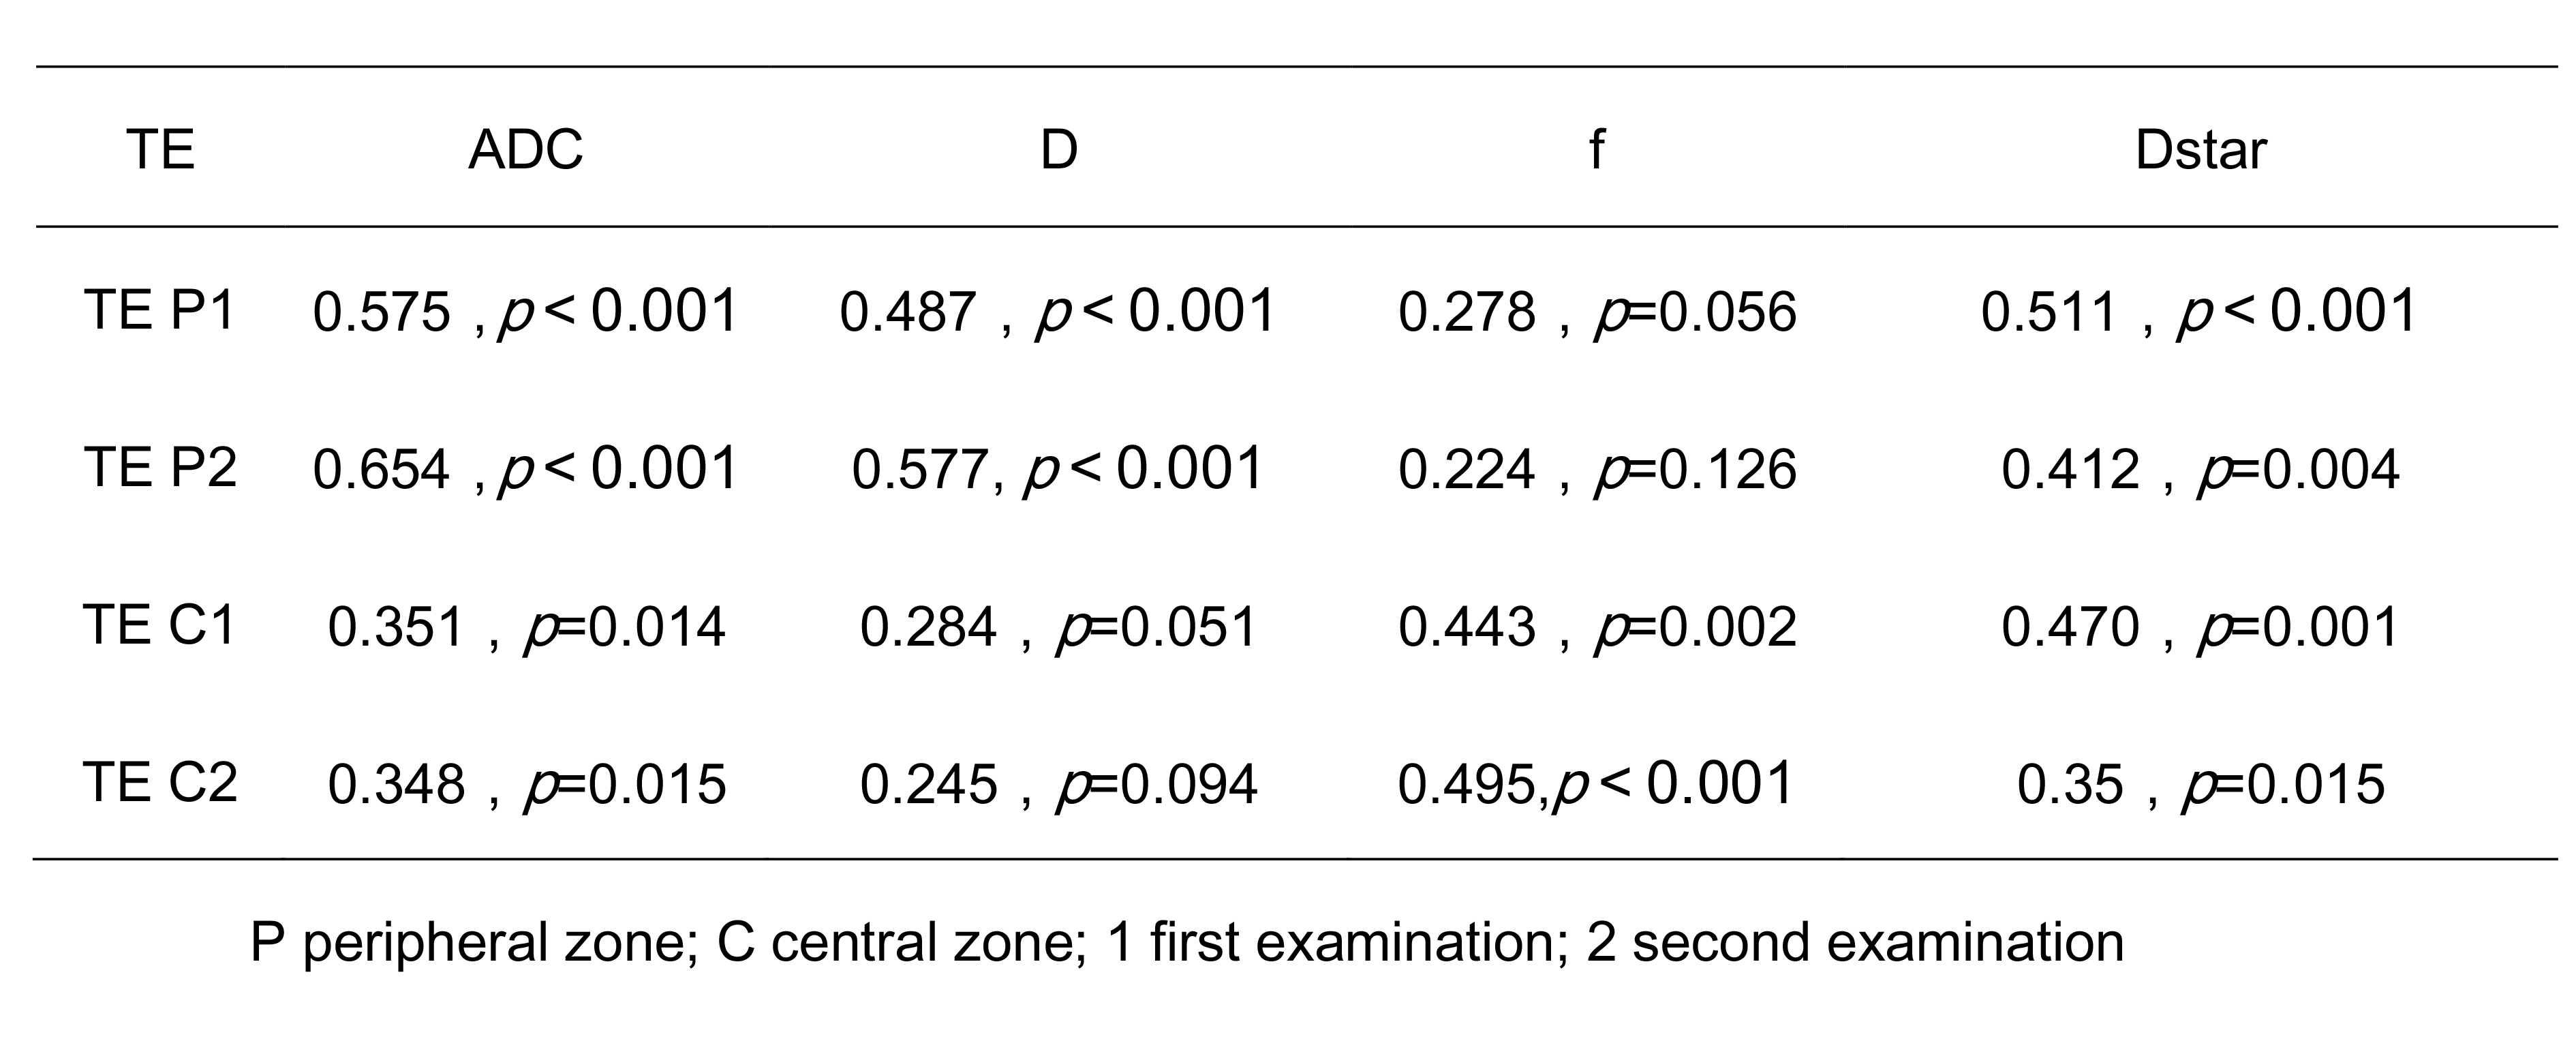
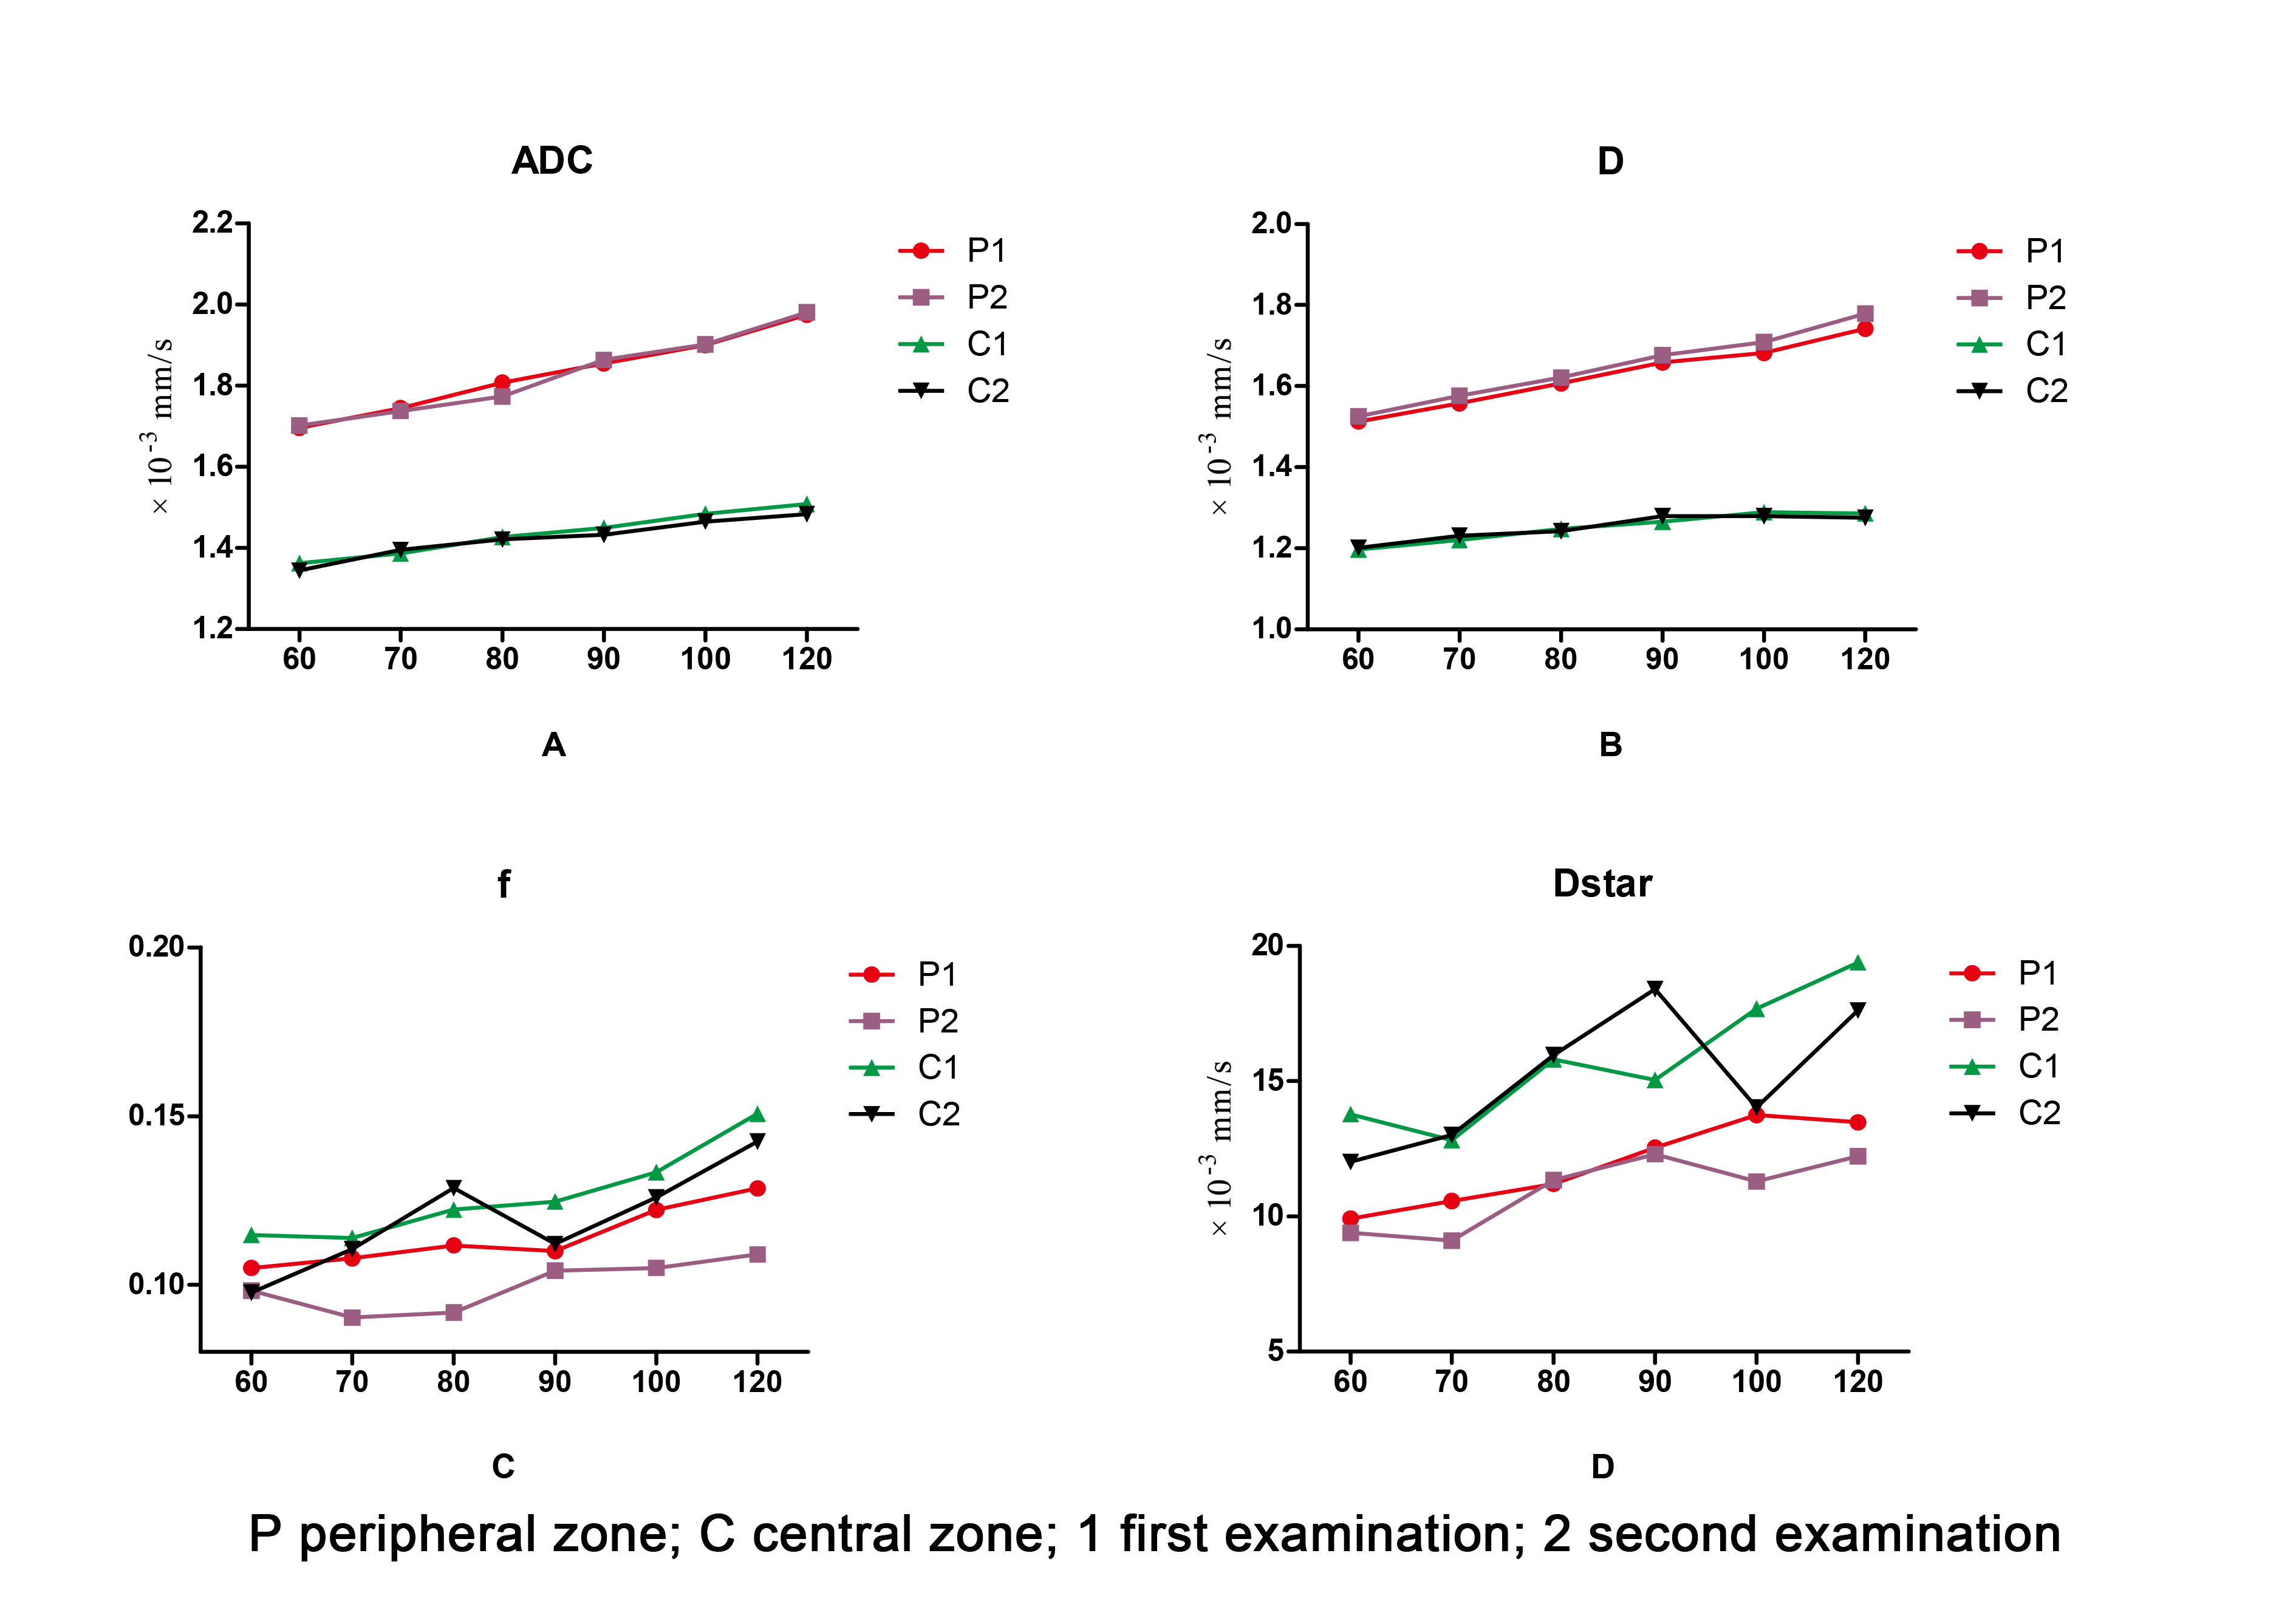
The percentage coefficient of variation (%CV) for different parameters are shown in Table 1. Both of the ADC and D achieved good reproducibility in the PZ and CZ for different TE value, with CV ranging from 1.014% to 3.348%. Poor measurement reproducibility was observed for Dstar and f. Dstar was found to be the most unreliable parameter, with a CV of 18.029% - 34.066% in the CZ, and 12.918% - 22.860% in the PZ. We observed that TE had no clear impact on reproducibility. Table 2 and Figure 1 shows the relationship between TE and diffusion parameters. The Dstar and ADC demonstrated positive correlation with TE both at PZ and CZ (p<0.05). The D demonstrated positive correlation with TE in the PZ (r = 0.487,p<0.001 for P1 (P: PZ; 1: first examination), r = 0.577, p <0.001 for P2 (P: PZ; 2: second examination)), while there was no statistically significant correlation with TE in the CZ (r = 0.284,p = 0.051 for C1(C: CZ; 1: first examination); r = 0.245,p = 0.094 for C2(C: CZ; 2: second examination)). The f was positive correlation with TE in the CZ (r = 0.443,p = 0.002 for C1; r = 0.495,p<0.001 for C2), while there was no correlation with TE in the PZ (r = 0.278,p = 0.056 for P1; . r = 0.224,p = 0.126 for P2).Discussion/Conclusion
The results showed that Dstar and f derived from IVIM had high CVs and different TE did not have a significant effect on the measured parameter reproducibility. This finding may challenges the use of Dstar and f as quantitative biomarkers due to high level of reproducibility is a prerequisite to translating diffusion indices into clinical application. In addition, ADC and D had good reproducibility. Furthermore, a moderate TE-dependency were found in PZ, while mild or no TE-dependency were found in CZ (Table 2, Figure 1). This may due to the difference of T2 relaxation and tissue contents between normal PZ and normal CZ. In conclusion, ADC and D are good parameters for quantitative analysis in prostate, whereas TE influence diffusion quantification especially in prostate peripheral zone. This may be helpful for guiding clinical research, especially longitudinal studies.Acknowledgements
No acknowledgement found.References
1. Pang Y, Turkbey B, Bernardo M, et al. Intravoxel incoherent motion MR imaging for prostate cancer: an evaluation of perfusion fraction and diffusion coefficient derived from different b-value combinations. Magn Reson Med 2013;69(2):553-562.
2. Kuru TH, Roethke MC, Stieltjes B, et al. Intravoxel incoherent motion (IVIM) diffusion imaging in prostate cancer - what does it add? J Comput Assist Tomogr 2014;38(4):558-564.
Figures