3413
Evaluation of Different Diffusion Models and Different B-value Ranges in the Detection of Peripheral Zone Prostate Cancer Using B-values up to 4500 s/mm21Tongji Medical College, Huazhong University of Science & Technology, Wuhan, People's Republic of China, 2GE Healthcare China, Guangzhou 510080, China
Synopsis
We performed multi-b value diffusion-weighted imaging (DWI) to compare four phenomenological models (mono-exponential, bi-exponential, stretched exponential, and diffusion kurtosis imaging) with in vivo prostate cancer DWI data. A secondary aim is to compare results for different b-value ranges. The result showed that ADC derived from conventional mono-exponential model high b value (about 3200s/mm2) is an optional parameter for peripheral zone prostate cancer detection.
Introduction
The diffusion-weighted imaging (DWI) signal attenuation with increasing b-value has been characterized with a range of mathematical models. The most common models are the mono-exponential, bi-exponential, stretched exponential models, and diffusion kurtosis imaging. Diffusion models have generally been compared by assessment of their prediction performance and have shown inconsistent results(1,2). This study aimed to evaluate the diagnostic performance of different diffusion models and different b-value ranges in the detection of peripheral zone prostate cancer (PZ PCa).Method
Fifty-six patients with histologically proven PZ PCa underwent DWI using 21 b-values (0-4500 s/mm2) were recruited for this prospective study. All patients underwent 21b axial DWI before biopsy on a 3T system (Discovery 750, GE, USA) with a 32-element torso phased-array coil. 21b DWI used the following parameters: TR, 2500 ms; TE, 84.1 ms; slice thickness, 5 mm; inter-slice gap, 0 mm; FOV, 400×280 mm2; and 21 b values 0, 20, 50, 80, 100, 150, 200, 400, 600, 800, 1000, 1200, 1500, 1800, 2000, 2400, 2800, 3200, 3600, 4000, 4500 s/mm2. The total acquisition time was 10 minutes and 20 seconds. The mean signal intensities of the regions of interest (ROIs) placed in benign PZs and cancerous tissues on DWI images were fitted using mono-exponential, bi-exponential, stretched-exponential, and diffusion kurtosis models. The b-values were divided into four ranges: 0-1000, 0-2000, 0-3200, and 0-4500 s/mm2, grouped as A, B, C, and D, respectively. ADC, <D>, D*, f, DDC, α, Dapp, and Kapp were estimated for each group. The independent t-test was performed to compare the differences in parameters between benign PZs and cancerous tissues. Receiver operating characteristic curve analysis was performed to evaluate the diagnostic performance of the parameters.Result
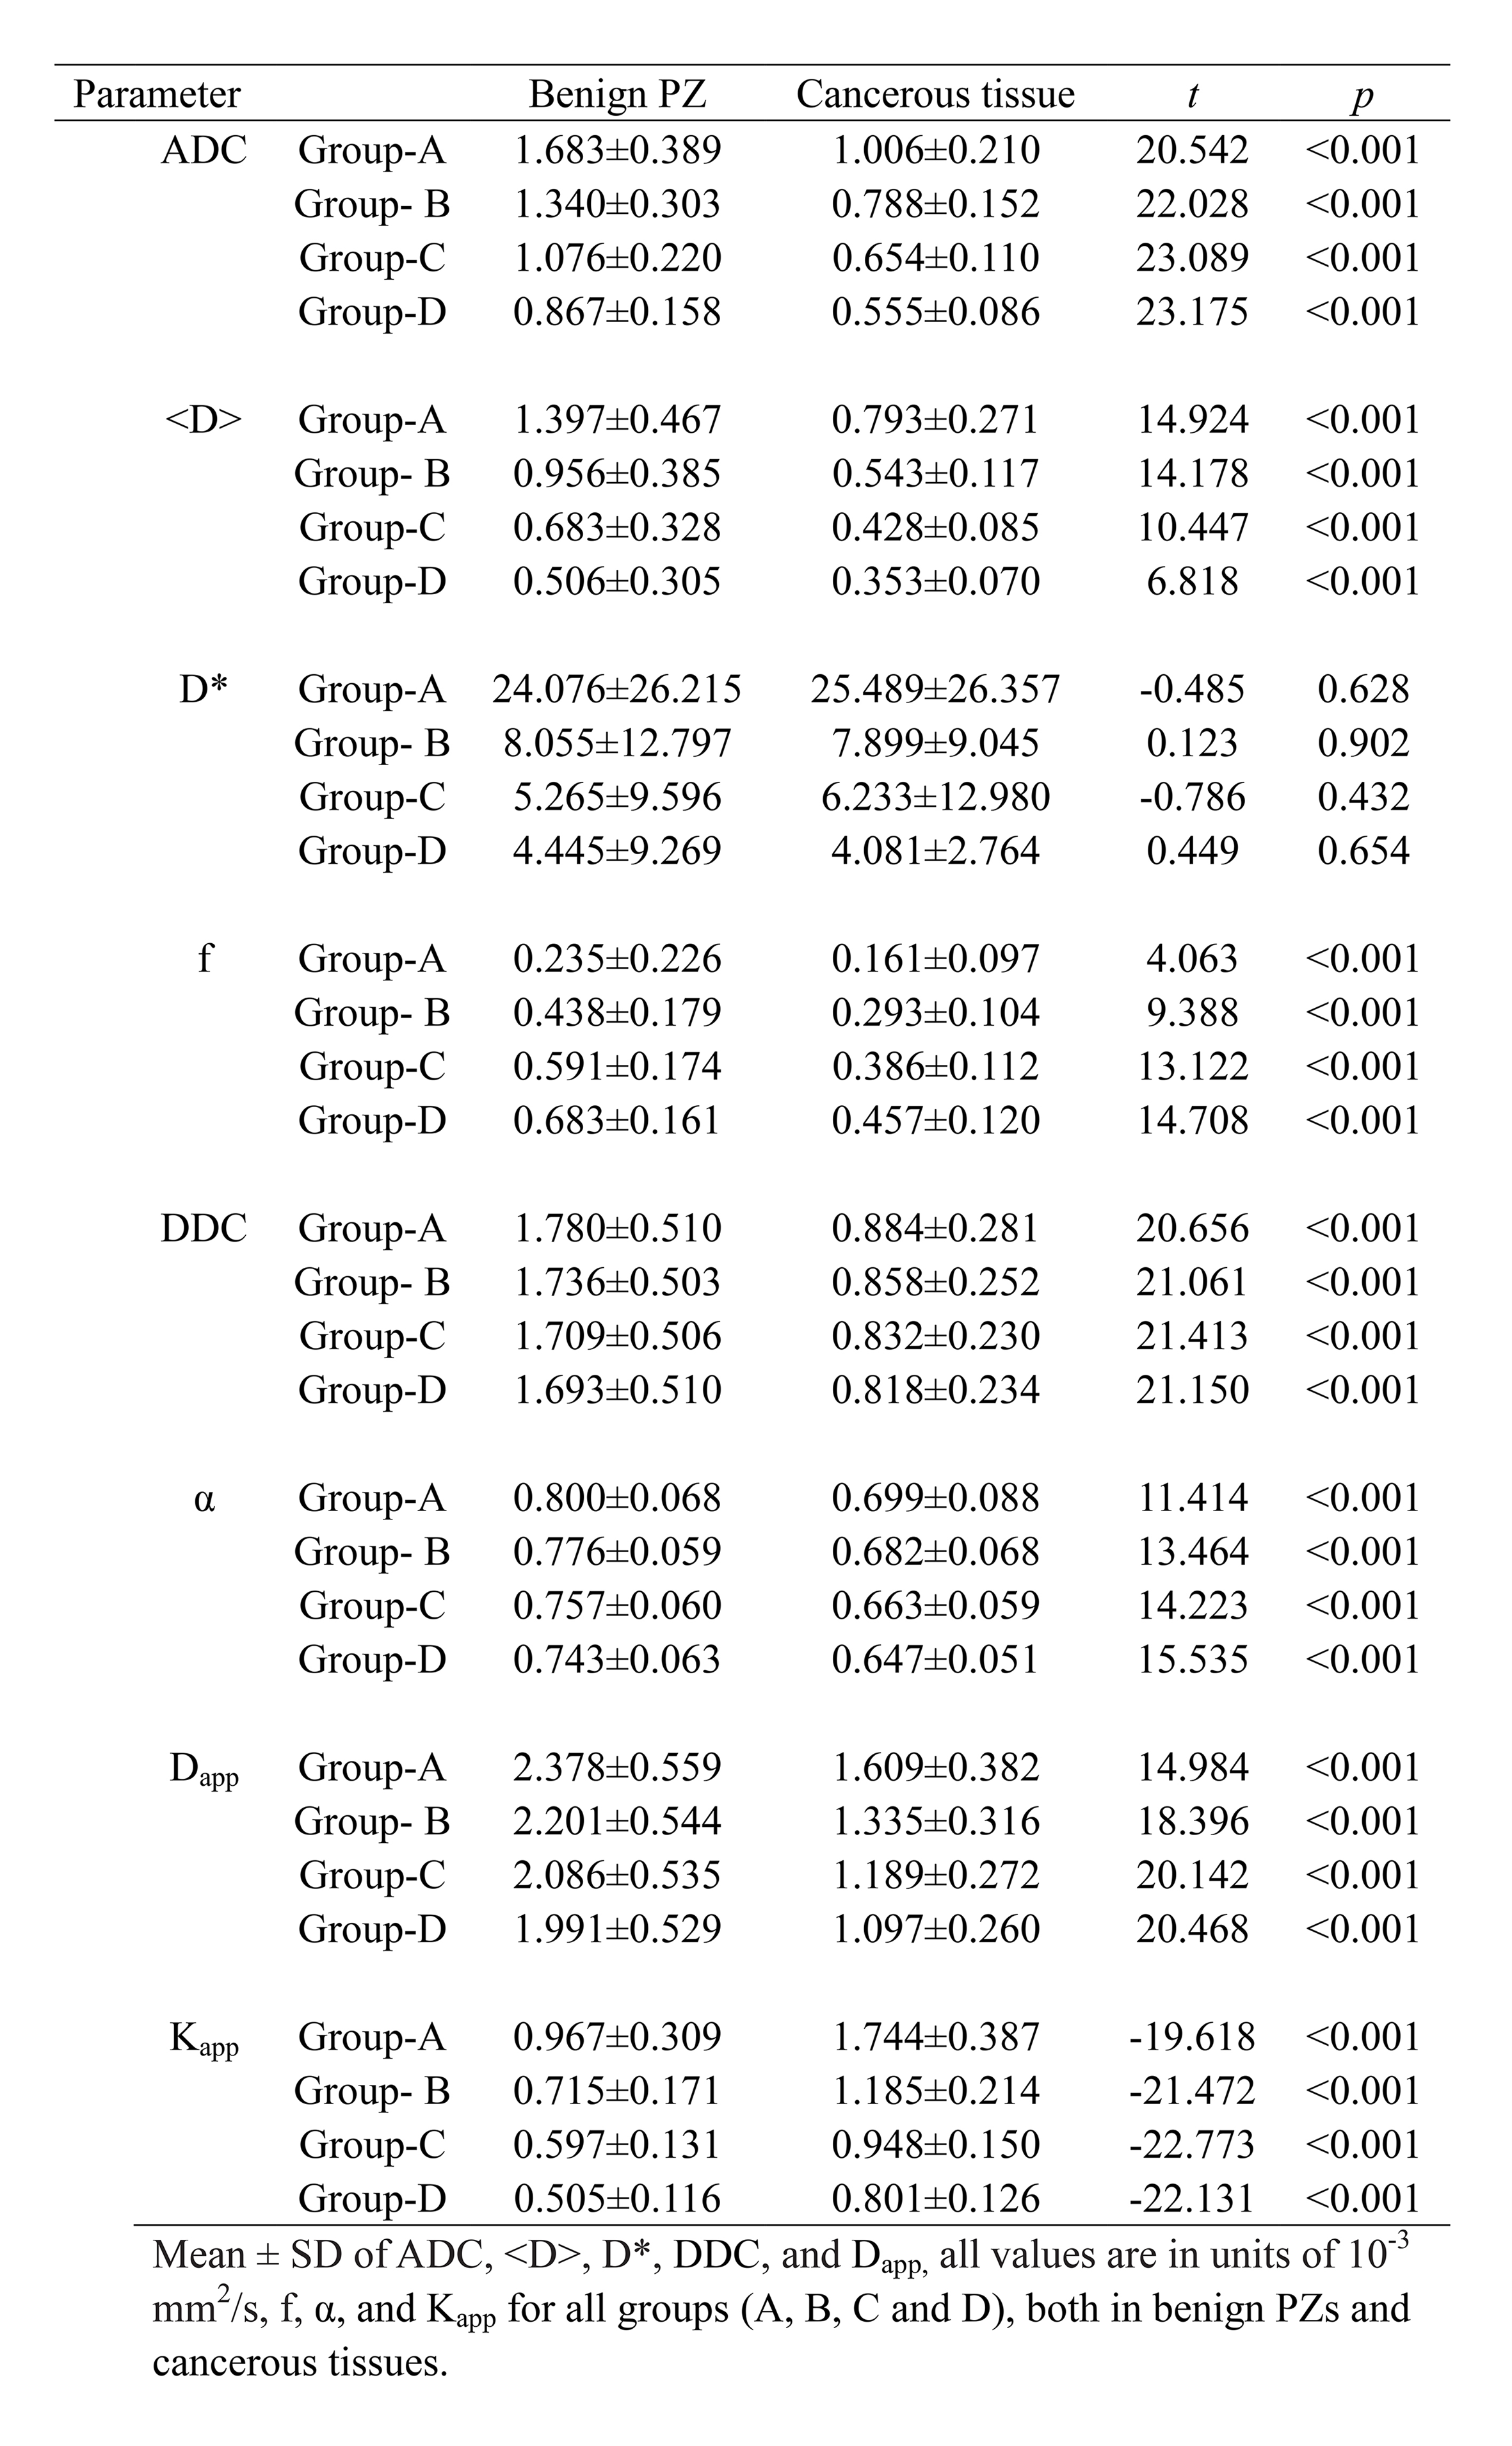
The mean values and standard deviations of the diffusion parameters measured in groups A, B, C, and D are summarized in Table 1. All parameters except D* showed significant differences between cancerous tissues and benign PZs in each group.
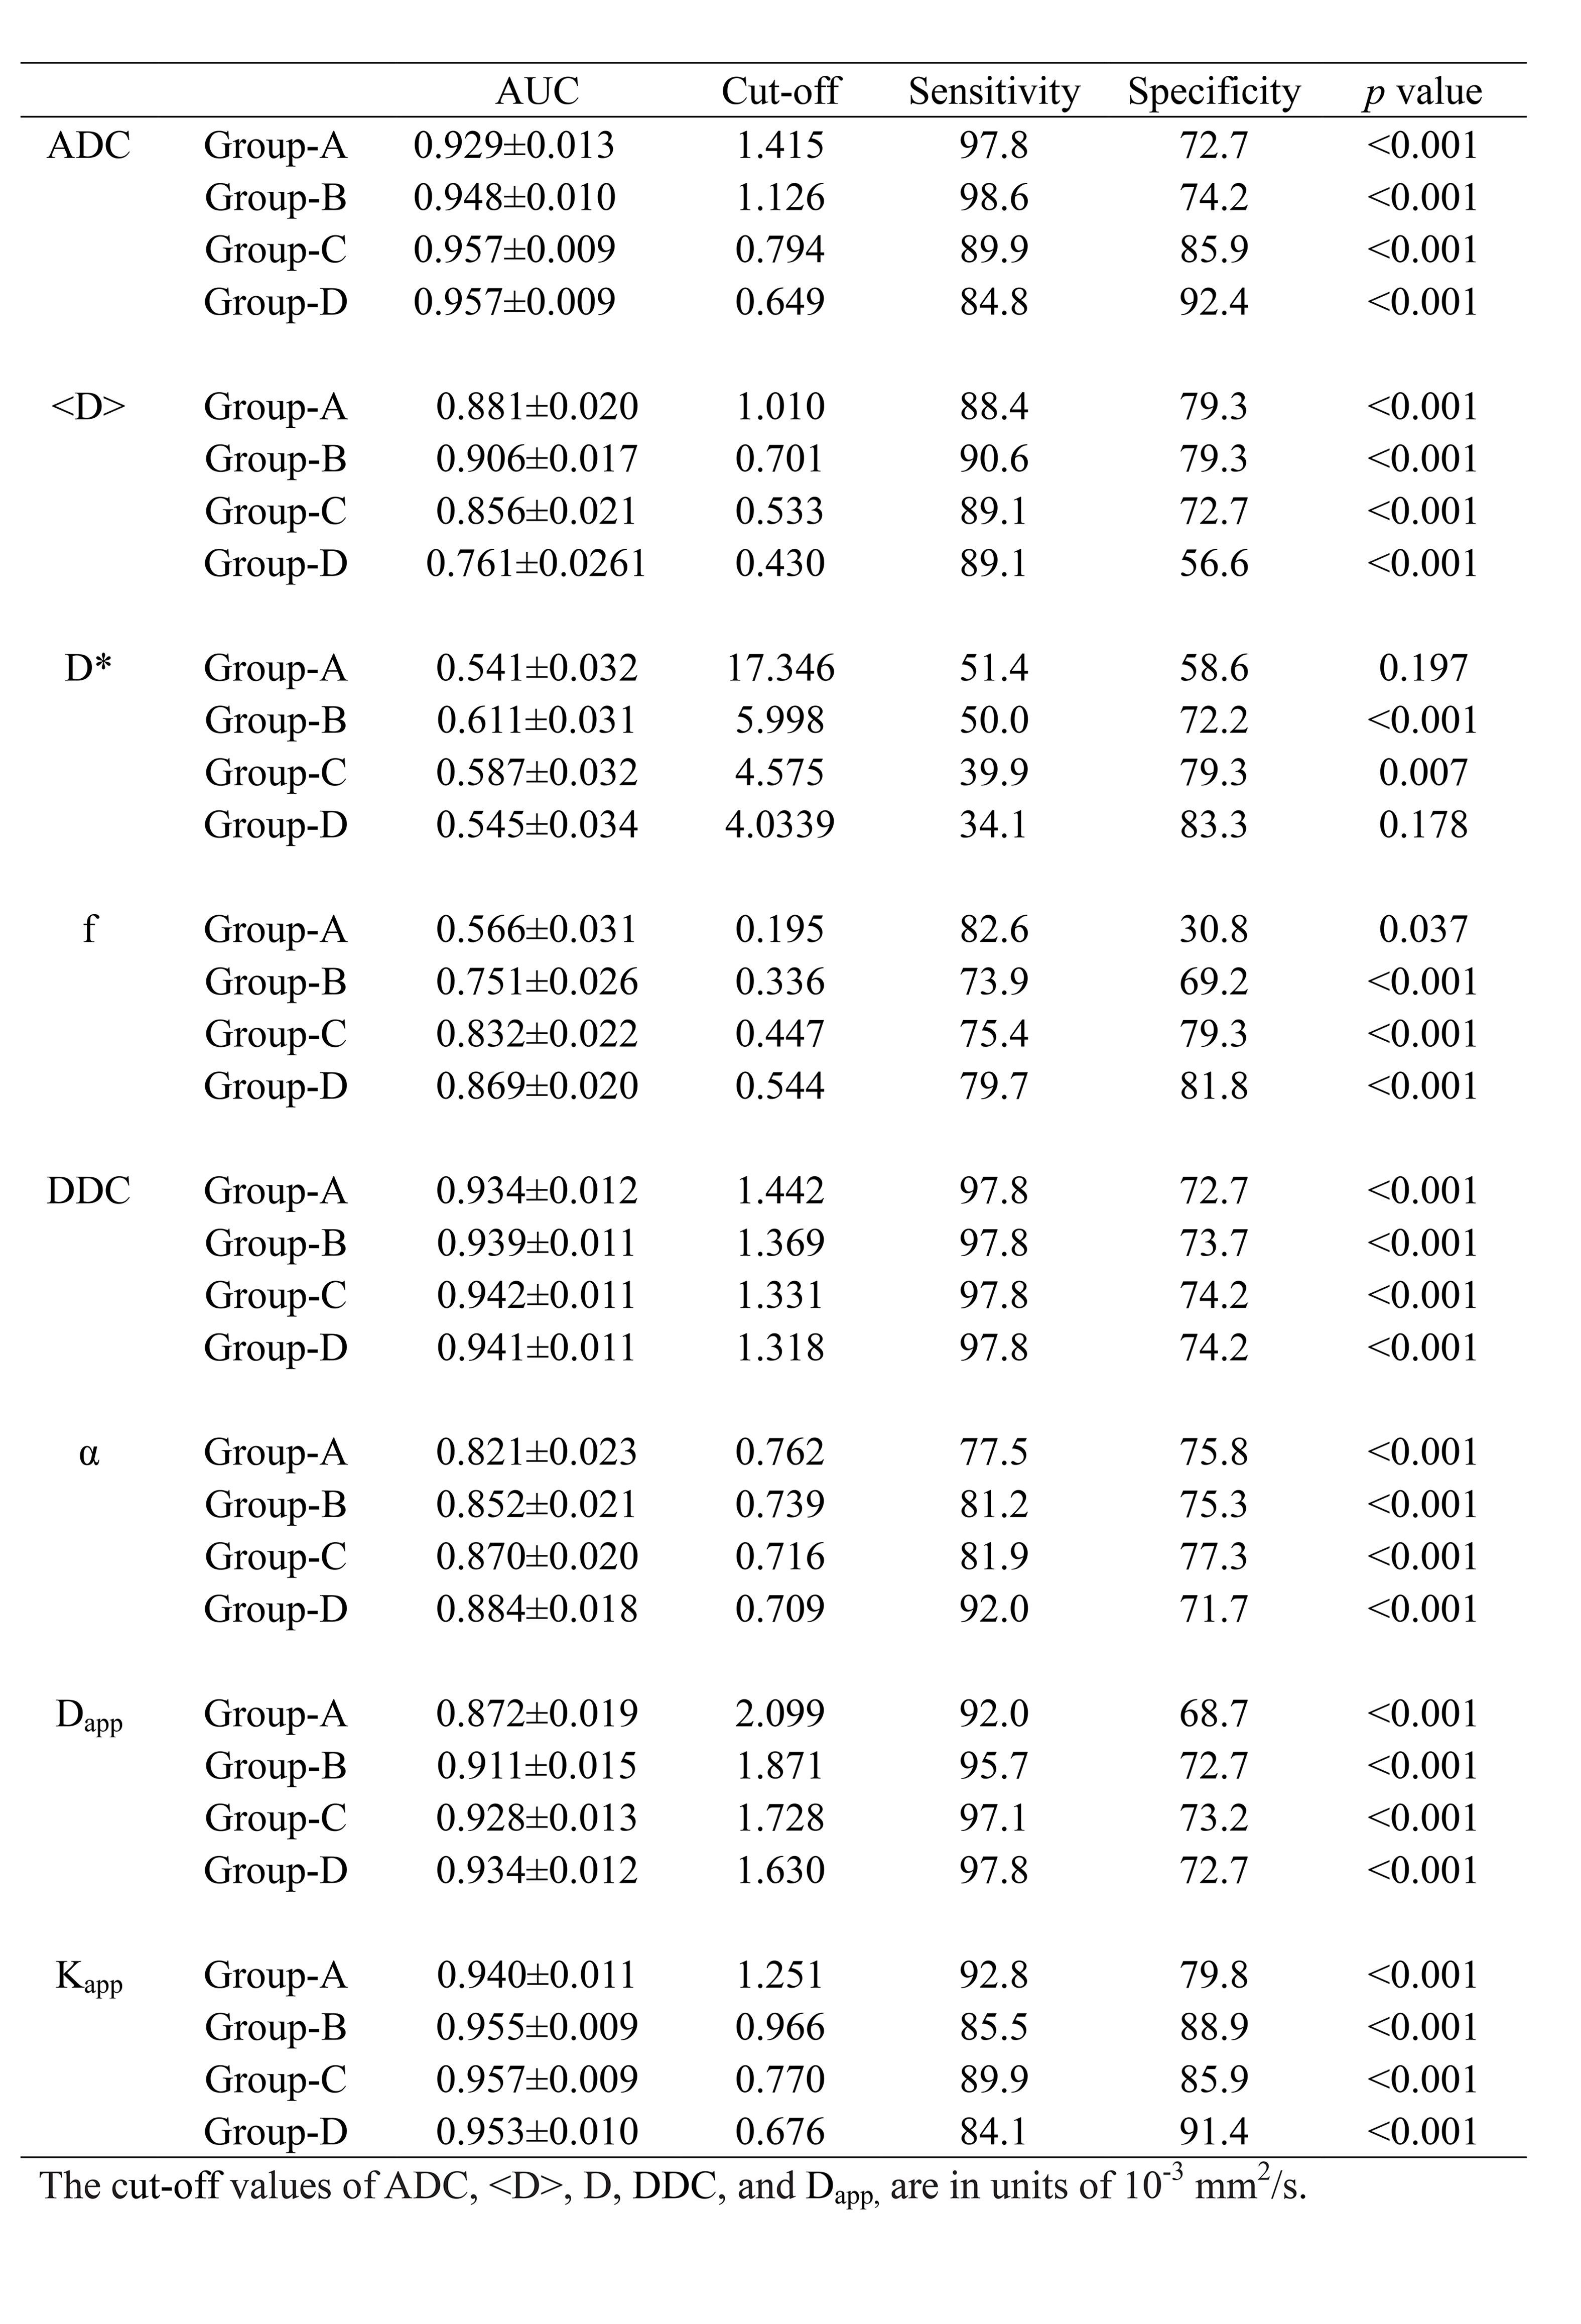
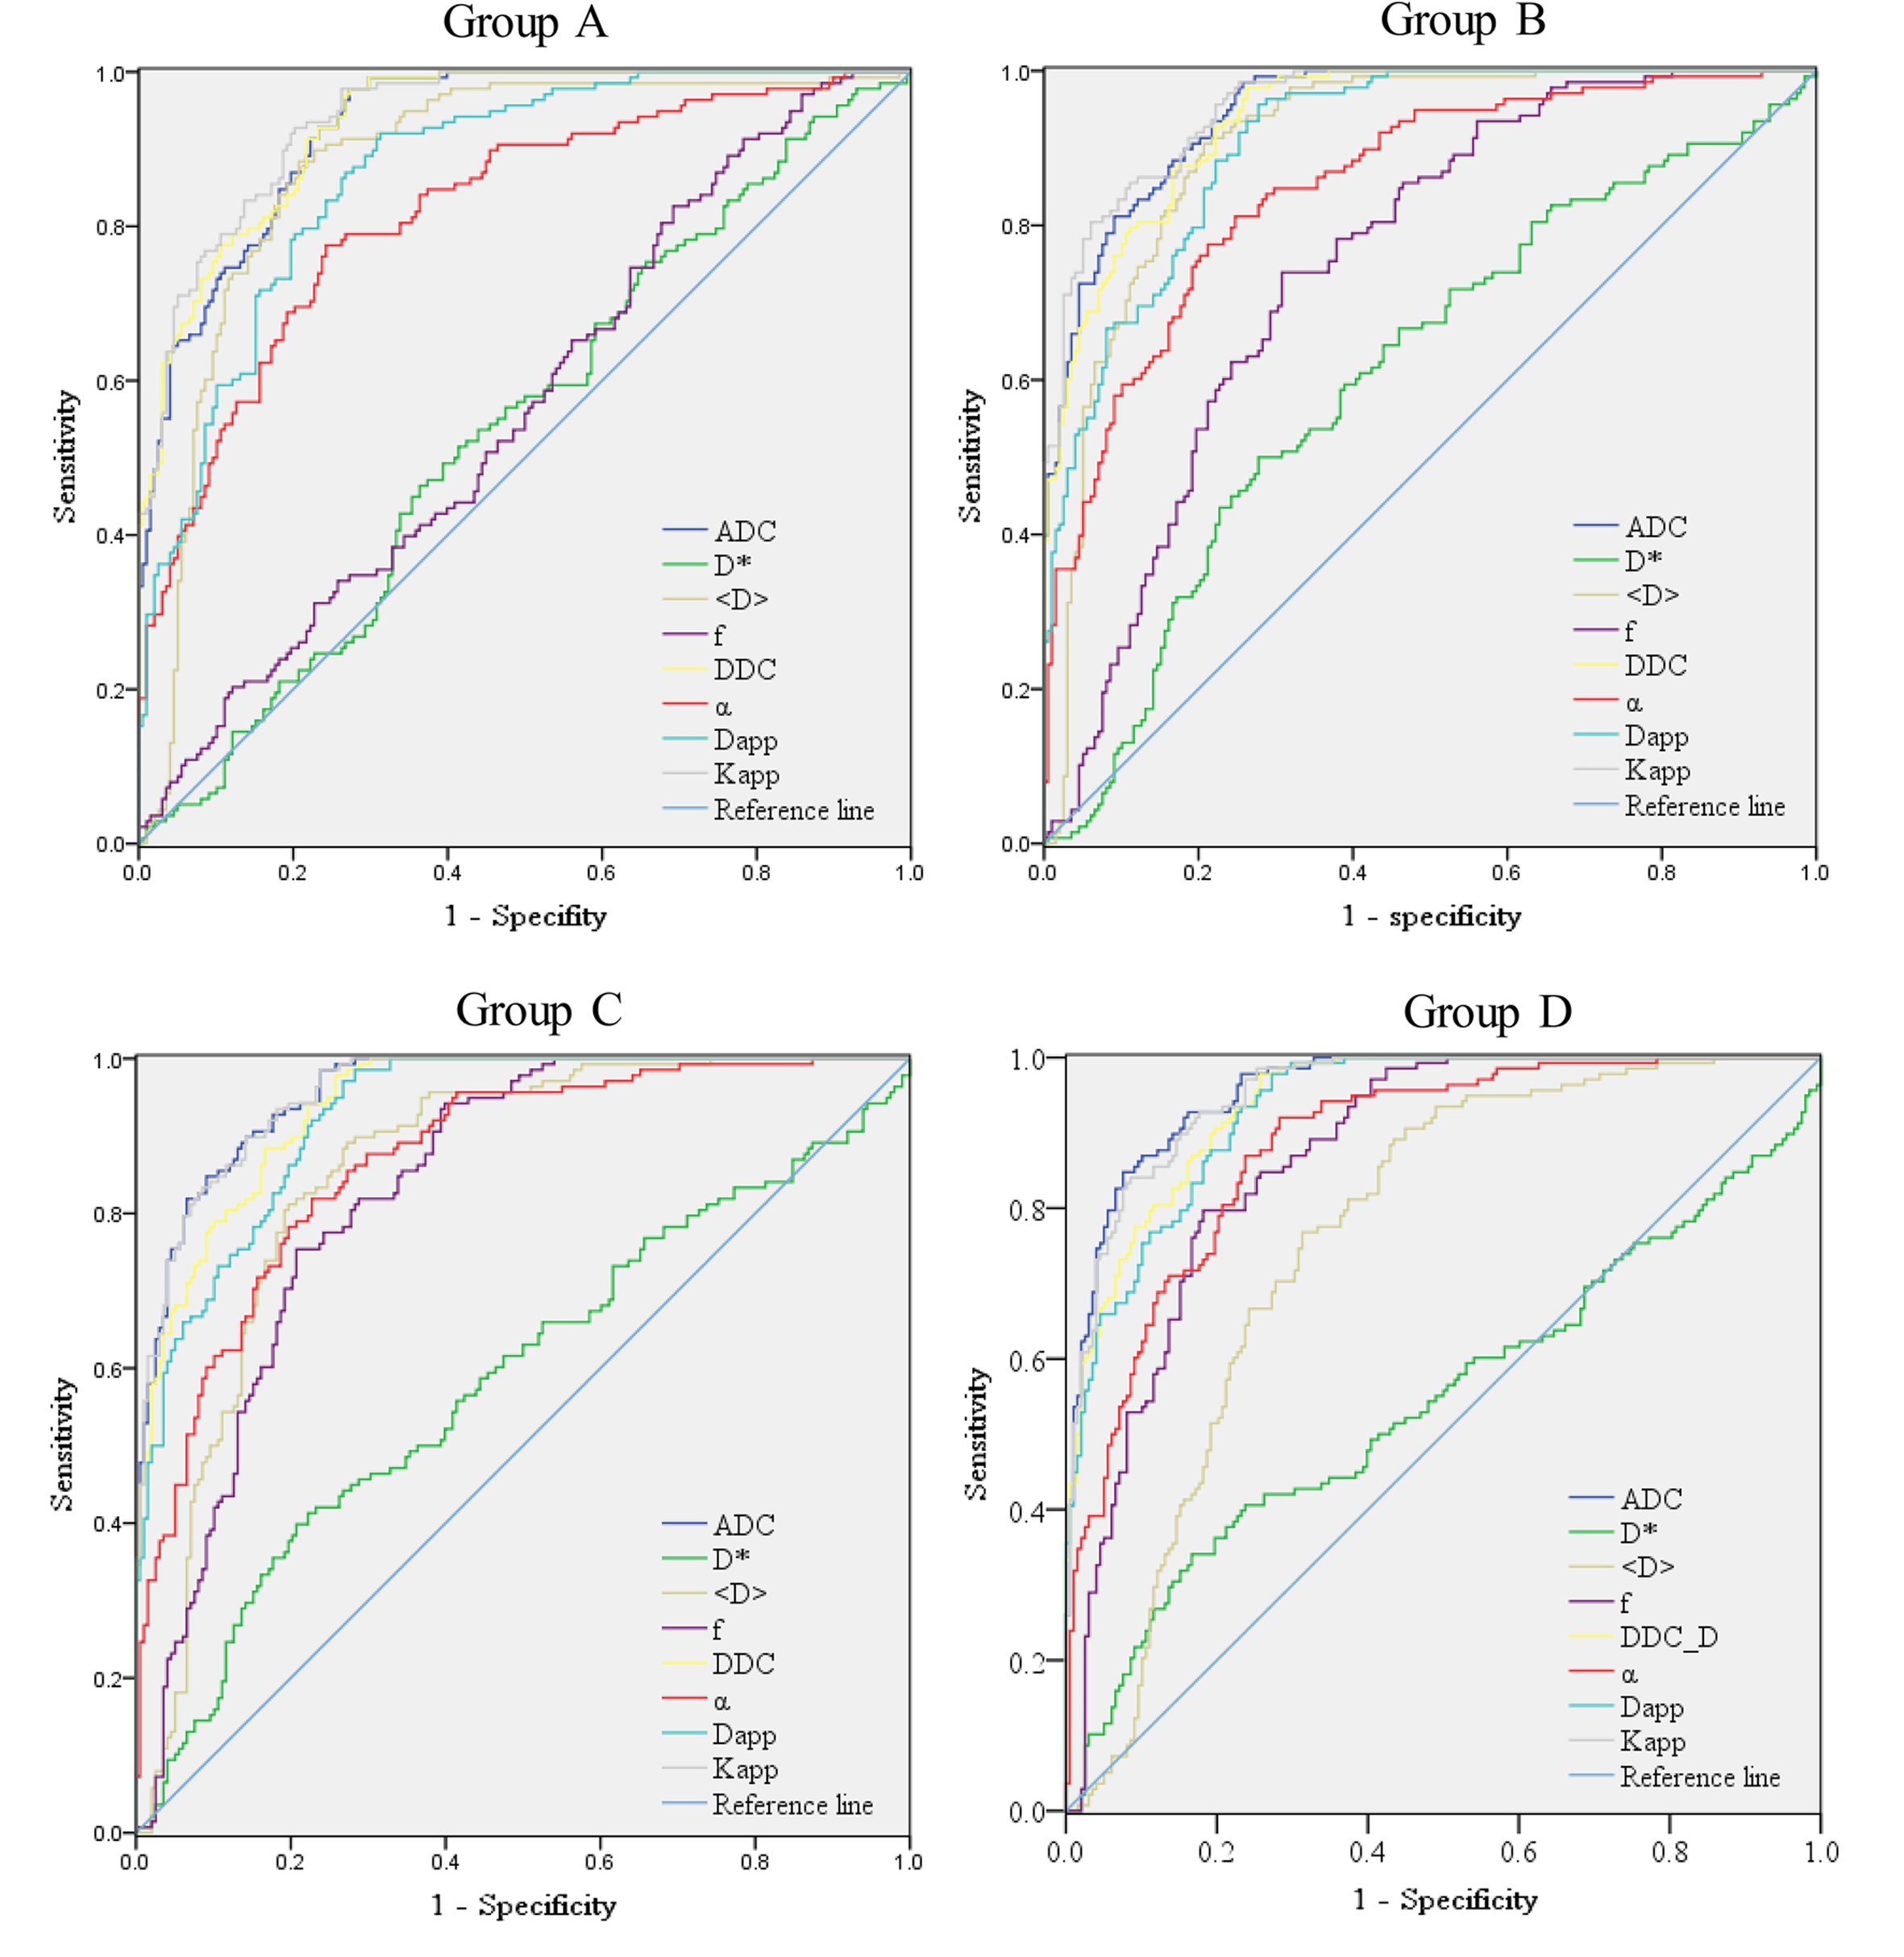
The AUC, cutoff, sensitivity, and specificity of the parameters in distinguishing cancerous tissues from benign PZs are reported in Table 2. The ROC curves of each parameter calculated using different b-value ranges are shown in Fig 1. In group A, the AUC of Kapp had the largest AUC (0.940), but the AUCs of ADC and Kapp were not significantly different (p = 0.070). In groups B and C, the AUCs of ADC and Kapp were comparable and significantly higher than those of the other parameters. In group D, The AUCs of ADC were slightly higher than those of Kapp (0.957 vs 0.953, p = 0.002), and both were significantly higher than those of other parameters (p < 0.001 for all).
The parameters ADC, <D>, DDC and Kapp provided the highest AUCs among the four models. The AUCs of ADC in groups C and D were comparable (p = 0.980) and were significantly higher than that of groups A and B (p < 0.05 for all). The AUCs of Kapp calculated using groups B, C, D were significantly higher than in group A (p < 0.05 for all), however, no significant difference was observed among groups B, C, or D (p > 0.05 for all). The AUCs of <D> calculated in groups A, B, and C were significantly higher than in group D (p < 0.001 for all). The AUCs of DDC calculated using groups B and D were significantly higher than in group A (p = 0.016 and p = 0.014, respectively).
Discussion/Conclusion
The result showed that mono-exponential and diffusion kurtosis models showed higher AUCs than bi-exponential and stretched exponential models for assessment of peripheral prostate cancer. The diagnostic performance of DDC and Kapp calculated using b-values up to 2000 s/mm2 outperformed those calculated using b-values up to a maximum of 1000 s/mm2 for PCa detection; higher b-values above those achieved with a maximum of 2000 s/mm2 provided no extra diagnostic value. Therefore, maximum b-values of approximately 2000 may be appropriate for prostate stretched-exponential and diffusion kurtosis model imaging. In contrast to DDC and Kapp, the diagnostic value of ADC calculated using maximum b-values of 3200s/mm2 is superior to that derived using maximum b-values of 2000 s/mm2 and 1000 s/mm2. The increased maximum b-values provide greater contrast between cancerous tissue and non-cancerous tissue, adding to the diagnostic performance. In conclusion, for PZ PCa detection, the parameters derived for the bi-exponential, stretched-exponential, and kurtosis models did not reveal significantly superior diagnostic performance relative to conventional ADC. ADC derived from conventional mono-exponential high b-value (about 3200 s/mm2) models is an optional parameter for PZ PCa detection.Acknowledgements
No acknowledgement found.References
1. Roethke MC, Kuder TA, Kuru TH, et al. Evaluation of Diffusion Kurtosis Imaging Versus Standard Diffusion Imaging for Detection and Grading of Peripheral Zone Prostate Cancer. Invest Radiol 2015;50(8):483-489.
2. Bai Y, Lin Y, Tian J, et al. Grading of Gliomas by Using Monoexponential, Biexponential, and Stretched Exponential Diffusion-weighted MR Imaging and Diffusion Kurtosis MR Imaging. Radiology 2016;278(2):496-504.
Figures