3412
Multiparametric MRI-Defined Prostate Cancer Includes Heterogeneous Pathologies1Department of Radiology, Changhai Hospital, Shanghai, China, shanghai, People's Republic of China, 2Chemistry, Department of Chemistry, Washington University, St. Louis, MO, United States, 3Department of Biology, Washington University, St. Louis, MO, United States, 4Department of Radiology, Washington University, St. Louis, MO, United States, 5Department of Biomedical Engineering, Washington University, St. Louis, MO, United States, 6Department of Urology, Changhai Hospital, Shanghai, China
Synopsis
Due to the overlapping apparent diffusion coefficient of prostate cancer (PCa), inflammation, and benign prostatic hyperplasia (BPH), mpMRI commonly results in false-positive PCa diagnosis. Based on the histology of whole mount section from prostatectomy, heterogeneous pathologies was clearly seen in the mpMRI-defined cancer region. Our recently-developed diffusion MRI histology (D-Histo) approach successfully differentiated and quantified PCa, inflammation and BPH. We report mpMRI and D-Histo results on 178 PCa-suspicious patients to demonstrate the causes of mpMRI false-positive PCa diagnosis.
Introduction
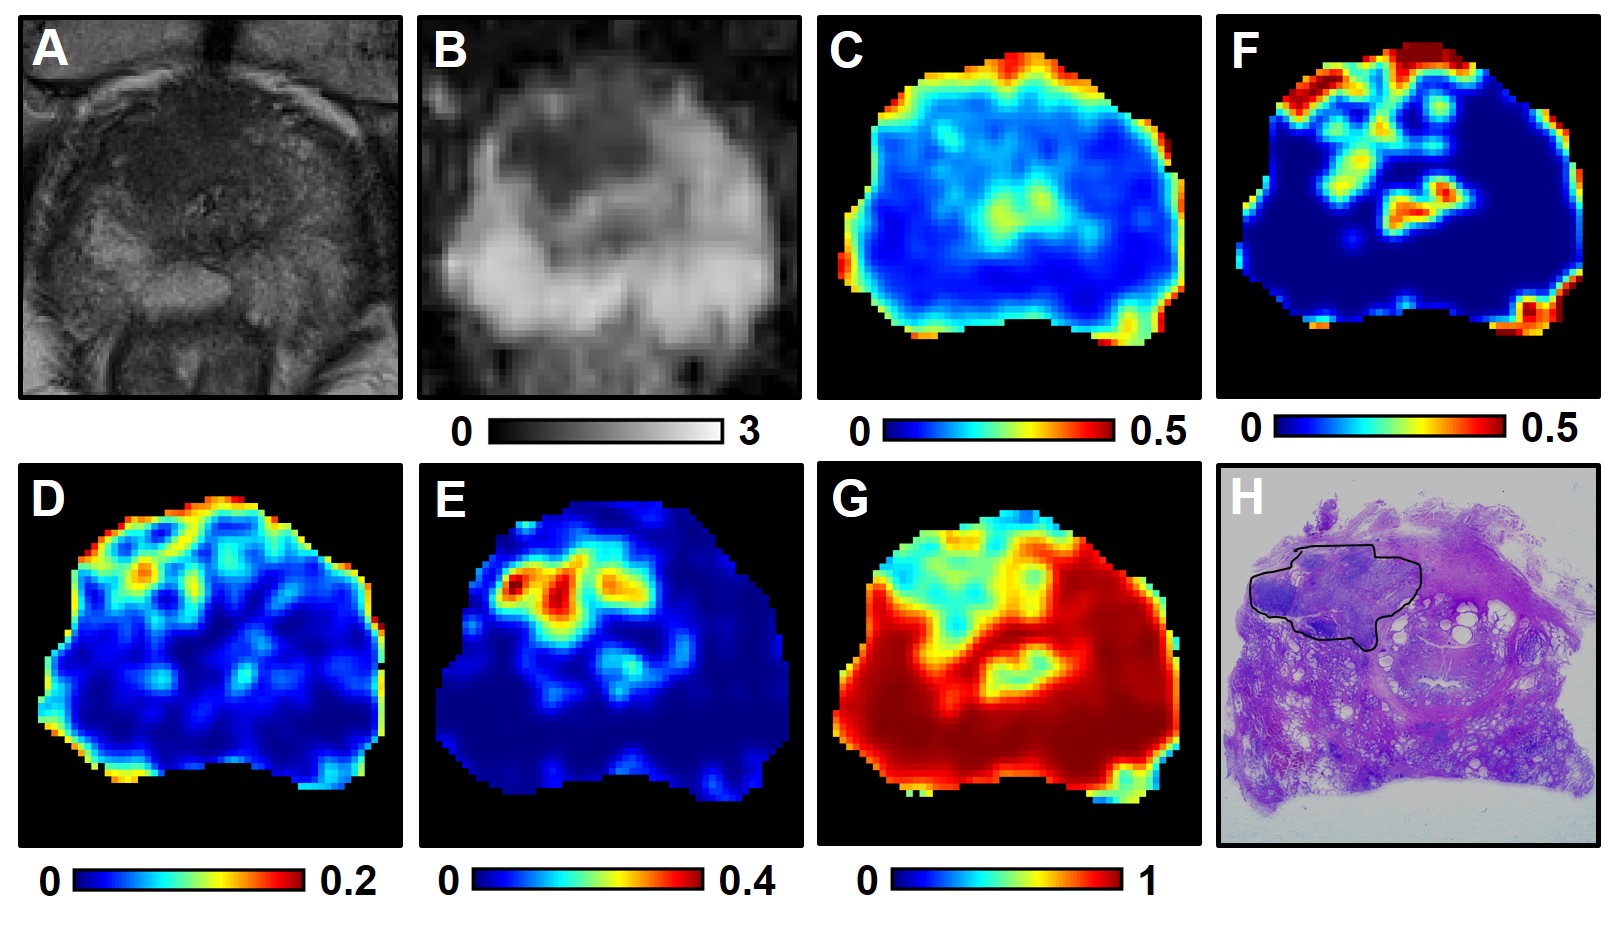
Multiparametric MRI (mpMRI) have become the standard tool to diagnose prostate cancer (PCa). However, mpMRI suffers from high false-positive rate,1primarily due to overlapping apparent diffusion coefficient (ADC) of PCa, inflammation, and benign prostatic hyperplasia (BPH). We examined the heterogeneous pathologies within mpMRI-determined PCa region using a recently developed Diffusion MRI Histology (D-Histo) method, i.e.,a modification of diffusion basis spectrum imaging (DBSI).2-4 Specifically, D-Histo models diffusion-weighted MRI signals of prostate as an anisotropic diffusion tensor reflecting stromal tissue (Fig. 1F),and a spectrum of isotropic diffusion tensors of highly-restricted (modeling prostatitis, Fig. 1D), restricted (modeling PCa, Fig. 1E) and non-restricted (normal prostate, Fig. 1G) isotropic diffusion tensors, respectively.Method and materials
Patients: One-hundred and seventy-eightpatients with clinical suspicion for prostate cancer (PSA> 4 ng/ml) were recruited for this study. The study was approved by the local Institutional Review Board. MRI: In vivo DWI data was obtained on a Siemens 3T Skyra scanner (Erlangen, Germany) with an 18-channel phased-array body receive coil in Changhai Hospital, Shanghai, China. The imaging parameters were: TR 5000 ms, TE 88 ms, 4 averages, FOV 112 x 140 mm2, in-plane resolution 2 x 2 mm2, 24 slices at 4-mm thick, 25-dir icosahedral diffusion encoding scheme with maximum b-value 1500 s/mm2. Standard mpMRI were obtained in all patients. Image analysis: DWI data were analyzed with D-Histo and conventional DTI analysis using an in-house Matlabsoftware. PCa foci, stromal BPH, epithelial BPH and benign peripheral zone tissue were identifiedby an experienced radiologist based on mpMRI and applied to DTI and D-Histo metrics maps.Results and discussions
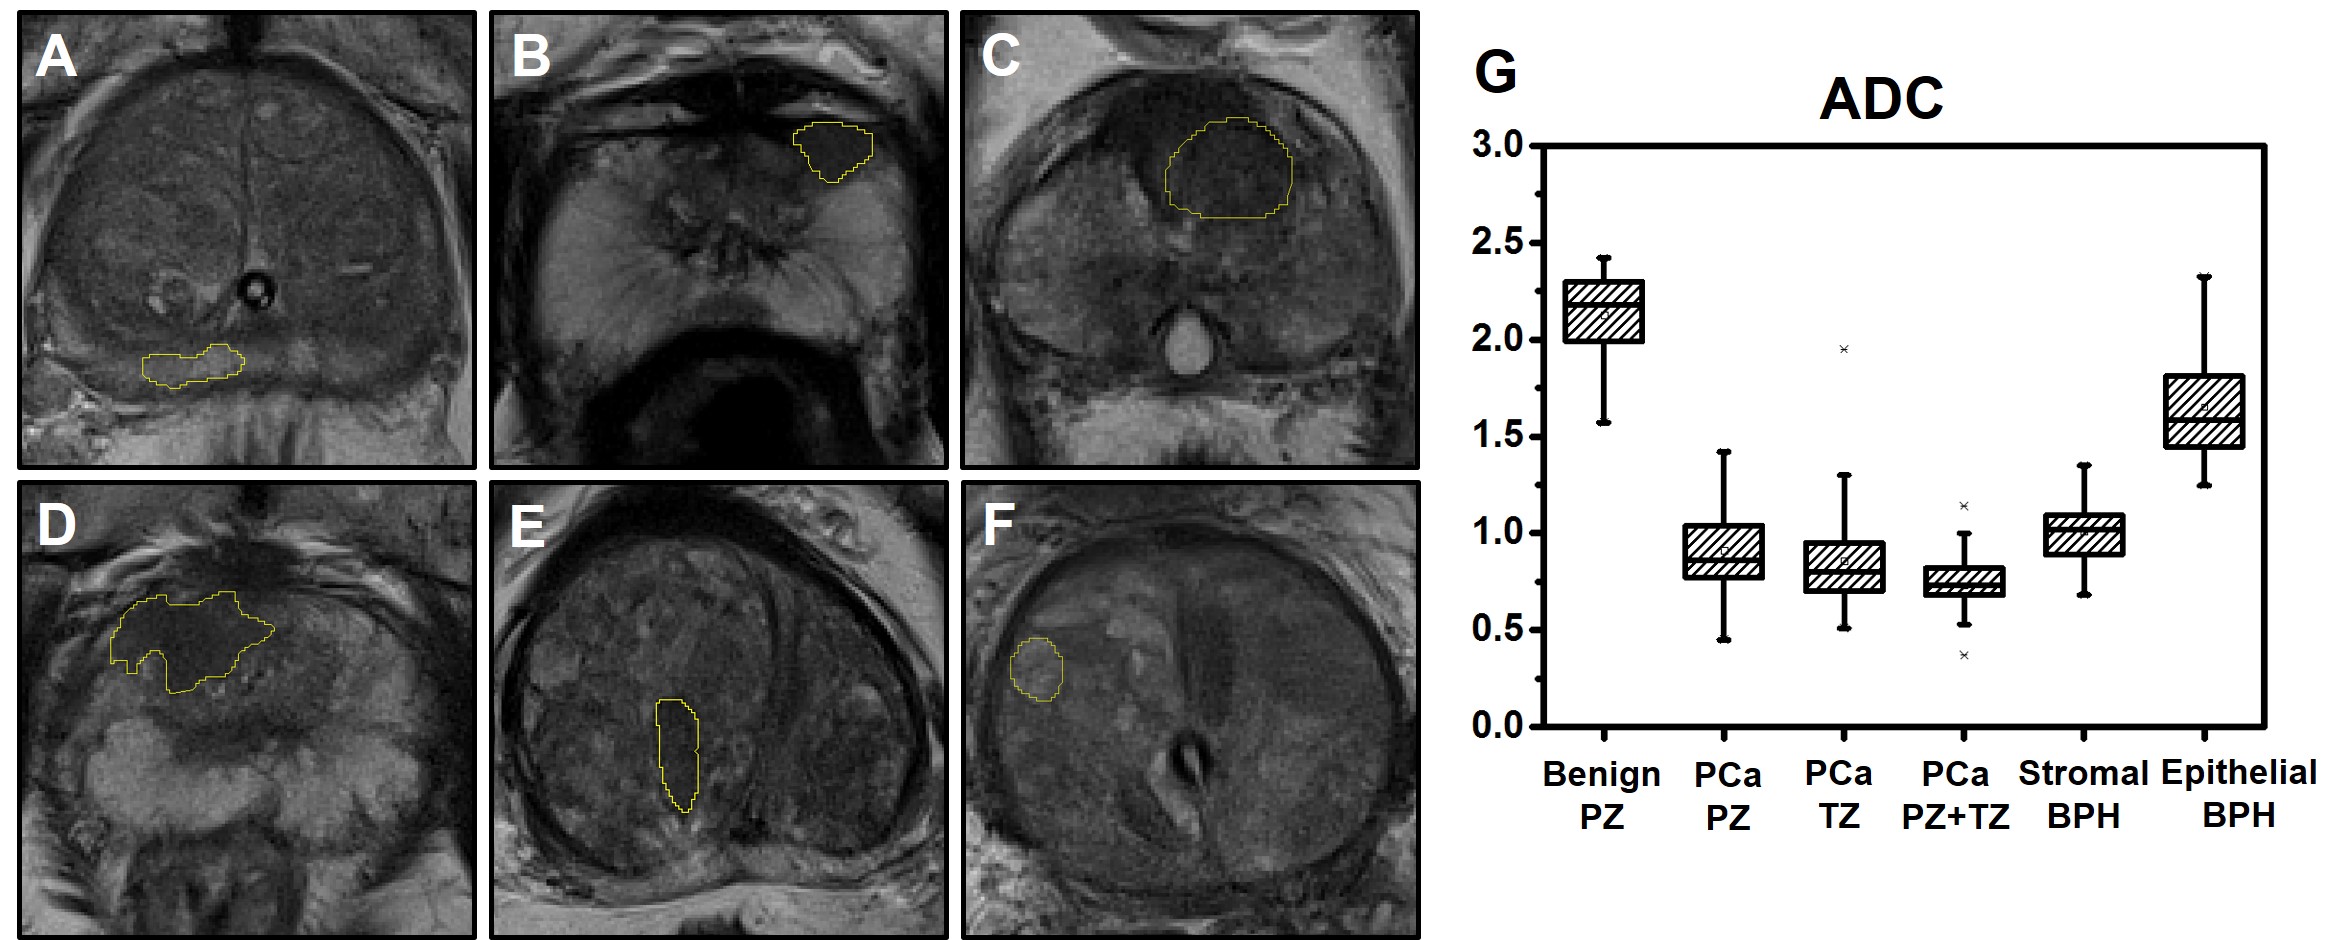
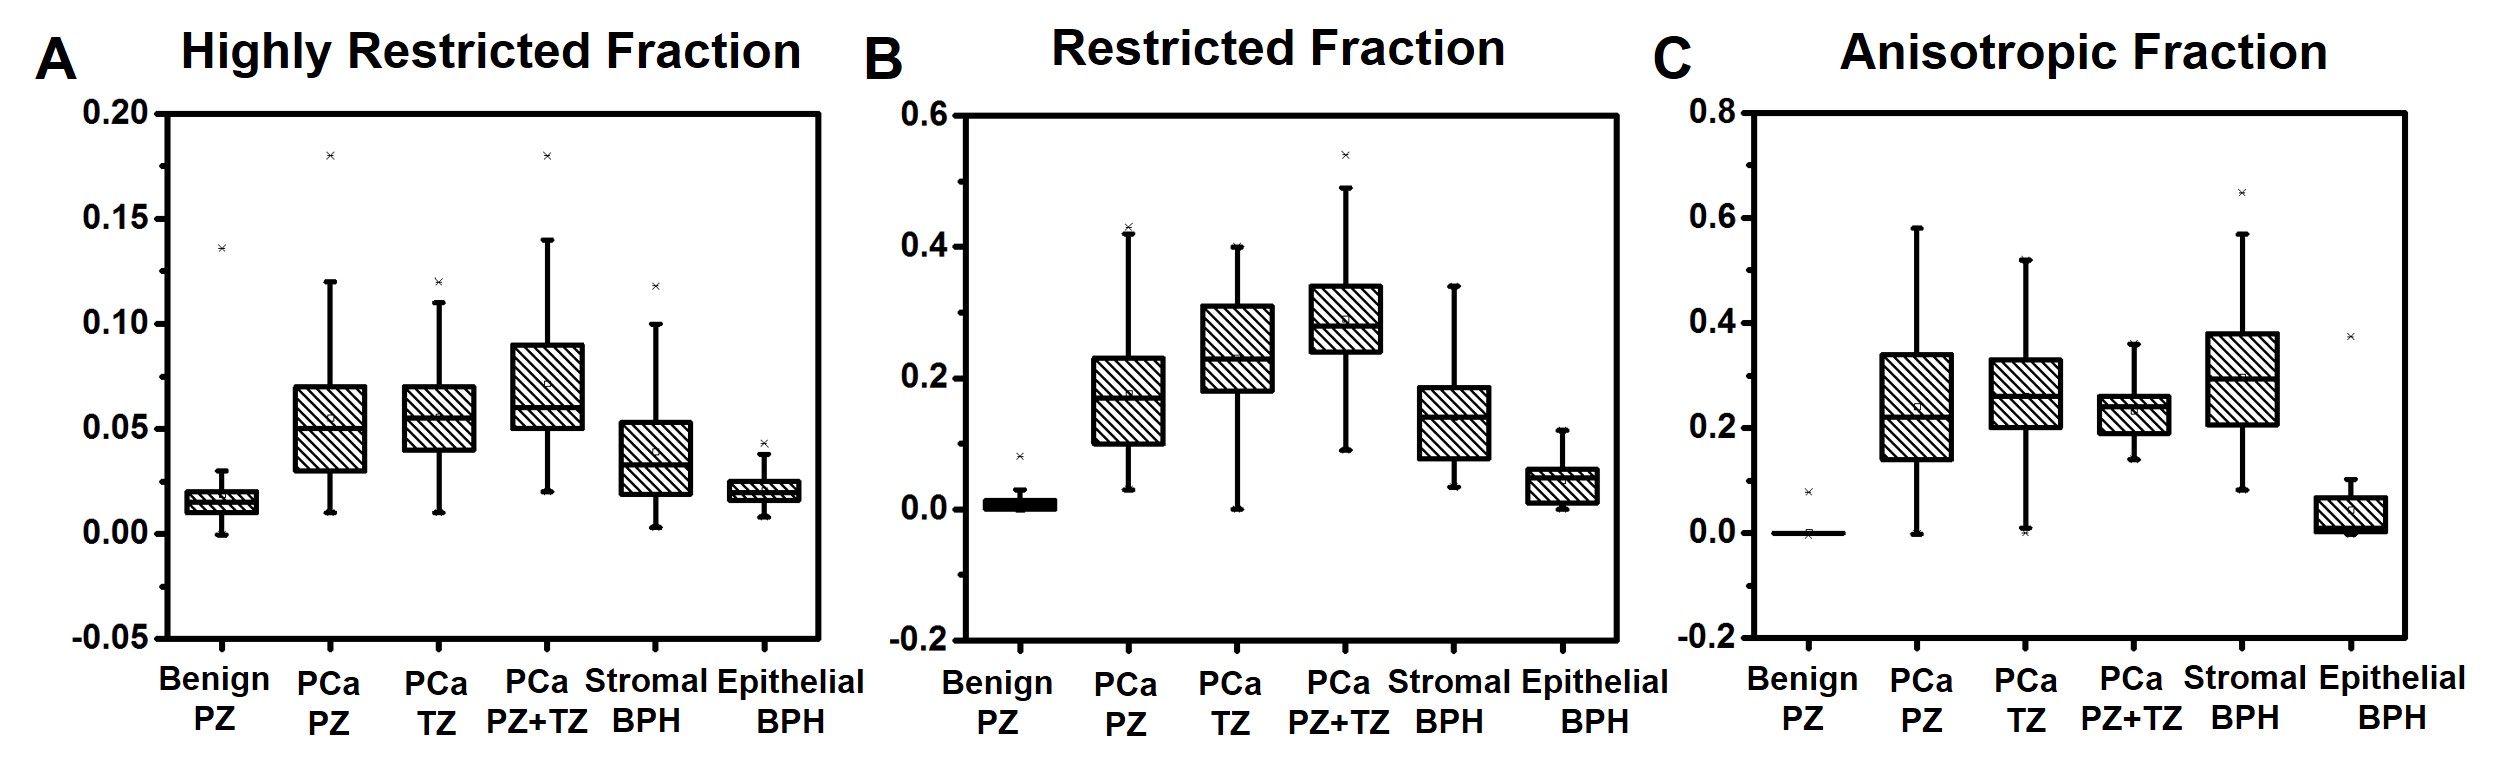
104 out of 178 patients with positive mpMRI finding or PSA > 10 ng/ml were scheduled for biopsy. 74 patients were considered as non-cancerous by negative mpMRI and PSA < 10 ng/ml. 56 of the 104 biopsy patients were PCa-positive and 48 were negative. Among the PCa negative patients, all were BPH-positive while 50% were both BPH and prostatitis positive. This suggests BPH and/or prostatitis could lead to false-positive PCa diagnosisby mpMRI. We identified 222 tumor foci from the 56 biopsy proven PCa patients at various locations within the prostate gland: 89 at peripheral zone (PCaPZ),66 at transition zone (PCaTZ) and 67 at both peripheral and transition zone (PCaPZ + TZ). We then identified39 stromal BPH regions, 34 epithelial BPH and 59 benign peripheral zone tissues from thosebiopsy-negative patients. The ADC values of PCa PZ (0.94± 0.23 mm2/ms), PCaTZ (0.83± 0.18mm2/ms) and PCaPZ+TZ (0.73 ± 0.14 mm2/ms) were significantly lower (p < 0.0001) than the ADC values of benign peripheral zone tissue (2.13 ± 0.20 mm2/ms) and epithelial BPH (1.65 ± 0.25 mm2/ms). The ADC value of stromal BPH (1.01 ± 0.14 mm2/ms) was not different from that of PCa PZ tissue (0.94± 0.23 mm2/ms). This could contribute to the false-positive PCa diagnosis by mpMRI, ~46% in the current study. Despite the high rate of false-positive PCa detection, mpMRI identified PCa regions should still contain high extent of tumor in biopsy-positive patients. Thus, we examined the putative D-Histo PCa marker, the restricted isotropic diffusion fraction,in PCa PZ (0.18 ± 0.10), PCa TZ (0.23 ± 0.09) and PCa PZ+TZ tissue (0.29 ± 0.09) comparing with thoseof PZ benign tissue (0.01 ± 0.02), epithelial BPH (0.04 ± 0.03) and stromal BPH (0.14 ± 0.07). Indeed, mpMRI identified PCa region exhibits higher restricted-isotropic-diffusion fraction in the biopsy-positive PCa patients. Stromal BPH is commonly seen in the vicinity of PCa. We also examined the extent of anisotropic diffusion fraction in PCa regions (PZ, 0.23 ± 0.14; TZ, 0.26 ± 0.10; PZ + TZ, 0.23 ± 0.05) and stromal BPH (0.30 ± 0.13) from non-PCa subjects. Results showed that anisotropic fraction in these tissues was higher than that of benign PZ tissue (0 ± 0.01). For highly-restricted isotropic diffusion fraction (putative inflammation marker), PCa tissues (PZ, 0.06 ± 0.02; TZ, 0.06 ± 0.03; PZ+TZ, 0.07 ± 0.03) and stromal BPH (0.04 ± 0.03) all exhibited higher content than benign PZ tissue (0.02 ± 0.02). The mpMRI-based PCa regions contain all three D-Histo classifications: PCa (restricted diffusion), inflammation (highly-restricted diffusion), and stroma (anisotropic diffusion). In contrast, mpMRI identified benign prostate was free from these complications. D-Histo results demonstrated the underpinning of false-positive PCa diagnosis using mpMRI.Conclusion
Our results support that underlying prostate pathologies, including BPH and inflammation, contribute to mpMRI false-positive identification of PCa. If quantitatively validated, D-Histo-derived restricted fraction could distinguish PCa from benign tissue, epithelial and stromal BPH, and inflammation to improve PCa detection.Acknowledgements
No acknowledgement found.References
1.Mertan FV, Greer MD, Shih JH, et al. Prospective Evaluation of the Prostate Imaging Reporting and Data System Version 2 for Prostate Cancer Detection. The Journal of urology. Sep 2016;196(3):690-696.
2.Chiang CW, Wang Y, Sun P, et al. Quantifying white matter tract diffusion parameters in the presence of increased extra-fiber cellularity and vasogenic edema. NeuroImage. Nov 1 2014;101:310-319.
3.Wang Y, Sun P, Wang Q, et al. Differentiation and quantification of inflammation, demyelination and axon injury or loss in multiple sclerosis. Brain : a journal of neurology. May 2015;138(Pt 5):1223-1238.
4.Wang Y, Wang Q, Haldar JP, et al. Quantification of increased cellularity during inflammatory demyelination. Brain : a journal of neurology. Dec 2011;134(Pt 12):3590-3601.
Figures