3409
Optimization of Intravoxel Incoherent Motion Measurement in Diffusion-Weighted Imaging of Breast Cancer1Biomedical Engineering, China Jiliang University, Hangzhou, People's Republic of China, 2Radiology, Zhejiang Cancer Hospital, Hangzhou, People's Republic of China, 3Radiology, Beijing Friendship Hospital, Beijing, People's Republic of China
Synopsis
The purpose was to use intra-voxel incoherent motion (IVIM) measurement in DWI to distinguish benign from malignant breast tissues. IVIM-derived parameter maps D, f, and D* were computed using segmented fitting method with proper threshold b-value. The region of interests were avoided the area of calcification. With pathological diagnosis as the gold standard, receiver operating characteristic (ROC) curves for three parameters and f × D* reflect that the area under the curve (AUC) of D and f × D* are 0.862 and 0.726, respectively. It suggested that these two parameters have high significance for the diagnosis of breast cancer lesions.
Purpose
The purpose of this study was to use the optimal threshold b-value, which the diffusion and perfusion parameters of breast tissues calculated from intra-voxel incoherent motion (IVIM) measurement in diffusion-weighted imaging (DWI) could be accurately assessed, thus benign and malignant breast tissues can be accurately differentiated.Materials and Methods
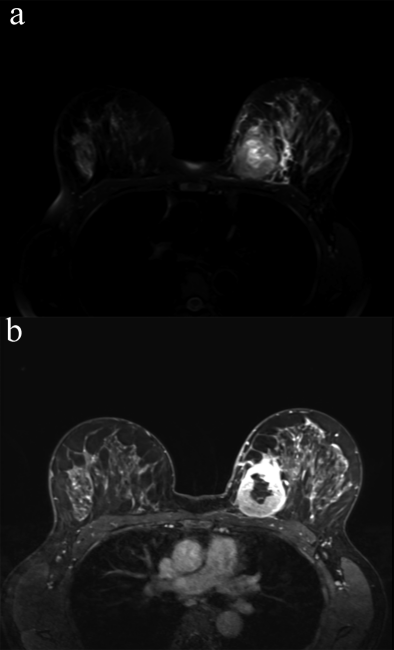
64 patients, with biopsy-confirmed breast cancers, were studied with a 3T MRI (Magnetom Verio, Siemens, Erlangen, Germany) scanner, using T1-weighted dynamic contrast-enhanced MRI images, and diffusion-weighted images with nine b-values, (0, 50, 100, 150, 200, 300, 400, 800, 1000 s/mm2). IVIM-derived parameter maps for tissue diffusion coefficients D, perfusion fraction f, and pseudo-diffusion coefficients D* were computed using segmented fitting method with optimized threshold b-value in different breast lesions. Parameter maps were obtained in MATLAB program (Mathworks, Natick, MA). Since perfusion contribution is negligible in high b-values DWI measurements, D maps were firstly computed with the polynomial fitting method using Eqn. [1]$$$ http://www.HostMath.com/Show.aspx?Code=%5Cfrac%7BS%5Cleft(b%5Cright)%7D%7BS_%7B0%7D%7D%3D%5Cexp%5Cleft(-b%5Ctimes%20D%5Cright)$$$ from the DWI images acquired with higher b-values (b ≥ 300s/mm2), then the perfusion fraction (f) was calculated using Eqn. [2] $$$http://www.HostMath.com/Show.aspx?Code=f%3D%5Cfrac%7BS_%7B0%7D-S_%7Bint%7D%7D%7BS_%7B0%7D%7D$$$, where Sint denotes the intercept pixel signal intensity when b-value extrapolates to 0 from the fitting curves. D* was calculated by the bi-exponential model Eqn. [3] $$$http://www.HostMath.com/Show.aspx?Code=%5Cfrac%7BS%5Cleft(b%5Cright)%7D%7BS_%7B0%7D%7D%3Df%5Ctimes%5Cexp%5Cleft(-b%5Ctimes%20D%5E%7B*%7D%20%5Cright)%2B%5Cleft(1-f%5Cright)%5Ctimes%20%5Cexp%5Cleft(-b%5Ctimes%20D%5Cright)$$$, which was originally described by Le Bihan et al. The region of interest (ROI) from the lesions were drawn on the D map, which the slices contain the maximum lesion areas, and then the calculated IVIM derived parameters f and D* maps were in the same ROI. In this way, the accuracy and precision of the breast leisons IVIM analysis could be ensured. Besides, 10 of the malignant intralesions were contained calcification or necrosis, thus the ROI were avoided the area of them. Mann-Whitney test (independent samples) was used for D, f, D* parameters in malignant and benign lesions. With pathological diagnosis as the gold standard, receiver operating characteristic (ROC) curves were generated to evaluate the performance of IVIM-DWI parameters for differentiating between the benign and the malignant breast lesions. The statistical analysis computations were carried out using MedCalc (Mariakerke, Belgium) software.Results
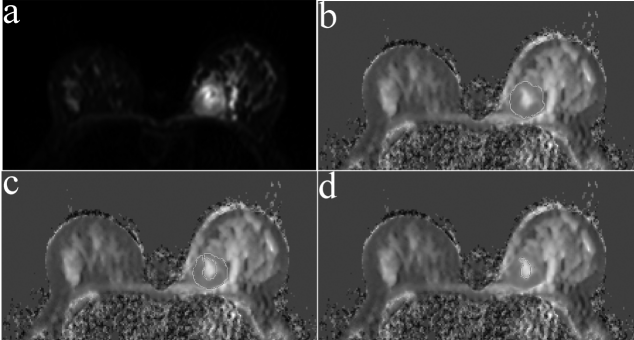
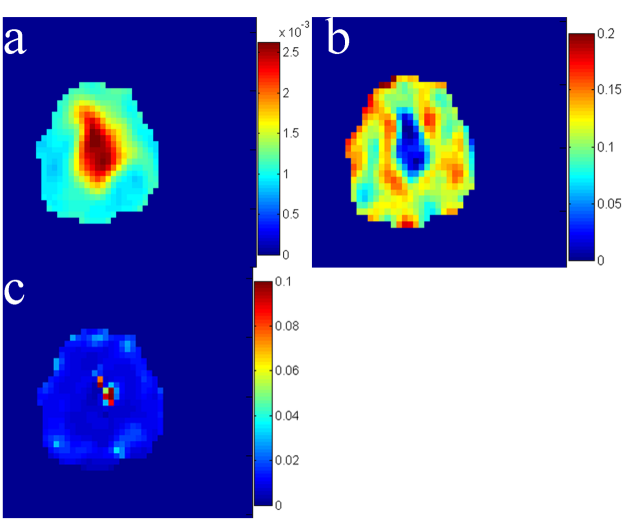
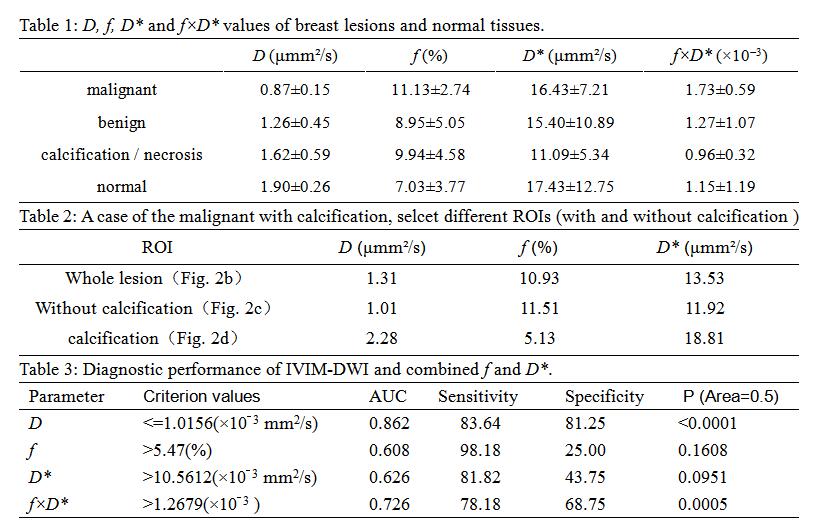
The mean value and standard deviation for IVIM parameters D, f, D* are in Table 1, for malignant, benign, normal, calcification (intralesions of some malignant). The D parameter of breast tissue in malignant is lowest. The calcification and necrosis tissue can influence the parameters accuracy. Table 2 shows a case of the malignant with calcification, selcet different ROIs (include calcification or not) will influence the result. Figure 1 and 2 exhibit the ROIs of them. Figure 3 showed the IVIM parameters. Table 3 shows ROC curves for three parameters and f × D*, it reflects the variables sensitivity and specificity. The area under the curve (AUC) of D and f × D* are 0.862 and 0.726, respectively. It suggested that these two parameters have statistical significance.Discussion
In the IVIM-DWI model, tissue diffusion (D) and pseudo-diffusion coefficients (D*) are separated through biexponential analysis 1, 2. Using the Mann-Whitney test and ROC curves, D values showed high diagnostic performance for lesion differentiation, and in optimal criterion values, the sensitivity and specificity are 83.64% and 81.25%, respectively. This result is consistnet with reports by other studies3, 4. However, the f value was not the same, Takayuki5 suggested that IVIM parameters may reflect the character of the underlying tumor celluarity, but their use is still limited in distinguishing malignant tumors from benign lesions because pathological diagnosis emphasizes cell configuration or shape rather than cellularity. Bokacheva, et al. indicated combination of D and f could improve ability of the imaging dignosis. In this study, the f × D* also has diagnostic capability with AUC=0.726(p=0.0005), the criterion values >1.2679(×10−3 ), sensitity and specificity are 78.18% and 68.75%. Figure 3 showed the calcification region of the malignant lesion was significantly different from the lesion around,it would be influence the accuracy of the parameters’ values, thus we selected the label area of Figure 2c as ROI of malignant.Conclusion
IVIM MRI and the combination of their parameters can be used as a valuable reference information for the diagnosis of breast cancer lesions.Acknowledgements
JMZ received research funding from Alltech Medical USA, and Visiting Professorship from the Provincial Government of Zhejiang, ChinaReferences
1 D. Le Bihan, E. Breton, D. Lallemand, M.L. Aubin, J. Vignaud, M. Laval-Jeantet, "Separation of diffusion and perfusion in intravoxel incoherent motion MR imaging," Radiology 168, 497-505 (1988).
2 D. Le Bihan, E. Breton, D. Lallemand, P. Grenier, E. Cabanis, M. Laval-Jeantet, "MR imaging of intravoxel incoherent motions: application to diffusion and perfusion in neurologic disorders," Radiology 161, 401-407 (1986).
3 G.Y. Cho, L. Moy, S.G. Kim, S.H. Baete, M. Moccaldi, J.S. Babb, D.K. Sodickson, E.E. Sigmund, "Evaluation of breast cancer using intravoxel incoherent motion (IVIM) histogram analysis: comparison with malignant status, histological subtype, and molecular prognostic factors," European radiology 26, 2547-2558 (2016).
4 L. Bokacheva, J.B. Kaplan, D.D. Giri, S. Patil, M. Gnanasigamani, C.G. Nyman, J.O. Deasy, E.A. Morris, S.B. Thakur, "Intravoxel incoherent motion diffusion-weighted MRI at 3.0 T differentiates malignant breast lesions from benign lesions and breast parenchyma," Journal of magnetic resonance imaging : JMRI 40, 813-823 (2014).
5 Takayuki Tamura, Shuji Usui, Shigeru Murakami, Y.A. Koji Arihiro, Kumiko Naito, a.M. Akiyama, "Biexponential Signal Attenuation Analysis of Diffusion-weighted Imaging of Breast," Magnetic resonance in medical sciences : MRMS : an official journal of Japan Society of Magnetic Resonance in Medicine 9, 2010).
Figures