3408
A multi-directional methodology for discriminating benign from malignant lesions on DWI for women with dense breasts1Alan Penn & Assoc., Inc., Rockville, MD, United States, 2Beth Israel Deaconess Medical Center, 3Radiology, Beth Israel Deaconess Medical Center, 4California Hospital Medical Center, 5University of Chicago, 6Radiology, University of Chicago
Synopsis
We describe a new methodology for discriminating benign from malignant breast lesions on DWI for women with dense breasts and show that the new methodology results in statistically significant improvement over standard ADC methods. The methodology uses computer models that can be constructed independently from the three directional DWI signals or from the trace signal. Preliminary results show improved discrimination is obtained using the multi-directional models when compared to using the trace. The methodology can be adapted for computer-aided-detection by tiling the image, independently marking each tile with areas of suspicion, and constructing a mosaic from the marked tiles.
Purpose
To evaluate discrimination of benign from malignant breast lesions on DWI for women with dense breasts using a new methodology that incorporates two innovations: augmenting diffusion images to improve lesion conspicuity and independently evaluating data from each of three DWI acquisition directions, and to compare discrimination obtained from new methodology to discrimination obtained using standard ADC methodsMethods
An ongoing prospective IRB-approved study evaluated 50 women with dense breasts (mean age 52.8) with 61 breast lesions: 31 cancer (mean 4.71cm2), 30 benign (mean 2.07cm2), imaged between November 2015 and September 2016, consisting of 47 masses, 12 non-mass enhancements, 2 negative on MRI. Imaging parameters: b‑values:0/800, TR: 10546-16960ms, TE: 63.87-80.08ms, Pixel size: 1.08-1.25mm, with 56 lesions imaged at 3.0T and 5 at 1.5T. No eligible cases were excluded. Baseline is mean ADC over ROI drawn by a radiologist. Each lesion was evaluated with a new feature using computer models as follows: (1) For each acquisition direction, a 3-dimensional model of the lesion was constructed from augmented images by cluster growing from the brightest pixel; augmentation was achieved by combining b0 and ADC images to increase lesion conspicuity, and a subROI was defined to be the intersection of the radiologist’s ROI and the model; (2) Pixels within the subROI were classified as positive when ADC values were below a preset threshold and negative when ADC values were above the threshold, and a directional feature was defined to be the fraction of pixels in the subROI that were positive; (3) A multi-directional feature was computed as the weighted average of the three directional features. Improvement in discrimination that was attributable to the use of computer models vis-à-vis independently evaluating directional data was assessed by analyzing a second, in-between, feature that used a single model constructed from trace data.Results
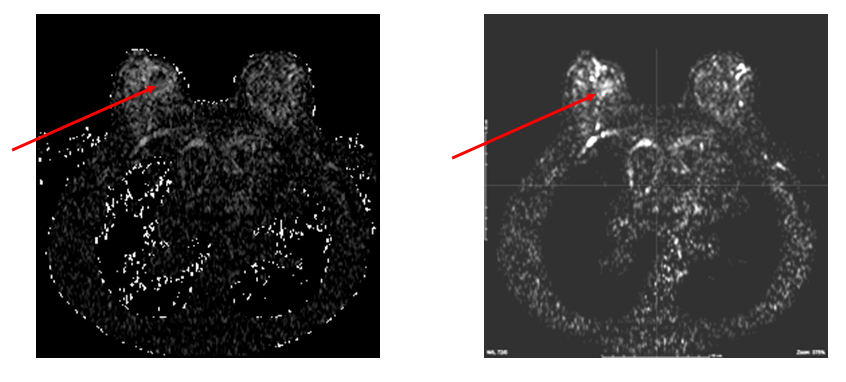
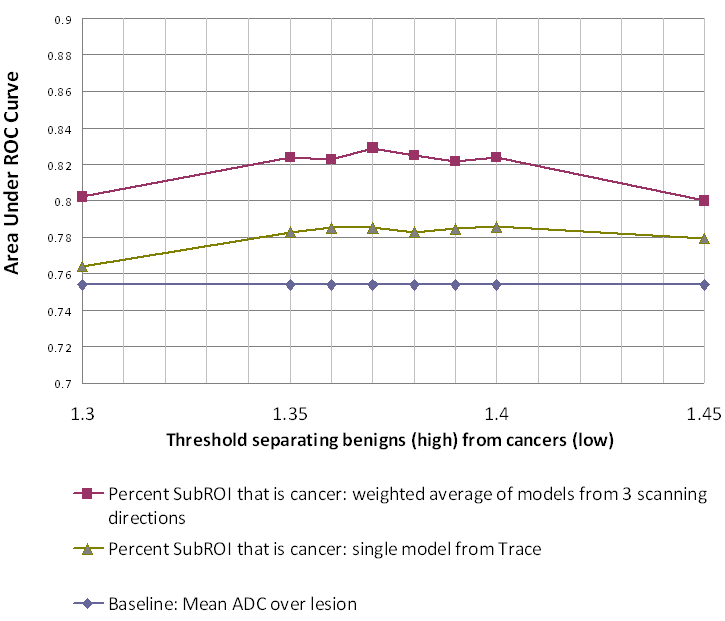
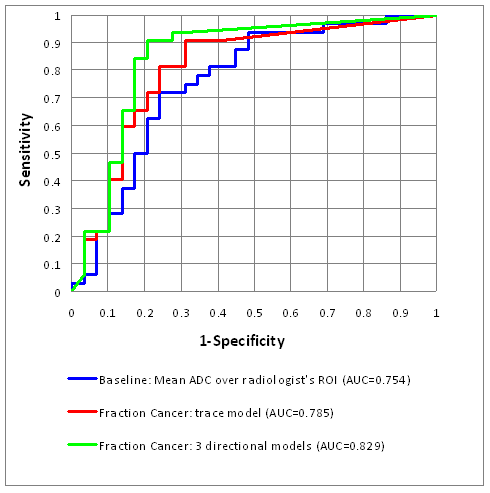
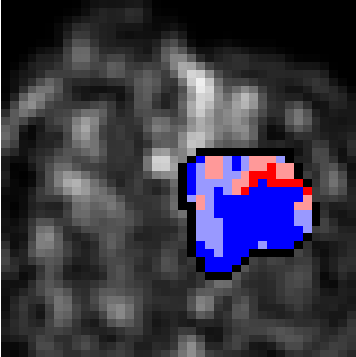
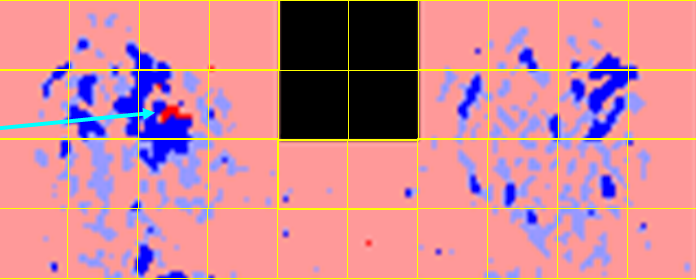
Figure 1 shows increased conspicuity of an ILC lesion in the augmented image compared to the ADC map. Figure 2 shows analysis determining optimal ADC threshold for distinguishing positive from negative pixels: bottom graph is from standard ADC methodologies; middle graph is from model methodology using only trace; top graph is from model methodology using independent evaluation of three directional scans. Area-under-curve (AUC) values are in range [0.822‑0.829] for thresholds in range [1.35-1.40] with maximum discrimination at threshold 1.37. Figure 3 shows three ROC curves at threshold 1.37 with the following AUC values: baseline: 0.754; model with trace: 0.785; model with independent directional evaluation: 0.829. The difference between baseline and model with independent directional evaluation at 1.37 was statistically significant (2‑tailed p‑value 0.047.) Figure 4 shows computer analysis of ILC lesion shown in Figures 1 at threshold 1.37; brightly colored pixels are in the subROI and pale pixels in the ROI but not the model, with red indicating ADC values below threshold and blue above threshold.Discussion
Baseline AUC was similar to AUC values reported from DMIST clinical trial for women with dense breasts; [i] by this measure, our cohort was similar to what is expected in a larger population. Approximately half of the improvement shown in Figure 2 appears to be due to the model methodology and half due to independently evaluating three directions. This suggests that MRI and PACS that retain only trace or aggregate data may be losing information that could be useful in discriminating lesions. Our ultimate goal is to develop a CAD system that will enable breast DWI to be a clinically viable as a supplement to mammography. With that goal in mind, we designed this prospective study to evaluate all cases that met eligibility criteria without excluding cases with fibrosis, patient motion, or other factors that have been excluded from prior published studies. Restricting the study to patients with dense breasts was done to demonstrate effectiveness in addressing a pressing clinical need. [ii] [iii] The model methodology can be extended to detection of breast lesions by tiling the DWI images in a checkerboard pattern, evaluating each tile as if it were a radiologist-drawn ROI, and forming a mosaic from the tiles. Figure 5 shows a tiling of the ILC shown in Figure 4 with red marks indicating areas of suspicion.Conclusion
We have shown that ROC evaluation of a multi-dimensional model-based methodology for discriminating breast lesions on DWI resulted in a statistically significant improvement over standard ADC methods. Results presented here are based on all patients recruited through September 2016 in an ongoing prospective study. Follow-up analysis of additional recruited patients and a planned reader study will enable further validation of these preliminary results.Acknowledgements
Research supported by NCI grant R44CA186313.References
[1] Pisano ED, Hendrick RE, Yaffe MJ, et al., ”Diagnostic Accuracy of Digital versus Film Mammography: Exploratory Analysis of Selected Population Subgroups in DMIST,” Radiology Volume 246 No. 2, Feb. 2008: 376-383.
[2] Melnikow JM, Fenton JJ, Whitlock EP, et al. “Supplemental Screening for Breast Cancer in Women With Dense Breasts: A Systematic Review for the U.S. Preventive Services Task Force,” Evidence Synthesis No. 126. AHRQ Publication No. 14-05201-EF-3. Rockville, MD: Agency for Healthcare Research and Quality; 2016.
[3] Emaus MJ, Bakker, MF, Peeters, PHM, “MR Imaging as an Additional Screening Modality for the Detection of Breast Cancer in Women Aged 50–75 Years with Extremely Dense Breasts: The DENSE Trial Study Design,” Radiology. Volume 277 No 2, Nov. 2015: 527-37.
Figures