3407
ICA based filtering of IVIM-DWI data to improve fidelity of parametric diffusion maps in breast cancer patients1GE Global Research, Bangalore, India, 2GE Healthcare, Hino, Japan, 3Department of Radiology, University of Cambridge School of Clinical Medicine, Cambridge, United Kingdom, 4Department of Radiology, Addenbrookes Hospital, Cambridge, United Kingdom
Synopsis
IVIM-DWI data can be potentially corrupted by eddy currents, susceptibility artifacts, motion and image reconstruction methods. We hypothesized that artifacts in IVIM imaging could be separated from true diffusion decay using an independent component analysis (ICA) methodology. In this work , we demonstrate that with ICA based filtering of raw IVIM data, transients in IVIM data are removed, with consequent improvement in IVIM model fit quality and reduction in saturated values in pseudo-diffusion D*maps. This should therefore improve confidence in interpreting IVIM parametric maps in clinical practice.
Introduction
Diffusion weighted imaging (DWI) is an increasingly used biomarker in clinical oncology [1]. Intra-voxel incoherent motion (IVIM) based DWI is used to characterize tumor tissue in terms of micro-structure and vascularity [2,3]. IVIM fits a bi-exponential model to multi-b-factor DWI data [4]:
S(b) = S0 ((1-f) exp(-b×D) + f exp(-b×D*)) [Eq.1]
IVIM model provides: a) diffusion coefficient (D), b) pseudo-diffusion coefficient (D*) and c) perfusion fraction (f). Previous studies have investigated multiple approaches for fitting Eq.[1] to IVIM data and reported differences in parameters based on approaches used [2]. Potential reasons, apart from numerical instabilities, could be artifacts in DWI acquisition [5]. In this work, we hypothesized that artifacts in IVIM imaging could be separated from true diffusion decay using an independent component analysis (ICA). Results from ICA based filtering and improvement in IVIM maps in breast tumor patients are presented.
Methods
Patient Data: Six breast cancer patients were scanned on a 3T GE MR750 scanner using 8-channel breast coil.
IVIM protocol: TE/TR = 79.2 / 5000 ms, matrix = 256 x 256 x 40, resolution = 1.32 mm x 1.32 mm x 4 mm, 8 DWI images ( b-values = 0, 30, 60, 90, 120, 300, 600, and 900 s/mm2). A volume imaging for breast assessment (VIBRANT) technique MRI data was co-acquired and used for outlining tumor.
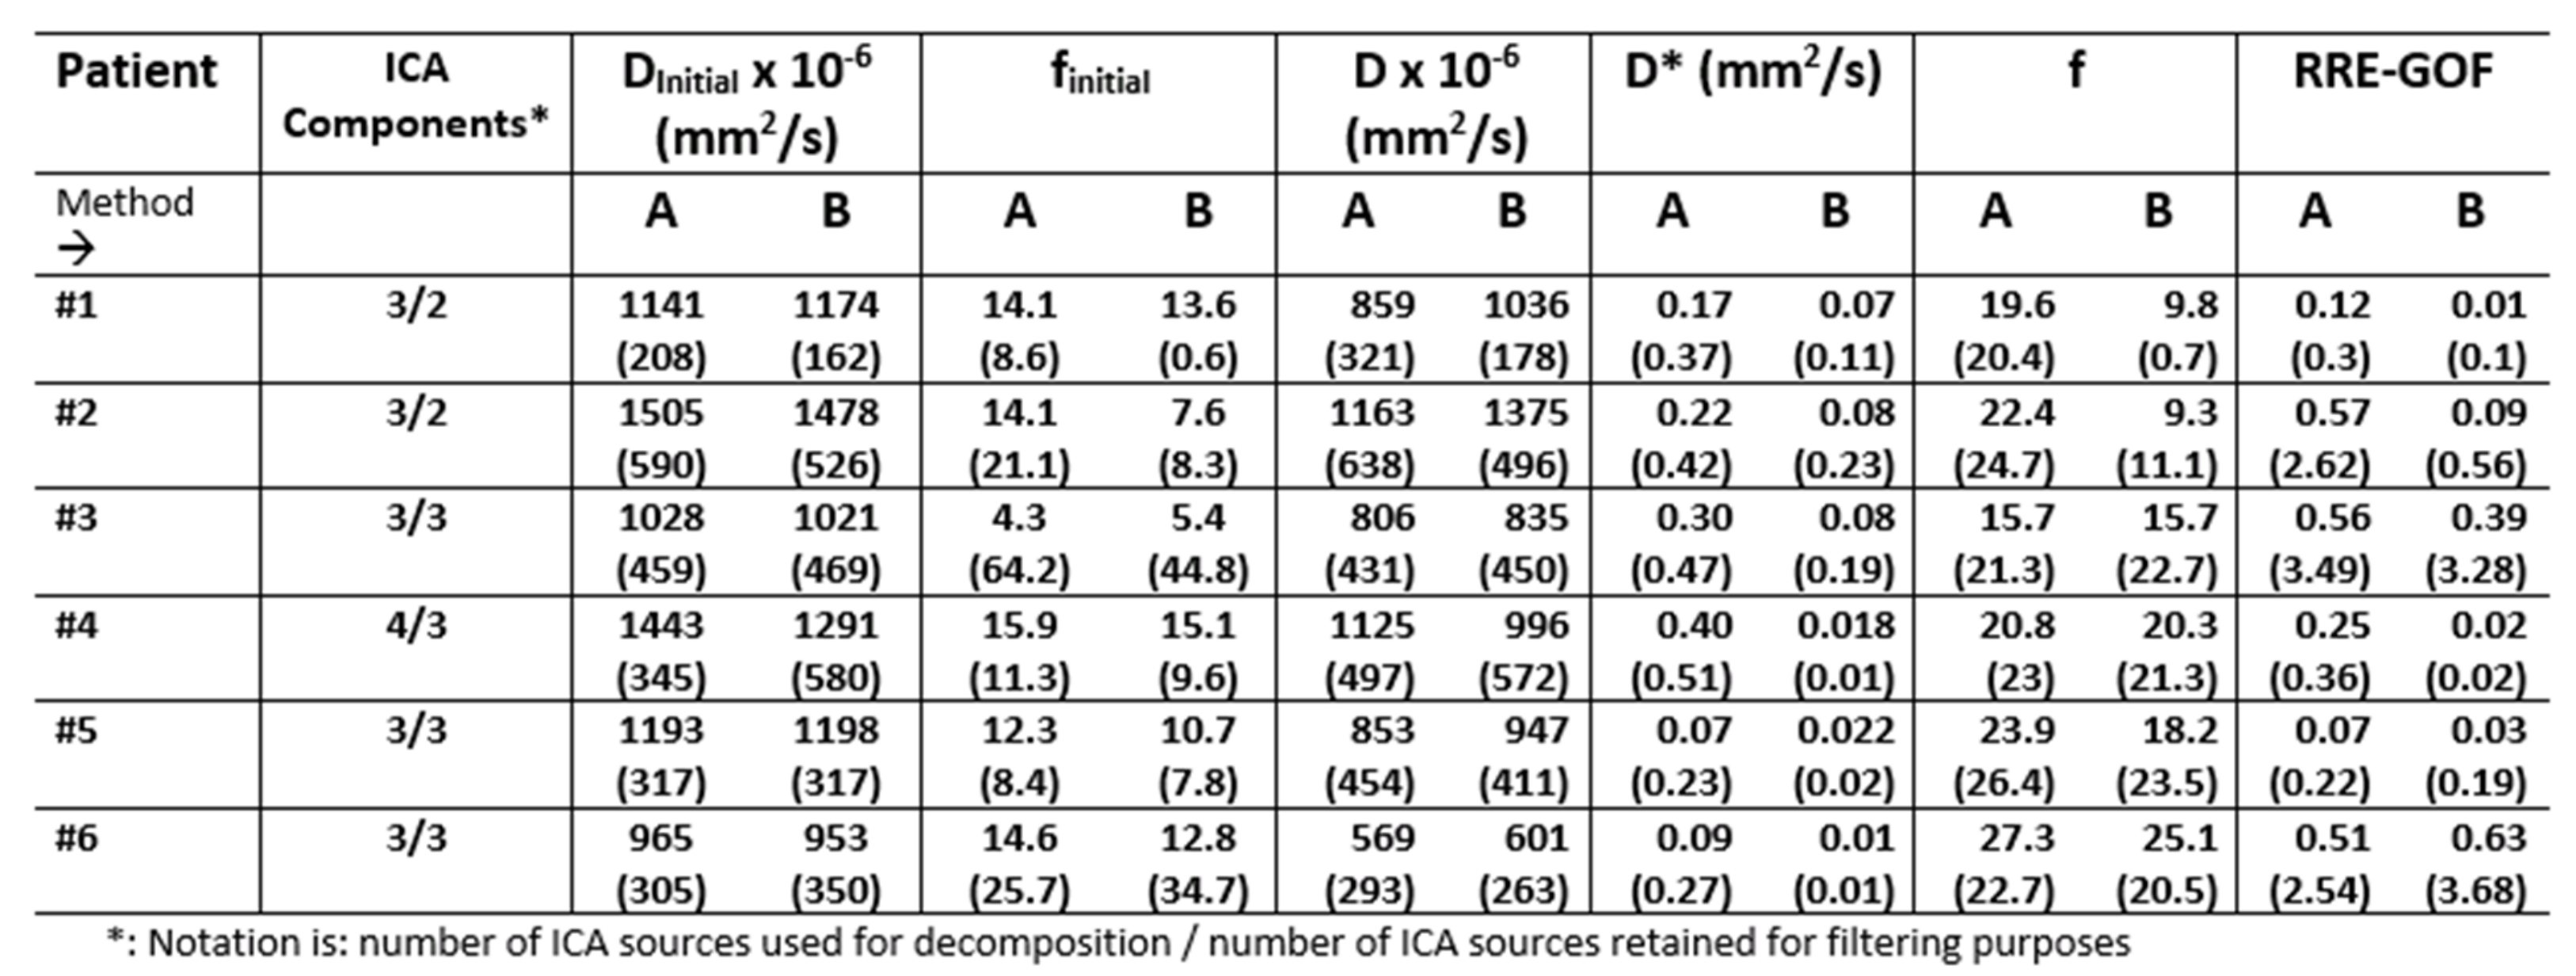
IVIM Analysis: Performed using an in-house tool developed in MATLAB. First, initial estimates for D and f parameters (Dinitial, finitial) in Eq.[1] estimated by considering only b-value data > 200 s/mm2 and fitting a mono-exponential model to IVIM data. This mono-exponential fit was extended backwards to fit the term: S0 × (1- finitial) × exp(-b>200× Dinitial) to obtain finitial [2]. Next, these values were used as initial guess to a constrained (D* > D and 0 < f < 1) non-linear fitting algorithm to estimate: D, D* and f in Eq. [1]. Goodness of fit was assessed using residual regression error (RRE) = [sum (fit residuals/ S(b))]/8. A lower RRE value suggests improved fitting of model to data.
ICA-Filtering: ICA algorithm was applied to IVIM data to obtain spatially independent components (sources). Sources were visually inspected and only those sources which matched diffusion signal behavior were retained. ICA filtered IVIM data was reconstructed using retained ICA sources and corresponding weight matrices.
ICA-IVIM Analysis: For ICA analysis, IVIM data was motion corrected using a non-rigid SyN registration (NRR) algorithm [6]. Fibro-glandular tissue (FGT) mask was semi-automatically segmented on VIBRANT images. FGT and tumor mask were aligned to IVIM data using NRR. ICA separation and analysis was performed within voxels in FGT+tumor mask.
IVIM fitting was then performed on: motion corrected data only (Method A) and motion corrected ICA filtered data (Method B).
Results and Discussion
In case P#1, for Method A, D and f-maps are of reasonable quality, while D* map has several saturated voxels (values = 1.4 mm2/s) which is above the physiological limit for D* map ( < 0.1 mm2/s [2]) (Figure 1). Many IVIM curves show signal increase for intermediate b-values (Figure 2A), contrary to behavior expected in diffusion experiment. ICA identifies spurious component (arrow, Fig 2B, 2C). The transient in IVIM data (arrow in Figure 2D) is removed by ICA. Improvement in IVIM fit post ICA filtering is seen in lower %RRE and tighter 95% confidence bounds on IVIM model parameters (Figure 2D). Figure 2E shows IVIM maps with Method B, with clear improvement in tumor regions (compared to Method A, Fig 1). Results for case P#4 are shown in figure 3.
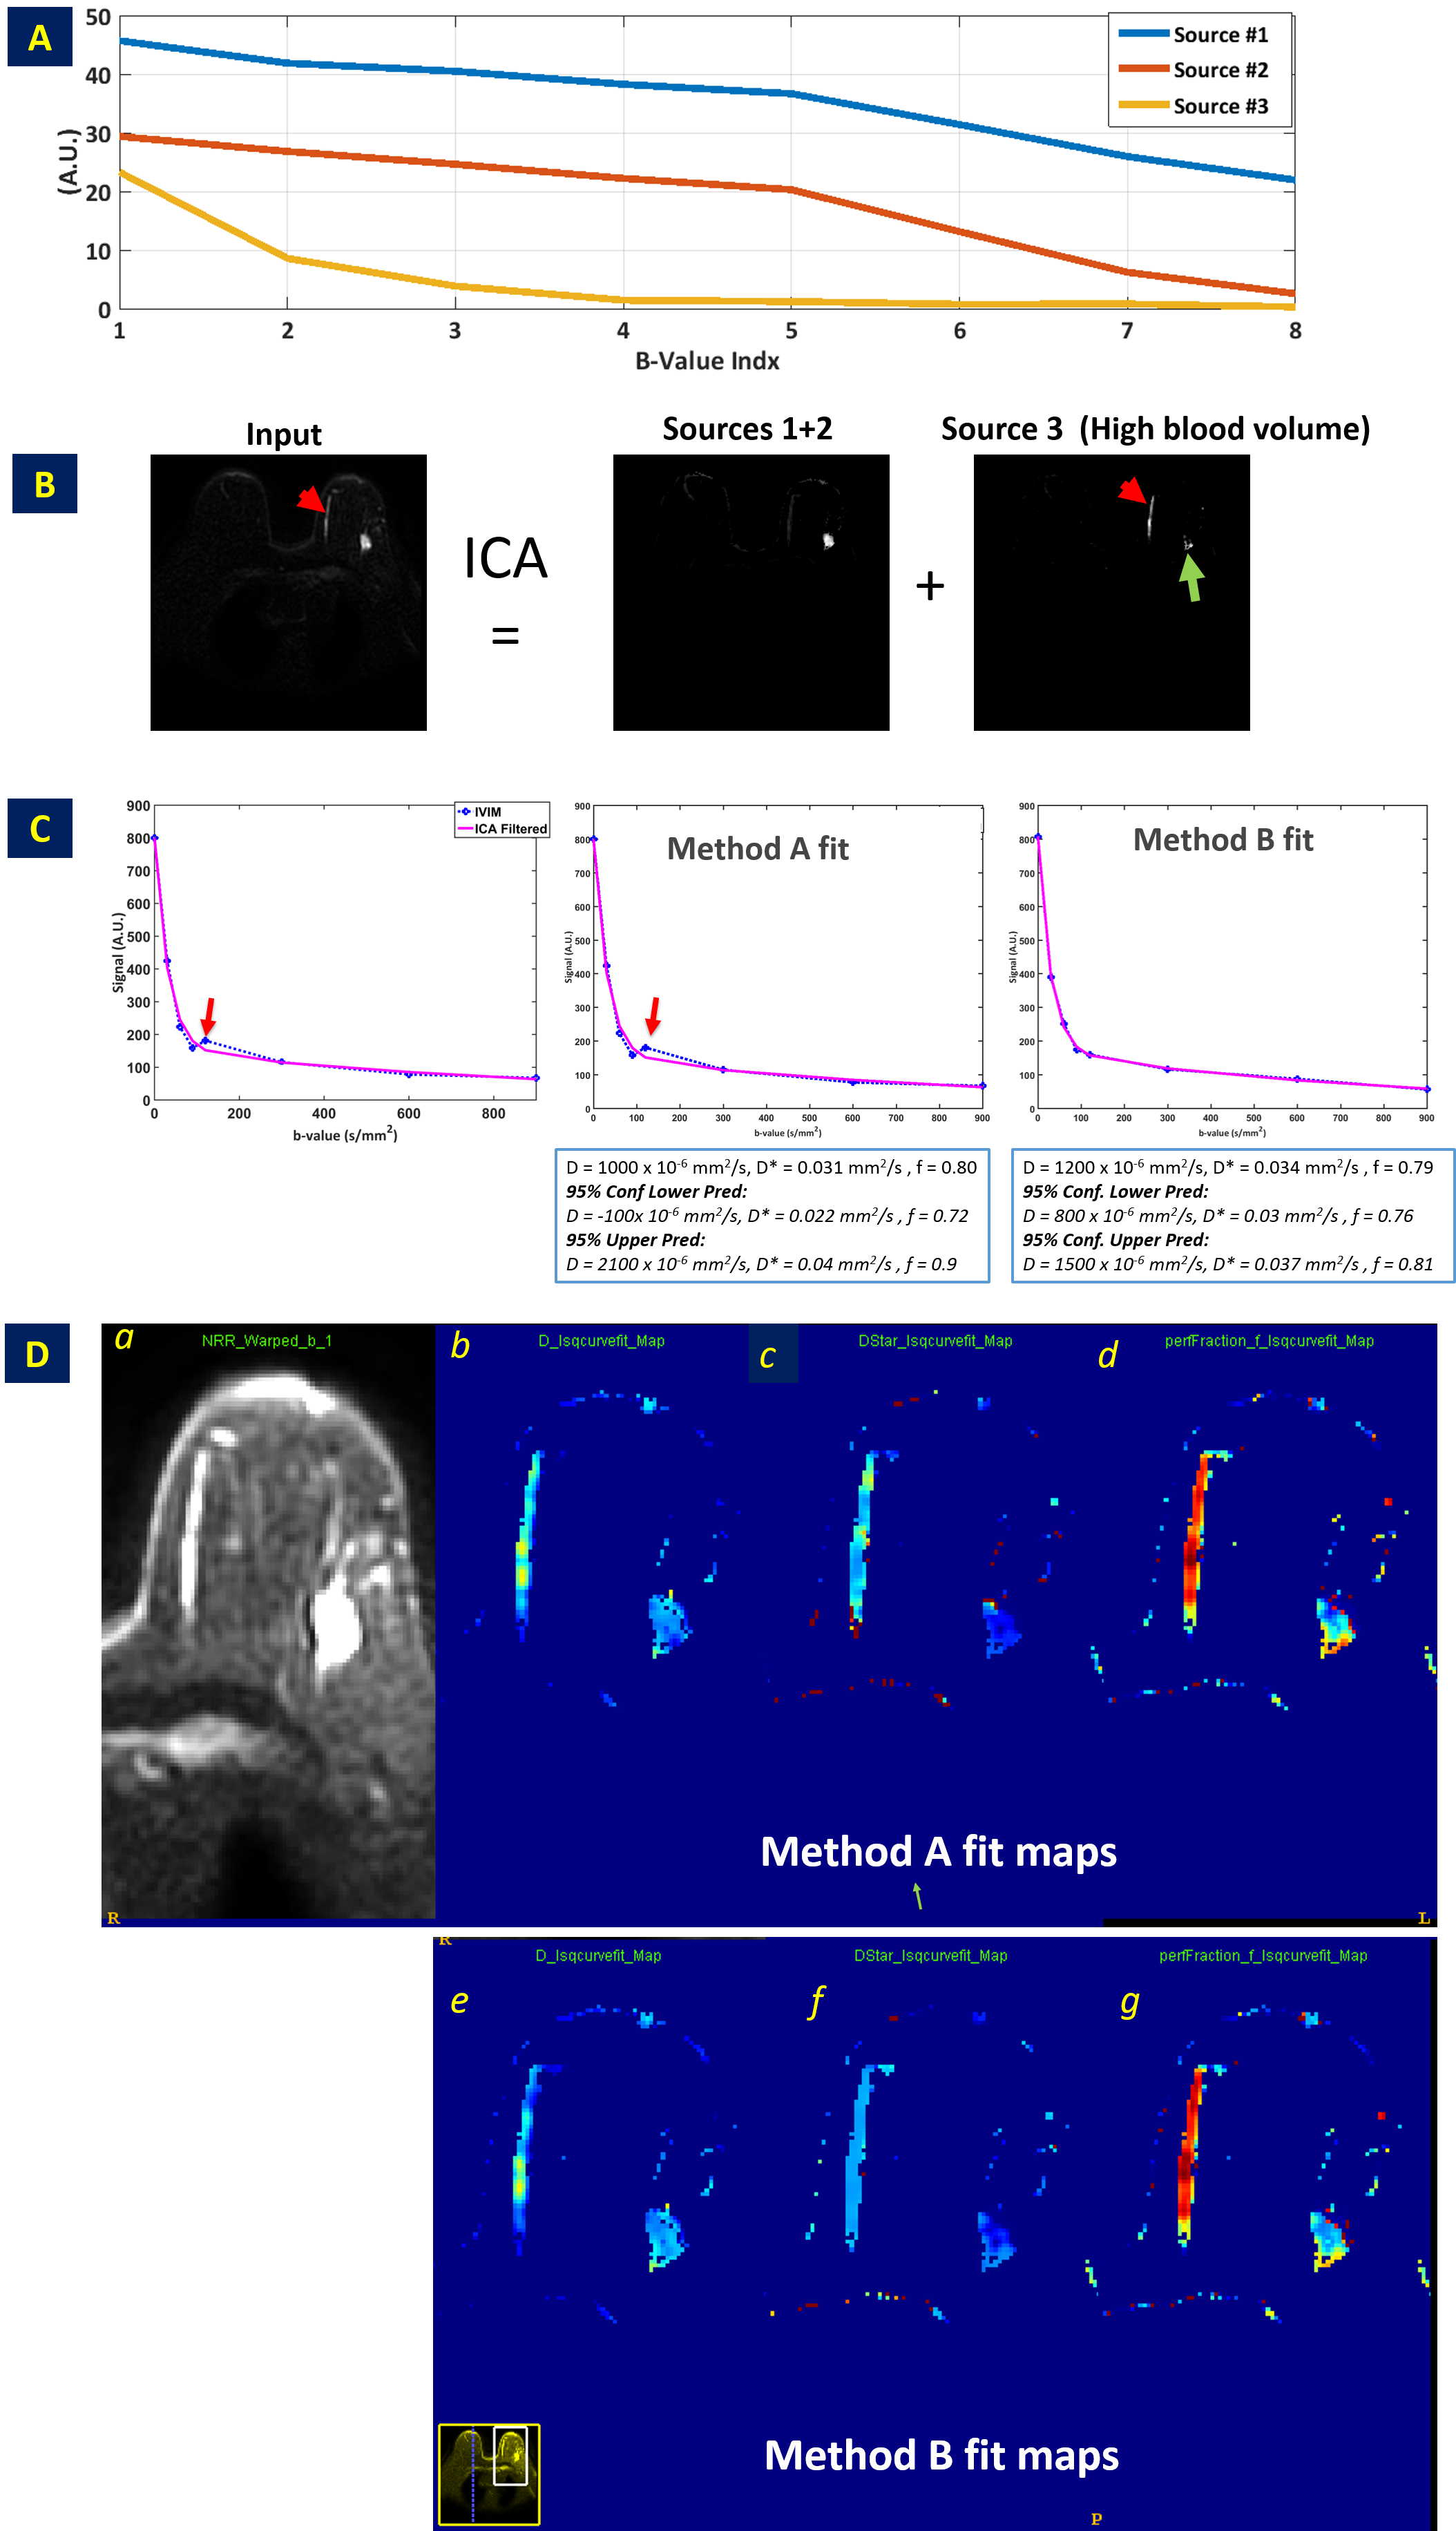
Figure 4 shows case P#6 where FGT mask included a large vein and was separated by ICA (source 3), probably indicating regions with a high blood volume (arrows Fig.4B). While all components were retained for filtering, ICA was still provided transient removal (arrow Fig.4C) and improved fit estimates (tighter 95% confidence bounds, figure 4C Box). Figure 5 summarizes results for both Method A and B for different maps.
Whilst previous publications have demonstrated segmented methods to improve IVIM map quality, it was primarily applicable to D and f-maps. Inaccuracies associated with D* maps cannot be addressed directly with segmented approaches [2]. By removing transients, ICA filtered IVIM has shown improved accuracy in D* maps. Primary limitation of method is need to apply ICA in similar tissue types to avoid contamination of signal behavior between artifact and tissue characteristics.
Conclusion
We have demonstrated that with ICA filtering, there is removal of transients in IVIM data and hence improvement in IVIM model fit quality and increased confidence in IVIM parametric maps used in clinical practice.Acknowledgements
No acknowledgement found.References
1. Padhani AR, Neoplasia Vol. 11, No. 2, 2009.
2. Suo S., J. MAGN. RESON. IMAGING 2015;42:362–370
3. Fujima N, Magn Reson Imaging. 2014 Dec;32(10):1206-13
4. Le Bihan D, Breton E, Lallemand D. Radiology 1988;168:497–505.
5. Le Bihan D, JOURNAL OF MAGNETIC RESONANCE IMAGING 24:478 –488 (2006)
6. Chebrolu VV et.al; Proceedings of 23rd ISMRM 2015, Toronto, p. 668
Figures
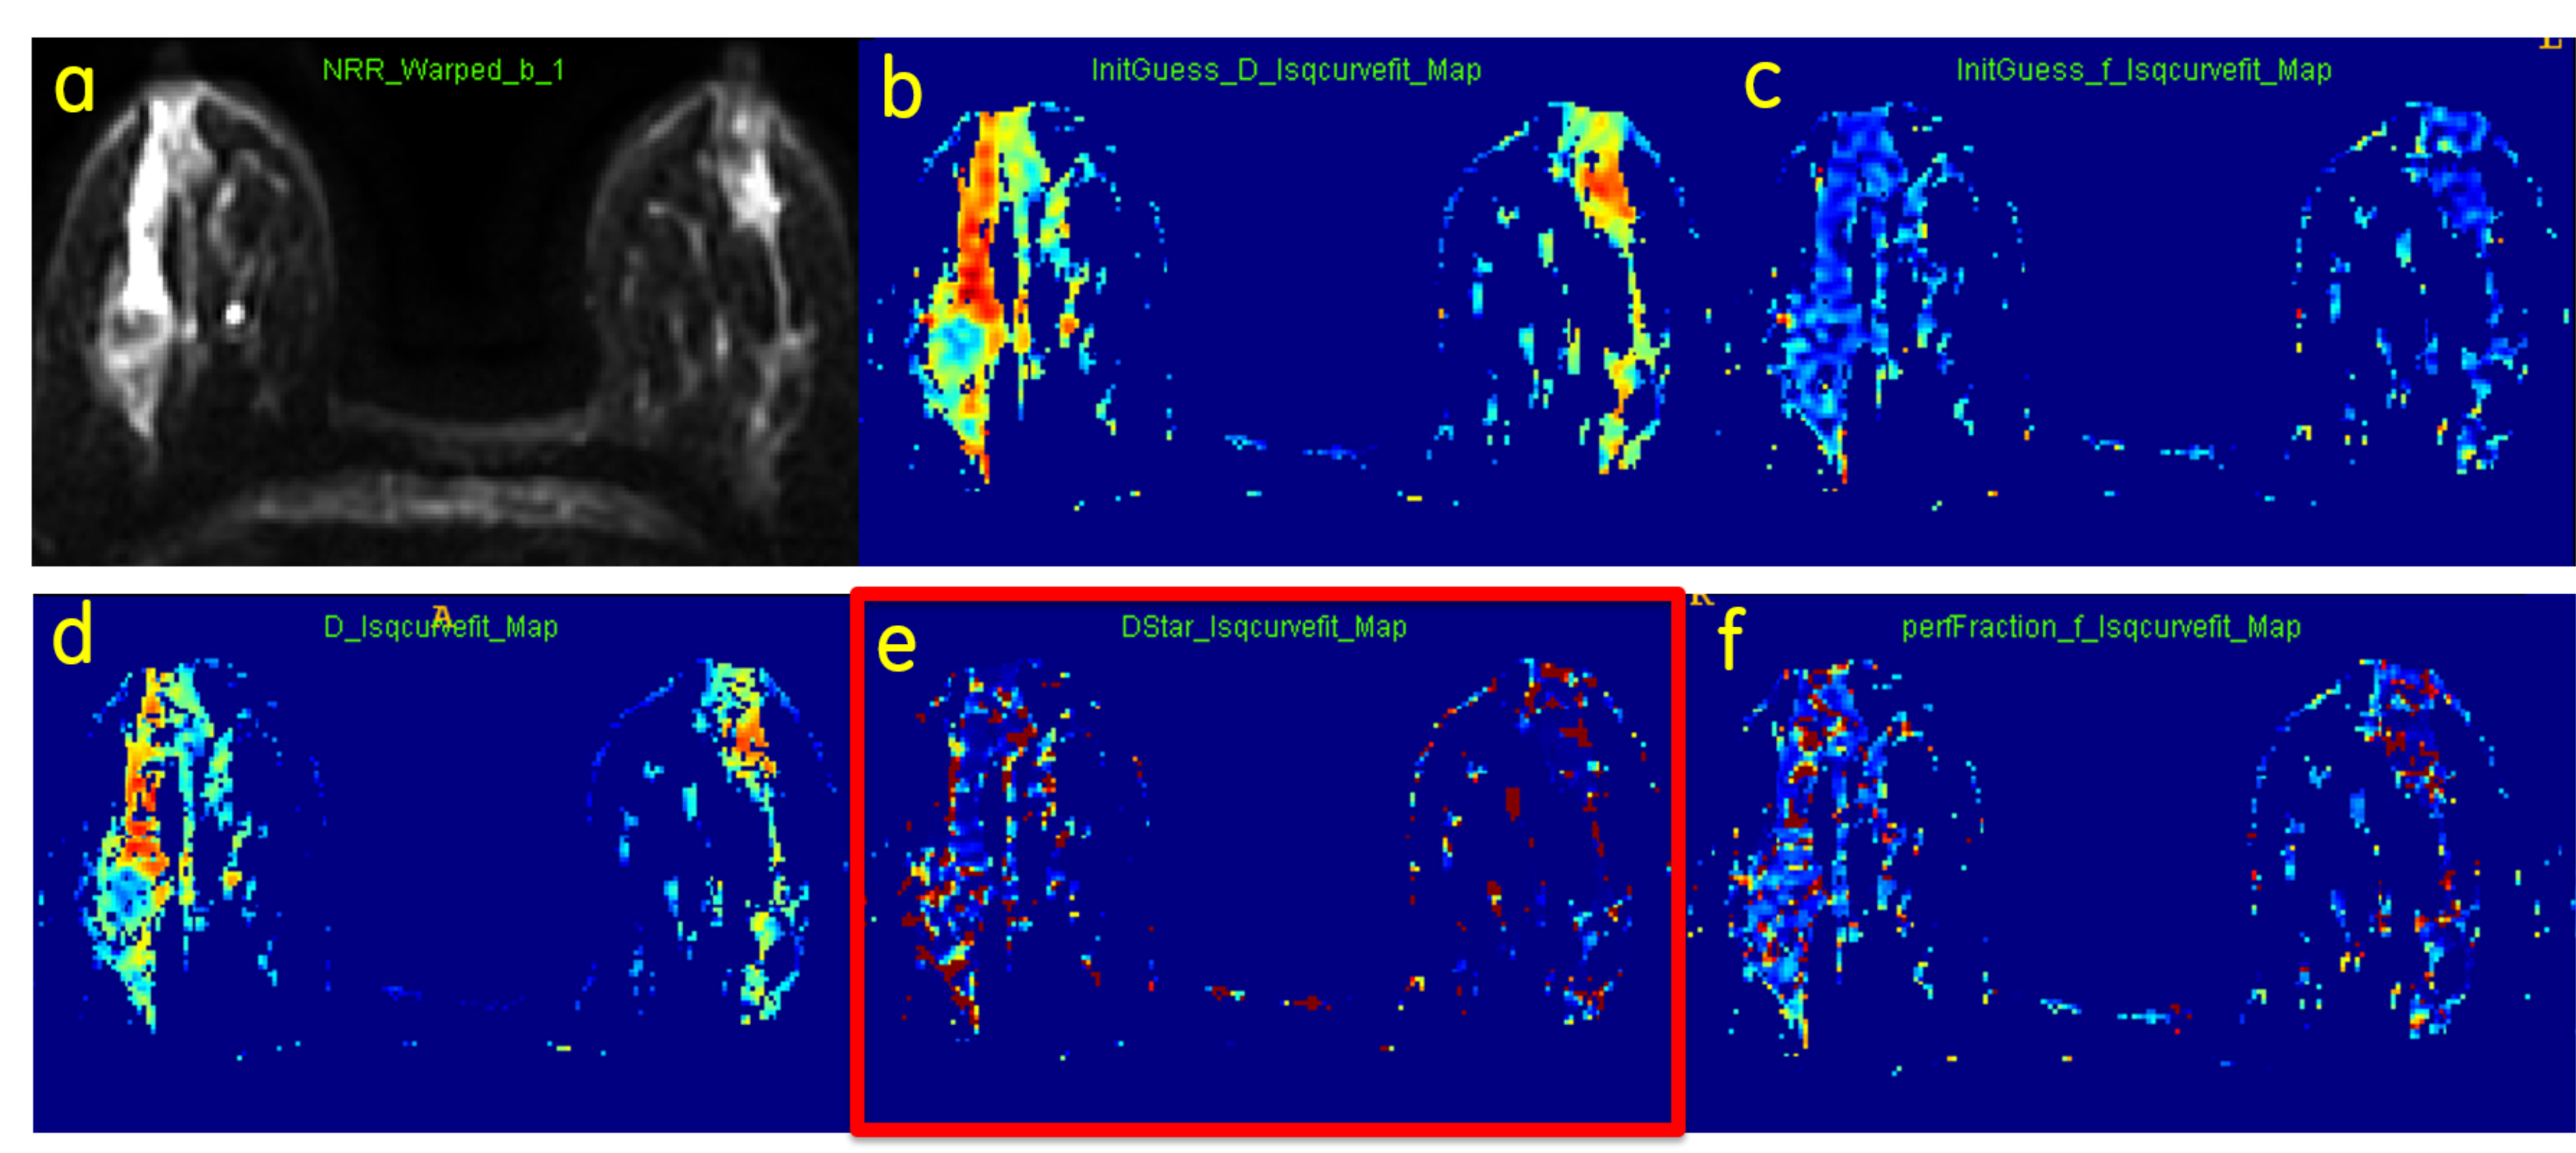
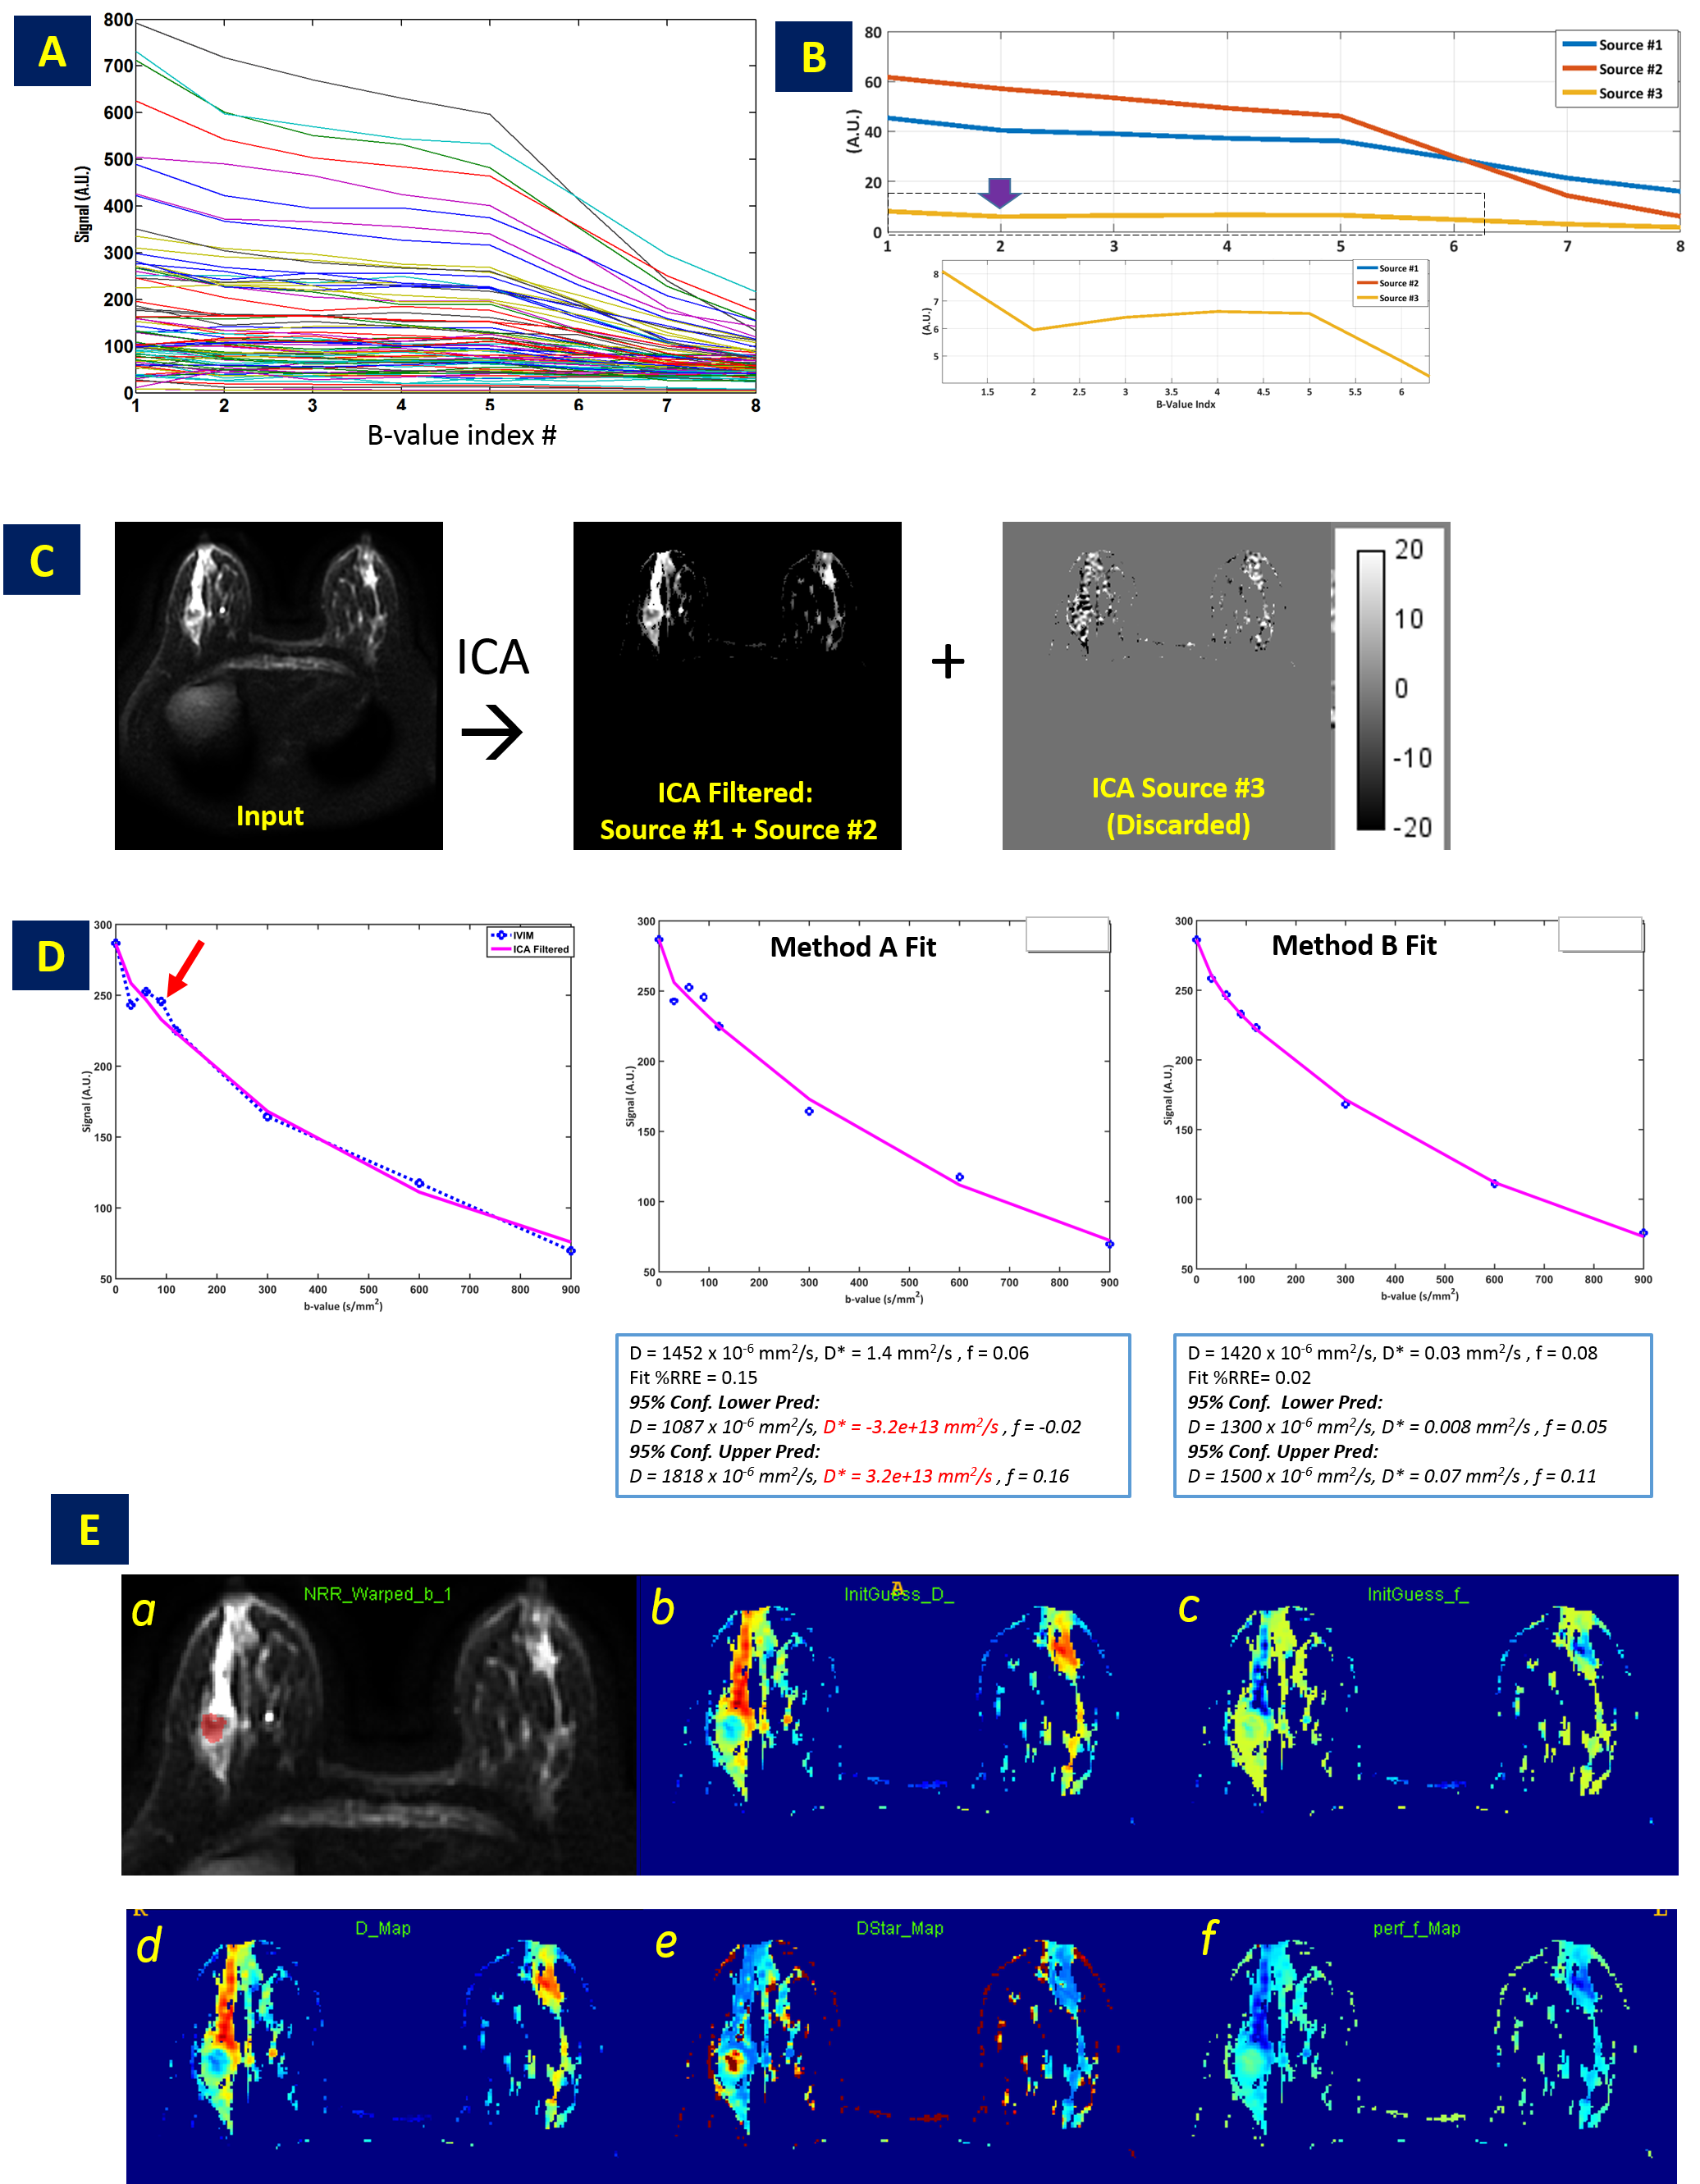
Figure 2: A. Sample IVIM Curves in FGT+Tumor Region in Case P#1; B. ICA sources, with artifact source #3 (arrow) magnified ;
C. IVIM data (b-factor = 30 s/mm2 shown) reconstructed using valid sources (#1 and #2) along with discarded source (#3).
D. IVIM data has transient (see arrow), which is filtered by ICA. Filtering improves fitting accuracy of IVIM model on data (notice that 95% confidence intervals on Method B data fit are reduced for all parameters.
E. a= IVIM data (b-factor = 30 s/mm2 ) with tumor mask overlaid; b to f: Same as in Fig 1.but using Method B
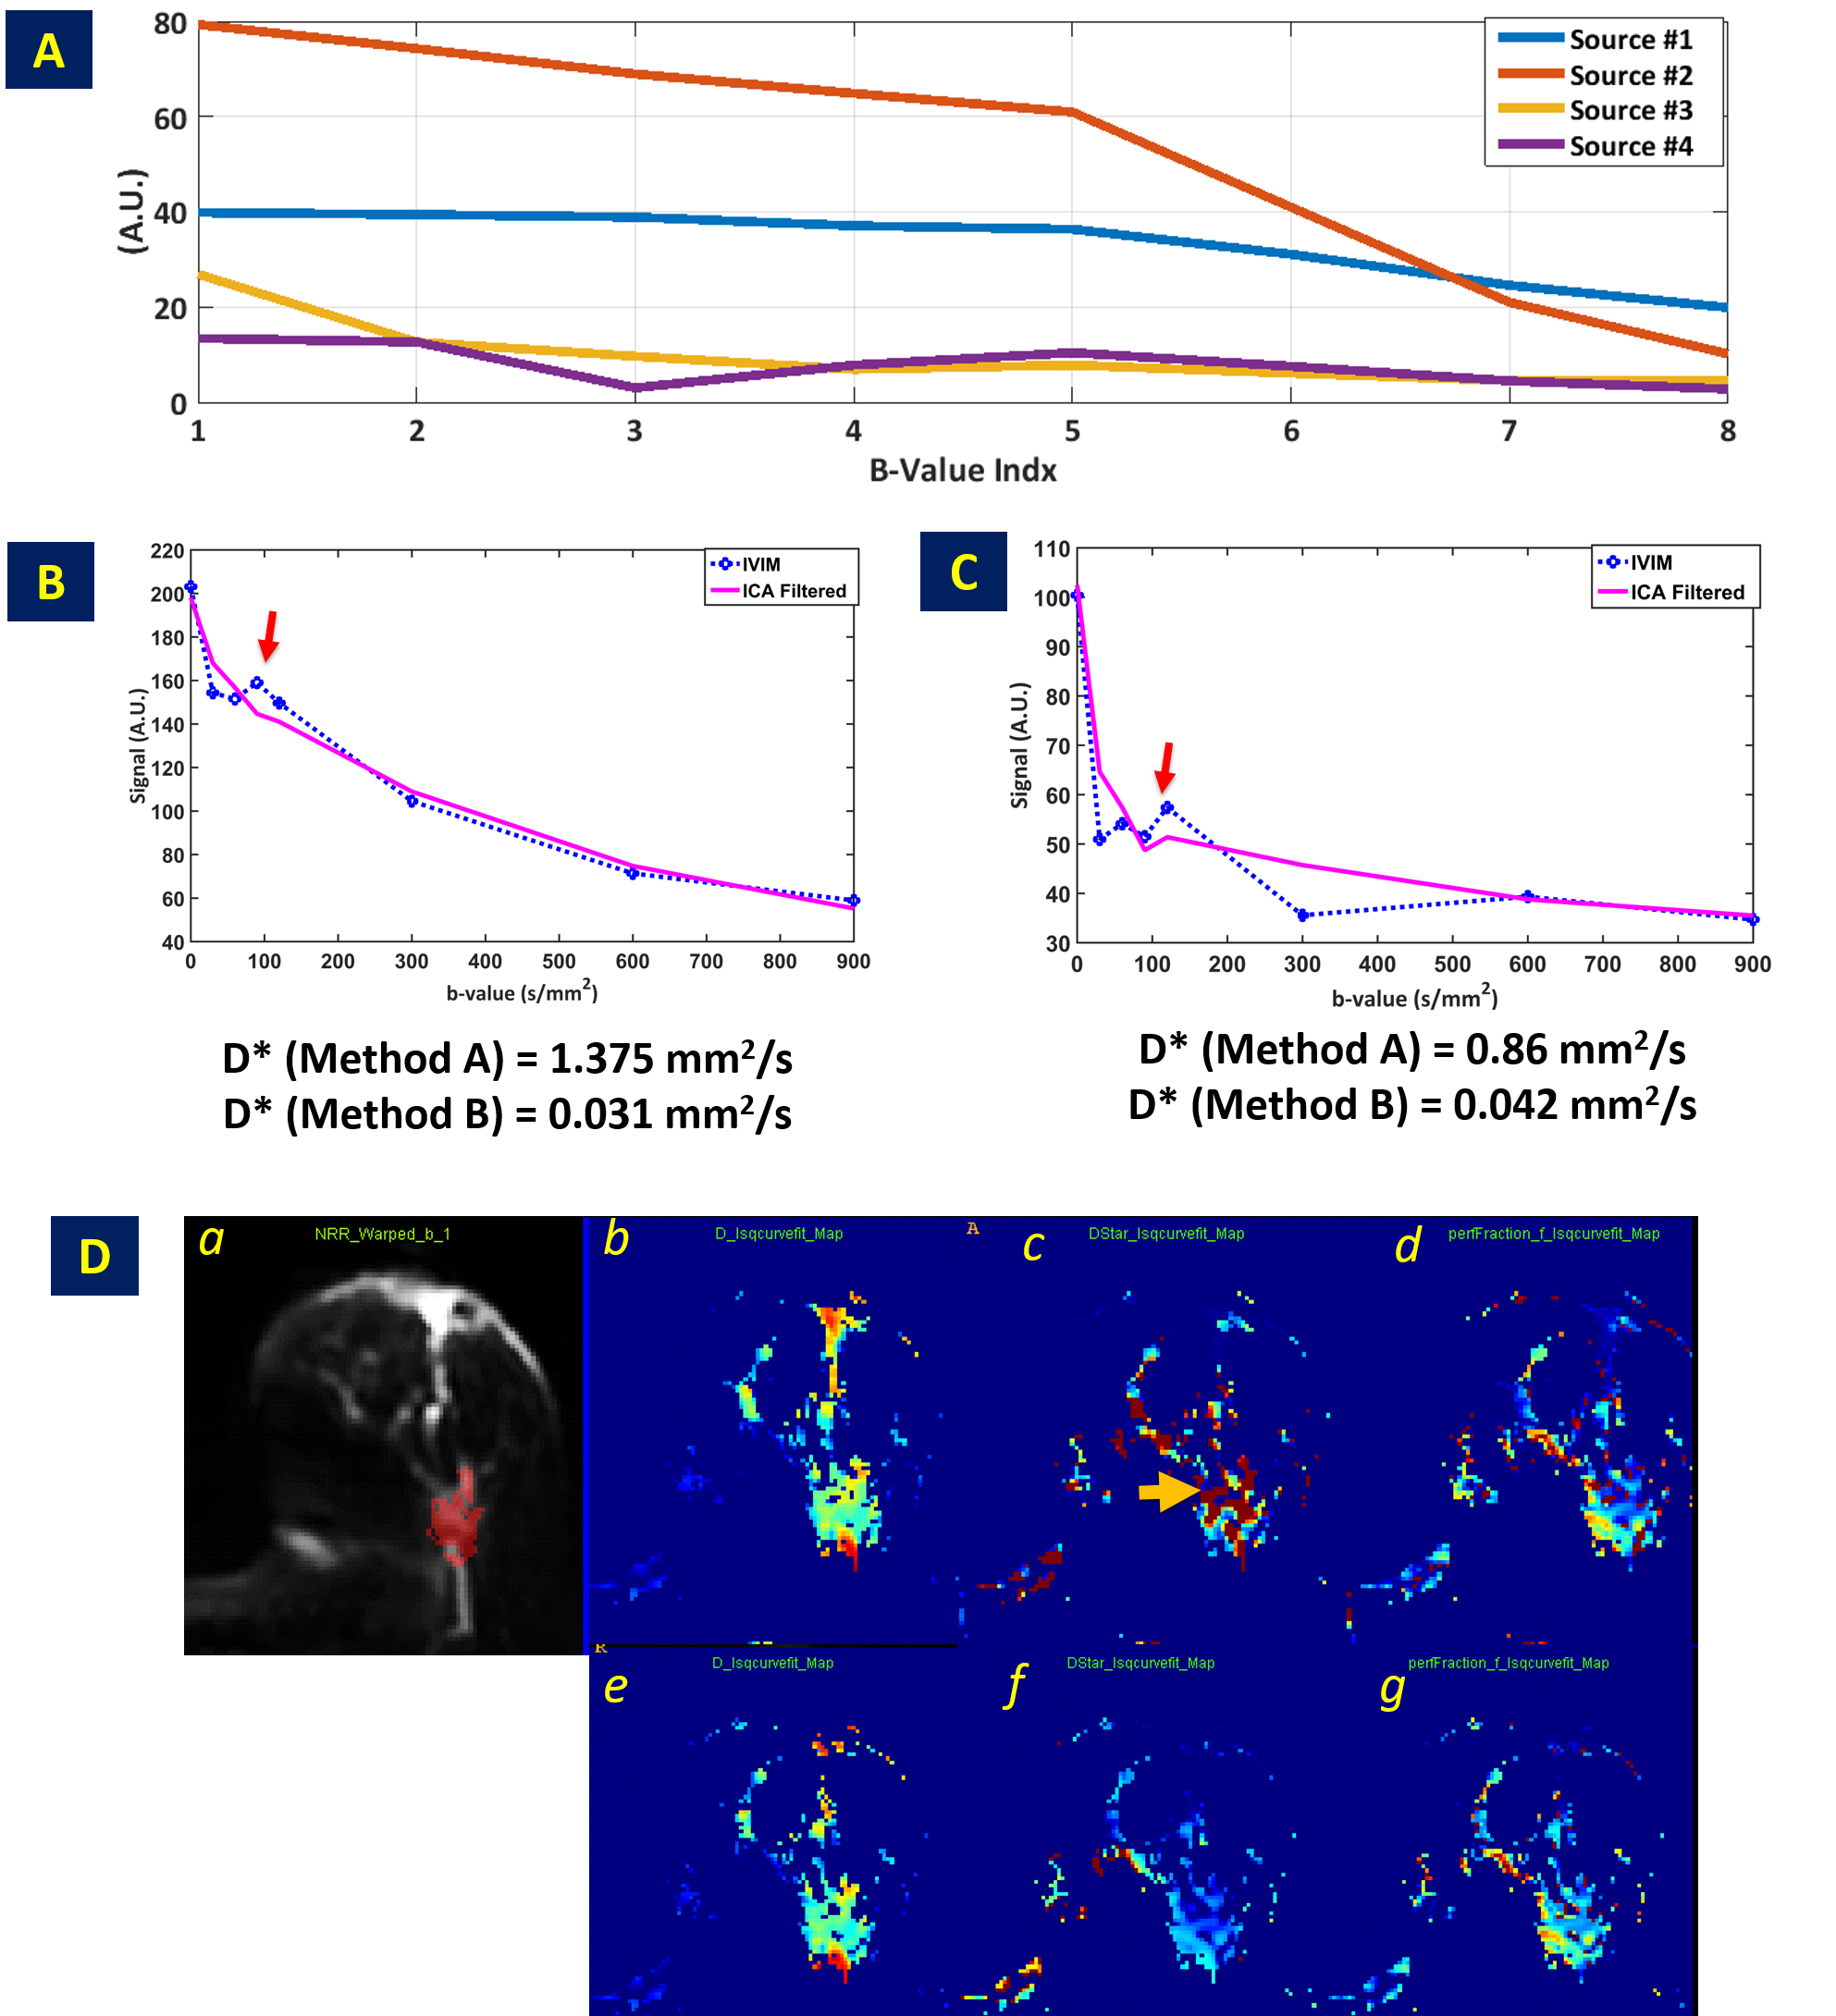
Figure. 3: Case P#4.
A. Four ICA sources used to get good separation of decaying diffusion sources and corrupted source (#4)
B and C. ICA filtering examples shown in two separate voxels. ICA filtering removes transients in IVIM data thereby improving fidelity of IVIM model fit to the data. Filtering ensures that D* values are in physiologically acceptable range (< 0.1 mm2/s).
D. a. IVIM (b-factor =30 s/mm2 with tumor overlaid in red), b – d and e-g : D, D* and f maps for Method A and Method B respectively. Notice that filtered maps don't contain spurious D* values (arrow)