3405
Application of diffusion kurtosis MR imaging in characterization of renal cell carcinomas with different pathological types and grades1Beijing Hospital, Beijing, People's Republic of China, 2GE healthcare, MR research China, People's Republic of China
Synopsis
Identification of subtypes and pathological grades of renal cell carcinoma (RCC) prior to treatment has clinical significance in determining a treatment strategy and evaluating prognosis. In our research, we detected microstructural differences of RCC by using diffusion kurtosis imaging (DKI). The results showed that DKI had good inter- and intra-observer reproducibility of RCC as a new reliable noninvasive biomarker. Kurtosis metrics showed statistical differences between RCC and contralateral renal parenchyma, among the subtypes of RCC, and between low- and high- grade clear cell RCCs. Thus, DKI has the potential application in depicting the microstructural characteristics of RCC.
Purpose
Renal cell carcinoma (RCC) is the most common malignant renal tumor in adults. Identification of subtypes and Fuhrman grades prior to treatment has clinical significance in determining a treatment strategy and evaluating prognosis. Diffusion weighted imaging (DWI) gained increasingly important application in abdomen in the past decade. Studies on the relationship between DWI and histological characteristics of RCC found that DWI showed moderate accuracy in separating high- from low-grade clear cell RCC (CCRCC), but the accuracy in distinguishing the subtypes of RCC was not reliable.1 The principle of DWI is based on the assumption of a Gaussian distribution of displacement probabilities of water molecules due to water self-diffusion. However, the diffusion of water molecules is not Gaussian in most tissues of the human body because of the complex structures.2,3 Diffusion kurtosis imaging (DKI) based on non-Gaussian diffusion models might assess the complexity of microstructural environments more accurately than conventional DWI.4 Recently, several studies had evaluated the clinical applications of DKI in brain, prostate, liver, normal kidney, etc.5-9 and demonstrated that DKI provided more precisely information of histological characteristics of lesions and normal parenchyma. The aim of this investigation was to probe the feasibility and characteristics of DKI in RCC and to apply DKI in distinguishing subtypes of RCC and the grades of CCRCC.
Methods
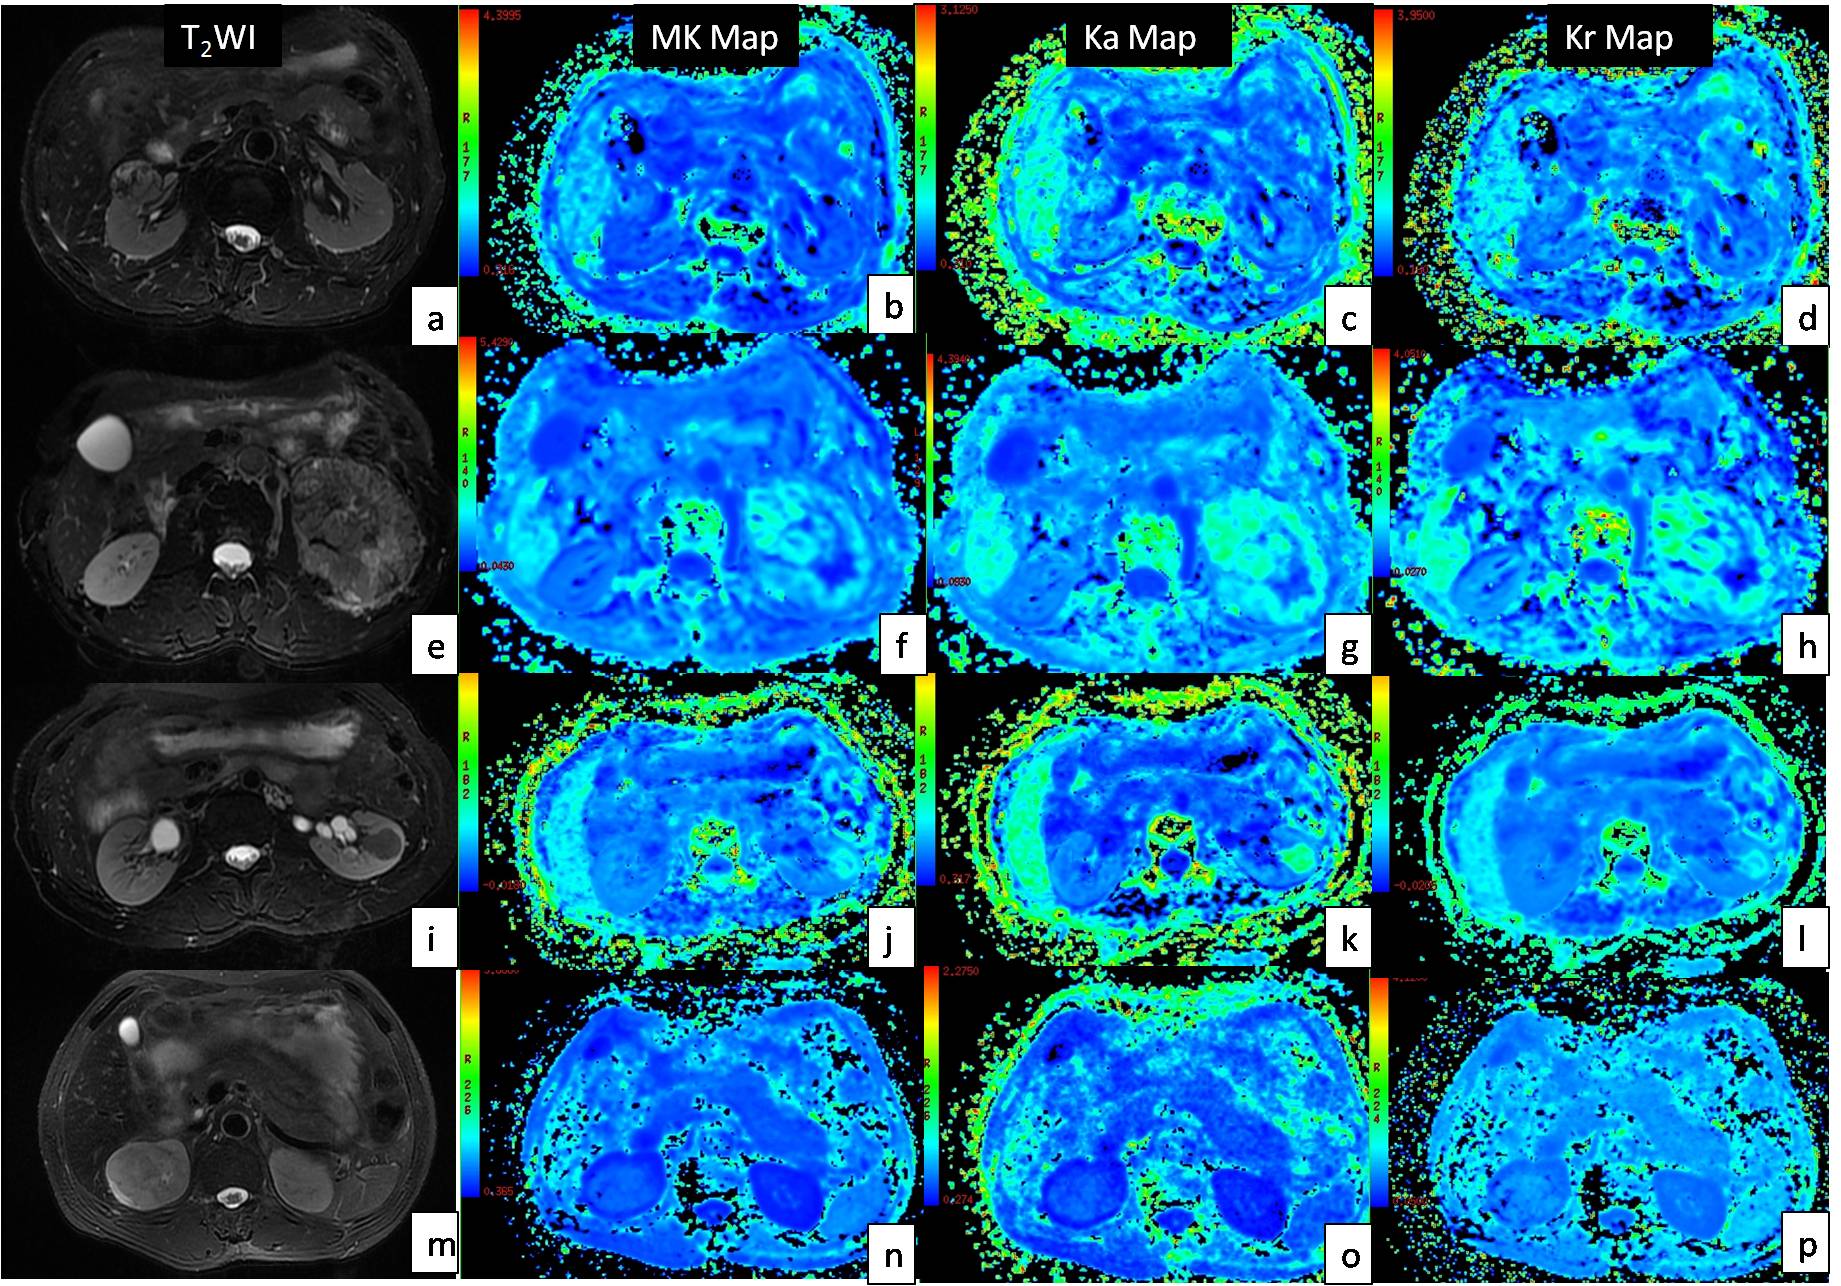
This prospective study was approved by the Institutional Review Board, and the informed consent was waived. From March 2015 to October 2016, 38 patients with pathologically confirmed RCC [30 CCRCC, 5 papillary RCC (PRCC) and 3 chromophobic RCC (CRCC)] were involved in the study. All the patients underwent diffusion kurtosis MR imaging with GE Discovery MR750 3.0T system. Respiratory-triggered EPI sequences were acquired in the axial plane (3 b-values: 0, 500, 1000s/mm2, 30 diffusion directions) for DKI. Kurtosis metrics including mean kurtosis (MK), axial kurtosis (Ka) and radial kurtosis (Kr) were measured for the renal lesions and contralateral uninvolved renal parenchyma. Both intra- and inter-observer agreements of all metrics were evaluated by using the intraclass correlation coefficient (ICC) and Bland-Altman plot. Statistical comparisons with metrics of three RCC subtypes were performed with one-way analysis of variance (ANOVA) test and multiple comparison Scheffé test, while data of all RCCs were also compared with those of contralateral renal parenchyma using paired- t test. Furthermore, DKI metrics of low grade (Fuhrman grade I~II, 22 cases) and high grade (Fuhrman grade III~IV, 8 cases) CCRCCs were compared and receiver operating characteristic curves were drawn to establish cut-off DKI metrics.Results
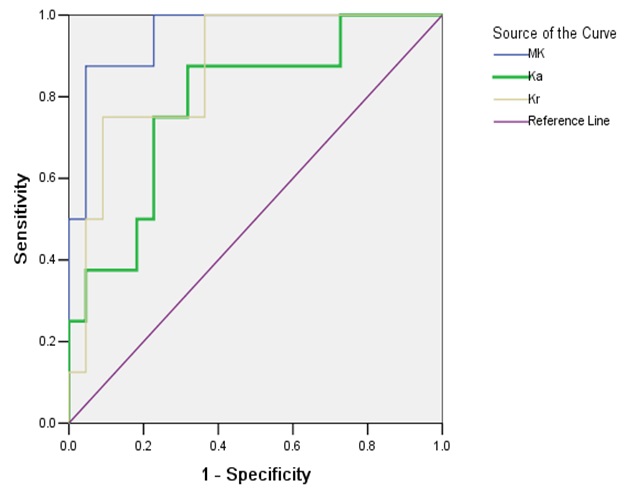
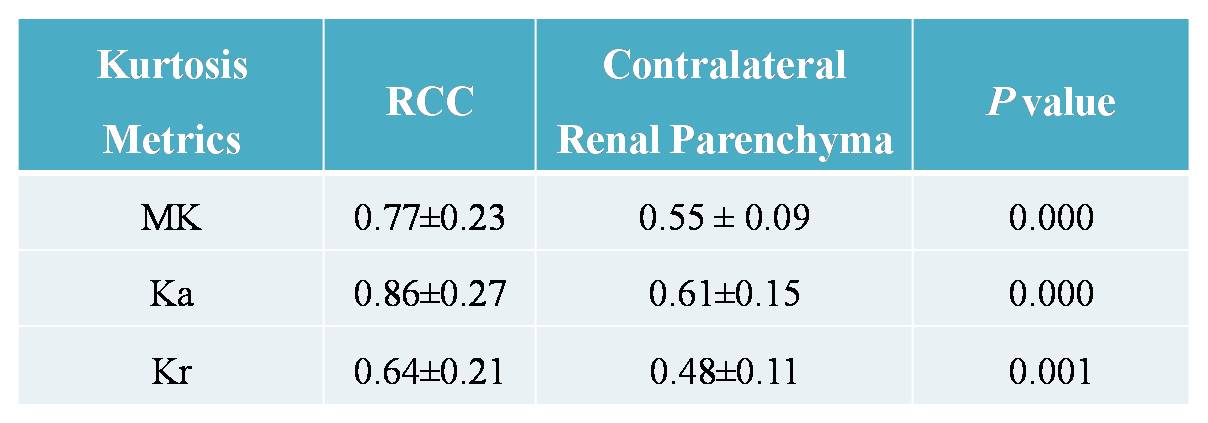
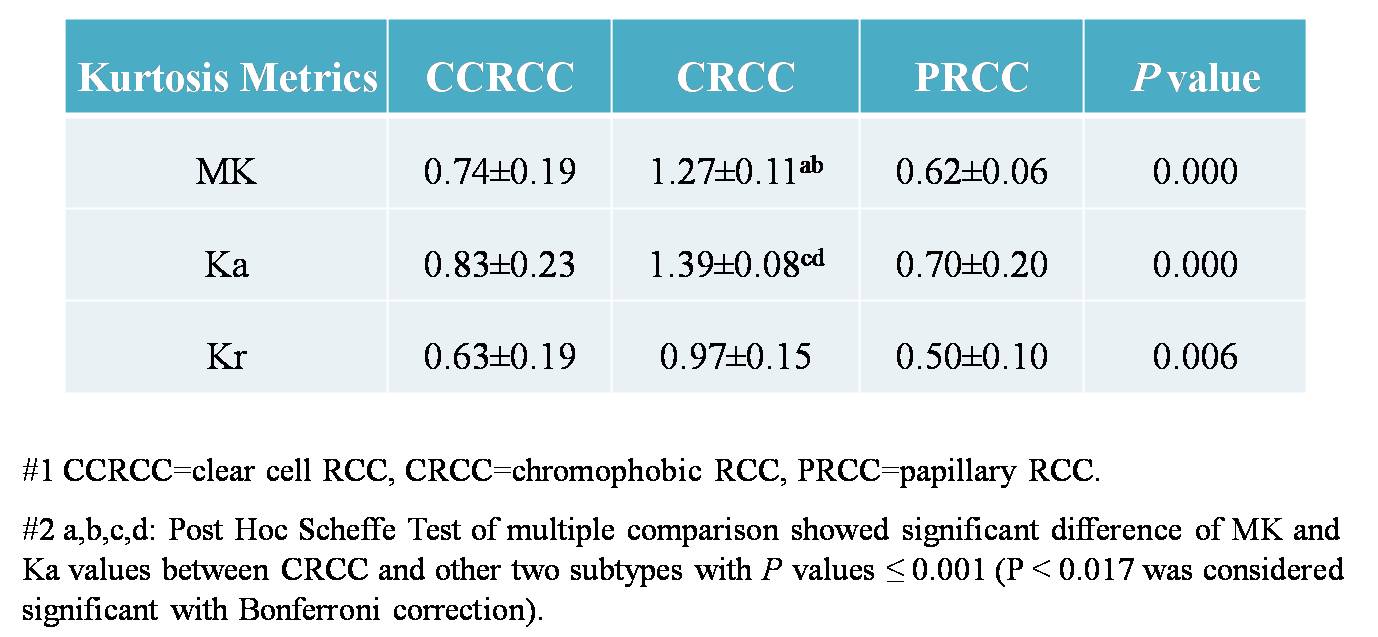
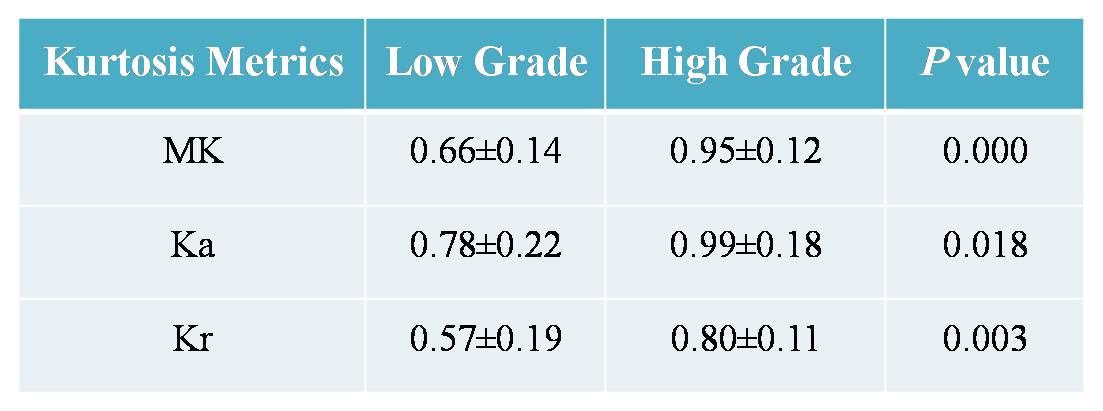
Inter- and intra-observer measurements for each metrics showed great reproducibility with good ICCs ranging from 0.815 to 0.942. The range of mean differences of MK (Ka, Kr) ± LOA were from (-0.007±0.127) to (0.035±0.152). There were significant differences between the DKI metrics of RCCs and contralateral renal parenchyma (p≤0.001) (Table 1), also among the subtypes of RCC (p≤0.006) (Table 2). MK and Ka values of CRCCs were significantly higher than those of CCRCCs and PRCCs (Table 2, Fig. 1). Statistical difference of MK, Ka and Kr values were also obtained between CCRCC with low- and high-grade (Table 3, Fig.1). Area under the receiver operating characteristic curve was highest for MK (0.955) during testing to discriminate between low- and high-grade CCRCCs. The optimal cutoff value of MK was 1.83 with sensitivity of 97.5% and specificity of 95.5% (Fig. 2).Discussion
The data presented in our study demonstrated that DKI had good inter- and intra-observer reproducibility of renal lesion and were sensitive for RCC detection. Kurtosis map derived from DKI might be a new reliable noninvasive biomarker to reveal the microstructure of renal lesion.8,9 Our research showed that MK and Ka values of CRCC were higher than those of CCRCC and PRCC. As CRCC has better prognosis than the latter, discrimination of CRCC from non-CRCC before treatment might assist the clinical decision. Considering the differences of DKI metrics in RCC subtypes and the common view that Fuhrman grade is more effective in predicting biological aggressiveness and metastatic potential in CCRCC than non-CCRCC, our research evaluated the correlation of DKI metrics with nuclear grade only in CCRCC. The results demonstrated that kurtosis values increased with higher CCRCC malignancy. High-grade tumors are characterized by the marked variation of nuclear pleomorphism and irregularity of nuclear membrane, which represent the increasing tissue complexity at the microstructural level, thereby manifesting higher kurtosis values.Conclusion
Our preliminary results suggested a possible role of DKI in differentiating CRCC from CCRCC and PRCC. For CCRCC, there was an increasing trend of DKI values with increasing nuclear grade.Acknowledgements
No acknowledgement found.References
1. Kang SK, Zhang A, Pandharipande PV, et al. DWI for renal mass characterization: systematic review and meta-analysis of diagnostic test performance. AJR Am J Roentgenol. 2015;205(2):317-324.
2. Grinberg F, Farrher E, Ciobanu L, et al. Non-gaussian diffusion imaging for enhanced contrast of brain tissue affected by ischemic stroke. PLoS One. 2014;9(2):e89225.
3. Jensen JH, Helpern JA, Ramani A, et al. Diffusional kurtosis imaging: the quantification of non-gaussian water diffusion by means of magnetic resonance imaging. Magn Reson Med. 2005;53(6):1432-1440.
4. Jensen JH, Helpern JA. MRI quantification of non-Gaussian water diffusion by kurtosis analysis. NMR Biomed. 2010;23(7):698-710.
5. Rosenkrantz AB, Sigmund EE, Winnick A, et al. Assessment of hepatocellular carcinoma using apparent diffusion coefficient and diffusion kurtosis indices: preliminary experience in fresh liver explants. Magn. Reson. Imaging. 2012; 30(10): 1534-1540.
6. Lawrence EM, Warren AY, Priest AN, et al. Evaluating prostate cancer using fractional tissue composition of radical prostatectomy specimens and pre-operative diffusion kurtosis magnetic resonance rmaging. PLoS One. 2016;11(7):e0159652.
7. Raab P, Hattingen E, Franz K, et al. Cerebral gliomas: diffusional kurtosis imaging analysis of microstructural differences. Radiology. 2010; 254(3): 876-881.
8. Huang Y, Chen X, Zhang Z, et al. MRI quantification of non-Gaussian water diffusion in normal human kidney: a diffusional kurtosis imaging study. NMR Biomed. 2015,28(2):154-161.
9. Pentang G, Lanzman RS, Heusch P, et al. Diffusion kurtosis imaging of the human kidney:feasibility study. Magn. Reson. Imaging. 2014,32(5): 413-420.
Figures