3400
Probing Microstructure of Brain Tumor: A NODDI Study1Institute of Neuroscience, National Yang-Ming University, Taipei city, Taiwan, 2Department of radiology, Tri-Service General Hospital, National Defense Medical Center, Taiwan, 3GE Healthcare, Taipei, Taiwan, 4GE Healthcare MR Research China, Beijing, People's Republic of China, 5Institute of Biomedical Sciences, Academia Sinica, Taiwan
Synopsis
We hypothesized that the model-based diffusion model, Neurite Orientation Dispersion and Density Imaging (
Propose
Diffusion weighted imaging (DWI) and apparent diffusion coefficient (ADC) measurements have been widely used in the diagnosis of brain tumors and projection of the cellularity [1]. Increased cellularity results in a restricted extracellular space and thus decreased ADC values. Although the ADC values could serve as an informative indicator of the cellularity, the interpretation should be put with caution. In addition to cellularity, various factors in the heterogeneous microenvironment of the tumor might affect the ADC value, leading to inconsistent results [2]. A recently proposed model-based diffusion model, Neurite Orientation Dispersion and Density Imaging (NODDI), is promising in characterizing microstructures of the brain tissue [3]. This multi-compartment model considering intra- and extracellular as well as isotropic space could provide unique contrast across the brain tumor, which is different from that on conventional diffusion models [4]. In this study, NODDI model was used to probe microstructures of brain tumors of different types and gradings.Methods
A total of 16 patients with brain tumors (7 WHO grade I meningiomas, 3 WHO grade II meningiomas, 3 WHO grade II/III gliomas and 3 glioblastomas) underwent 3T MRI scanning (Discovery MR 750, GE Healthcare, Milwaukee, USA) with a diffusion scheme of multiple b values in 99 directions (TR/TE = 6000/88 ms, maximal b-value = 2000s/mm2, voxel size = 2.5x2.5x2.5 mm3). All DWI images were processed with motion and distortion correction by FSL (an open source software for neuroimaging analysis, https://fsl.fmrib.ox.ac.uk/fsl/fslwiki) and fitted into NODDI model (processed with matlab NODDI toolbox, http://mig.cs.ucl.ac.uk/mig/mig/index.php/?n=Tutorial.NODDImatlab/). Three effective volume fraction (VF) of NODDI (intracellular VF, VFic, extracellular VF, VFec and isotropic VF, VFiso; where VFic + VFec + VFiso = 1) and ADC values were calculated. Region of interests (ROIs) were manually drawn around the solid part of the tumor by an experienced neuroradiologist. Since the tumor sizes were different, we randomly selected an equal number of voxels in the ROIs. One way ANOVA with post hoc analyses were employed to compare NODDI VFs and ADC values among different types and grades of brain tumors. Significance was assigned at 2-sided P value < .05.Results
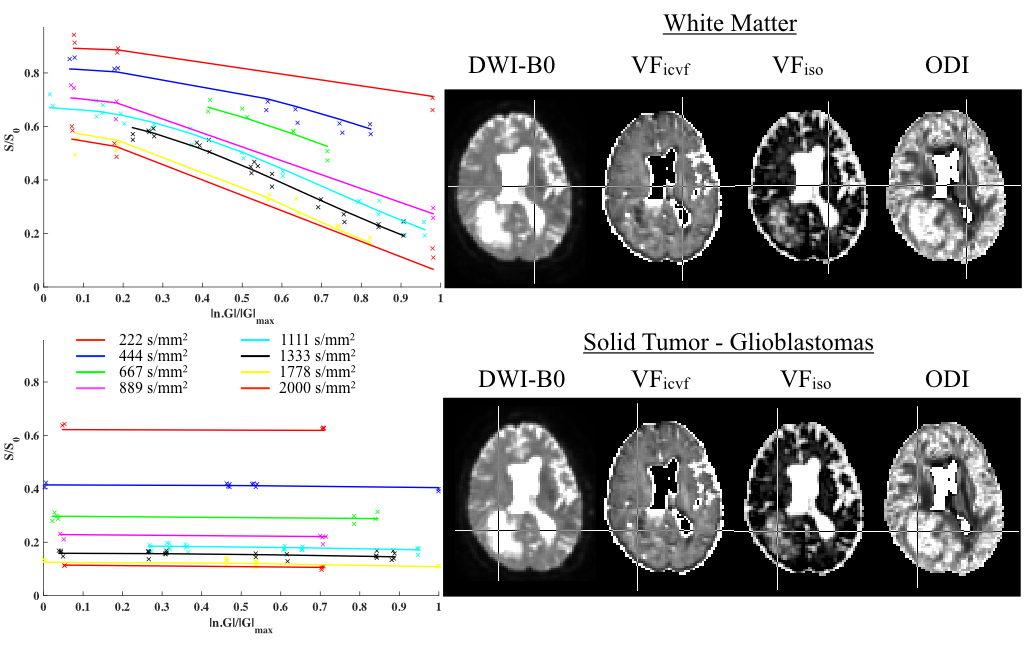
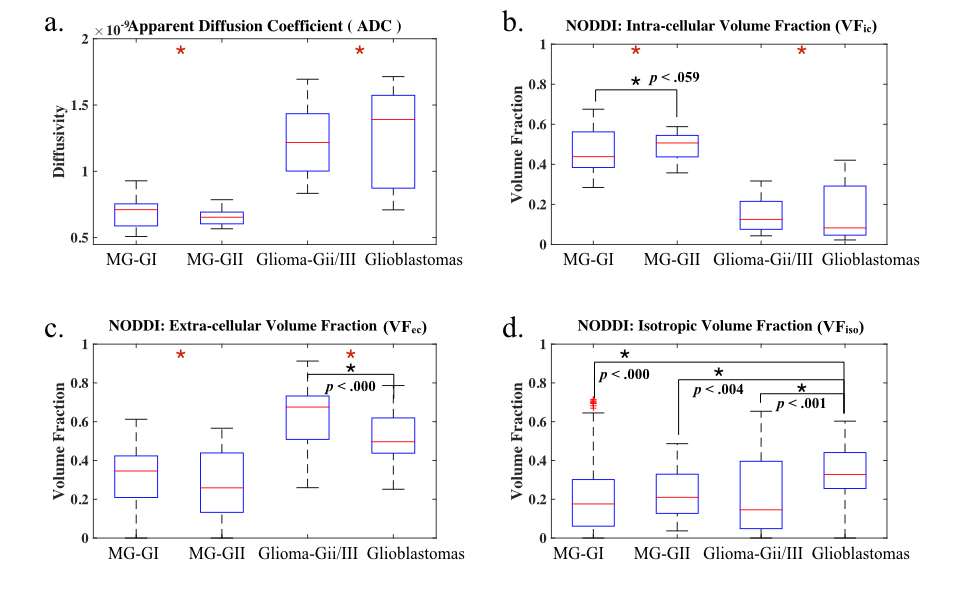
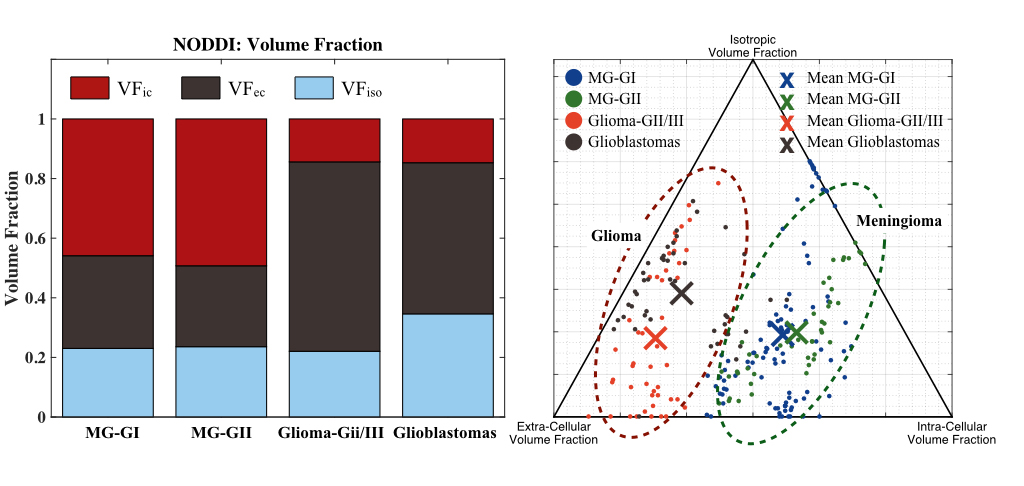
NODDI provided a good fit in our dataset (Figure 1). In a conventional diffusion model, ADC values of meningiomas were significantly lower than those of giomas (Figure 2a). In the NODDI model, the two groups showed significant differences in VFic and VFec. In ANOVA with post hoc analyses, the Fic of WHO grade II meningiomas was marginally higher than that of WHO grade I meningiomas (Fisher's least significant differences, LSD, P = .059; Figure 2b). Besides, VFec was significantly lower in glioblastoma groups than in the glioma of lower grades (LSD, P <.001; Figure 2c). Glioblastoma showed significantly higher VFiso as compared with other groups of different tumor types and grades (Figure 2d). All the NODDI indices and mean VF were plotted in a 2-dimensional barycentric coordinate system to visualize distributions of the VFs of different groups (Figure 3).Discussion
Our results suggested that the model-based diffusion model, NODDI, could provide different microstructure information of brain tumors in comparison with conventional diffusion models. The different VFs between different grades of glioma might help accurate diagnoses. The relationship among the VF, tumor microenvironment and cellularity should be verified in histopathological study.Conclusion
Both VFic and VFec show great potential to probe the cellularity of brain tumors. The NODDI analysis might help to probe different microstructures in different tumor types and gradings.Acknowledgements
No acknowledgement found.References
1. Surov A, Ginat DT, Sanverdi E, Lim CCT, Hakyemez B, Yogi A, et al. Use of Diffusion Weighted Imaging in Differentiating Between Maligant and Benign Meningiomas. A Multicenter Analysis. World Neurosurgery. 2016;88:598–602.
2. Santelli L, Ramondo G, Puppa Della A, Ermani M, Scienza R, d’Avella D, and Manara R. Diffusion-weighted imaging does not predict histological grading in meningiomas. Acta Neurochirurgica. 2010;152(8): 1315–1319.
3. Zhang H, Schneider T, Wheeler-Kingshott CA, and Alexander DC. NODDI: Practical in vivo neurite orientation dispersion and density imaging of the human brain. NeuroImage. 2012;61(4):1000–1016.
4. Wen Q, Kelley DAC, Banerjee S, Lupo JM, Chang SM, Xu D, et al. Clinically feasible NODDI characterization of glioma using multiband EPI at 7 T. Ynicl. NeuroImage. 2015;9:291–299.
Figures