3399
A unified signal readout for reproducible multimodal characterisation of brain microstructure1UCL Institute of Neurology, Queen Square MS Centre, University College London, London, United Kingdom, 2Translational Imaging Group, Centre for Medical Image Computing, Department of Medical Physics and Biomedical Engineering, University College London, London, United Kingdom, 3Philips UK, Guildford, Surrey, United Kingdom, 4Centre for Medical Image Computing, Department of Computer Science, University College London, London, United Kingdom, 5Department of Brain and Behavioural Sciences, University of Pavia, Pavia, Italy, 6Brain MRI 3T Mondino Research Center, C. Mondino National Neurological Institute, Pavia, Italy
Synopsis
Multimodal imaging is very promising for characterising brain microstructure in vivo, but it is usually performed employing a variety of signal readouts, which disrupts the spatial correspondence of the multimodal features. Here we demonstrate a multimodal imaging protocol for detailed characterisation of brain microstructure with unified single-shot EPI readout. Our aim is to provide macromolecular volume via inversion recovery spin echo, neurite morphology via diffusion imaging in close spatial alignment and thus to combine those for estimating myelin g-ratio. We show that our protocol enables the evaluation of parametric maps with high reproducibility that capture biological differences among healthy subjects.
Purpose
Quantitative magnetic resonance imaging offers promising metrics for the characterisation of tissue microstructure in the human brain1. While no single modality captures in full the complexity of living tissues, multimodal approaches exploit multiple contrasts providing complementary information. However, multimodal imaging often relies on a variety of signal readouts and their different sensitivity to inhomogeneities, motion and physiological noise can limit the accuracy of the correspondence of the multimodal features2.
Here we obtain for the first time reliable multimodal indices with a unified single-shot echo planar imaging (EPI) signal readout. Our protocol allows the estimation of macromolecular volume, neuronal morphology and, combining those, myelin g-ratio, for all of which we quantify scan/rescan reproducibility.
Methods
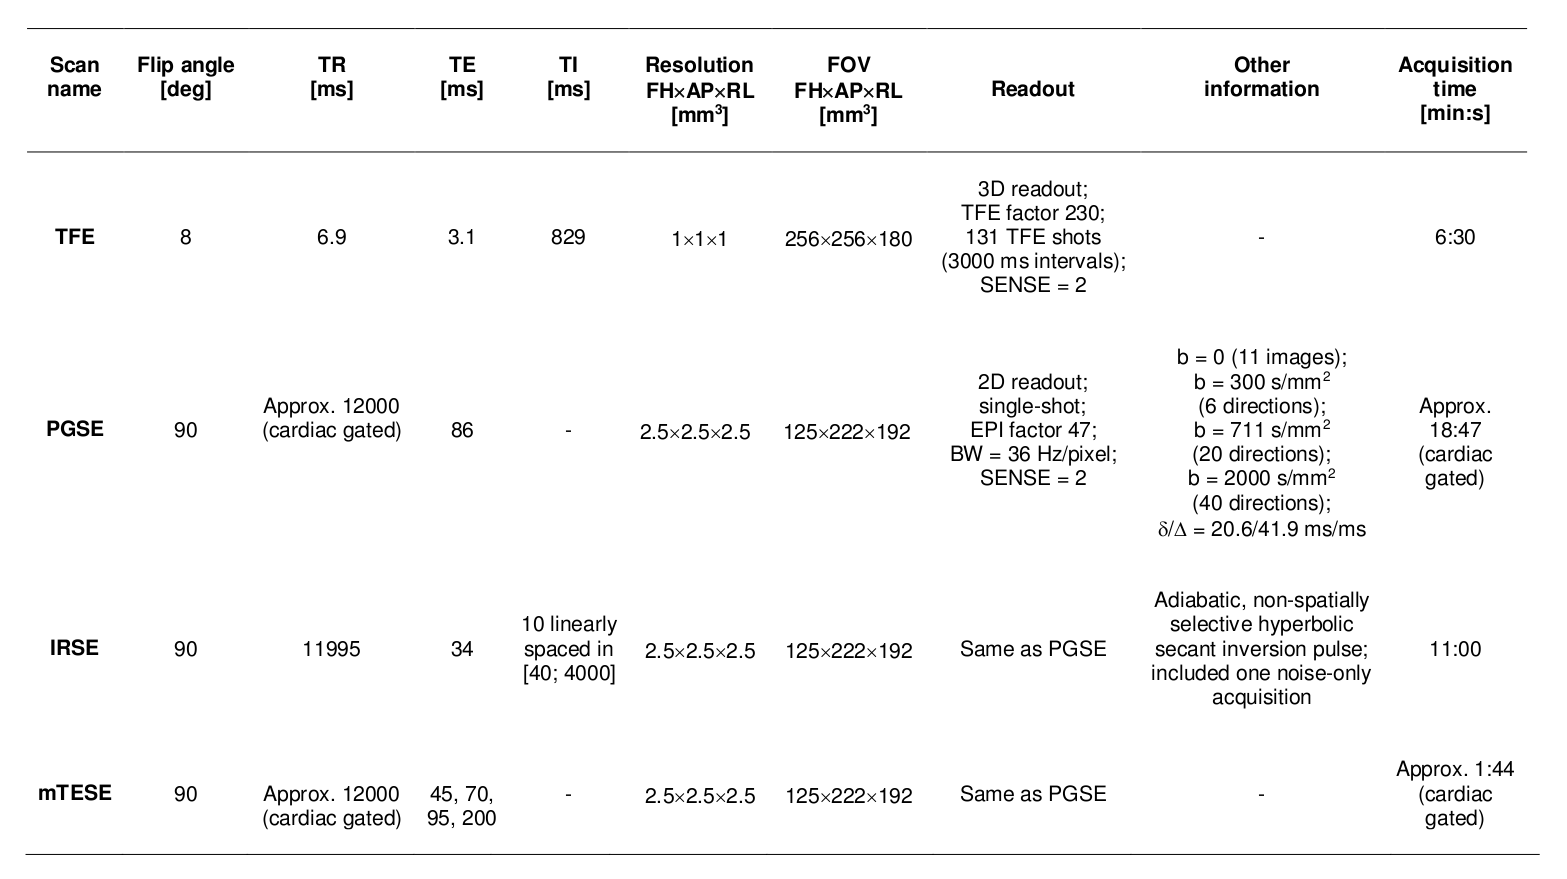
Imaging 5 healthy volunteers (2 females, age range 27-36) were scanned twice on a 3T Philips Achieva MRI system. The MRI protocol, reported in figure 1 (nominal duration: 41 minutes), included: i) an anatomical T1-weighted turbo field echo (TFE) scan; ii) a multi-shell diffusion-weighted (DW) pulsed gradient spin echo (PGSE) scan (with 1 extra non-DW acquisition with reversed phase encoding direction); iii) an inversion recovery spin echo scan (IRSE, 10 inversion times); iv) 4 non-DW images acquired with different echo times (multi-TE spin echo, mTESE).
Preprocessing The PGSE images were denoised with MRtrix3 dwidenoise3 and corrected for eddy currents, distortions and motion with FSL topup and eddy4. The distortion field was used to unwarp all EPI images. Finally, each subject's anatomical scan was segmented with GIF5, and linearly co-registered to the EPI space with NiftyReg6 reg_aladin.
Metric calculation Voxel-wise quantitative T1/T2 and apparent proton density (PD) were obtained fitting mono-exponential recovery/decay curves to the IRSE/mTESE data. IRSE-derived PD was processed alongside T1 and T2 following a published method7 to obtain macromolecular total volume (MTV; MTV = 1 – PD/PDCSF). The PGSE data were analysed with multi-compartment spherical mean technique8, obtaining an index of neurite density (ND) and of neural diffusivity (D). Finally, ND and MTV were combined in white matter to estimate myelin g-ratio9.
Reproducibility Anatomical scans from each visit were non-linearly co-registered with NiftyReg reg_f3d to create a common space to which maps were warped. A two-way mixed effects model was fitted voxel-wise, providing each metric total variance (S2TOT), population mean μ and intraclass correlation coefficient (ICC, i.e. fraction of S2TOT due to biological differences). A percentage coefficient of variation (COV) was calculated from S2TOT and μ.
Results
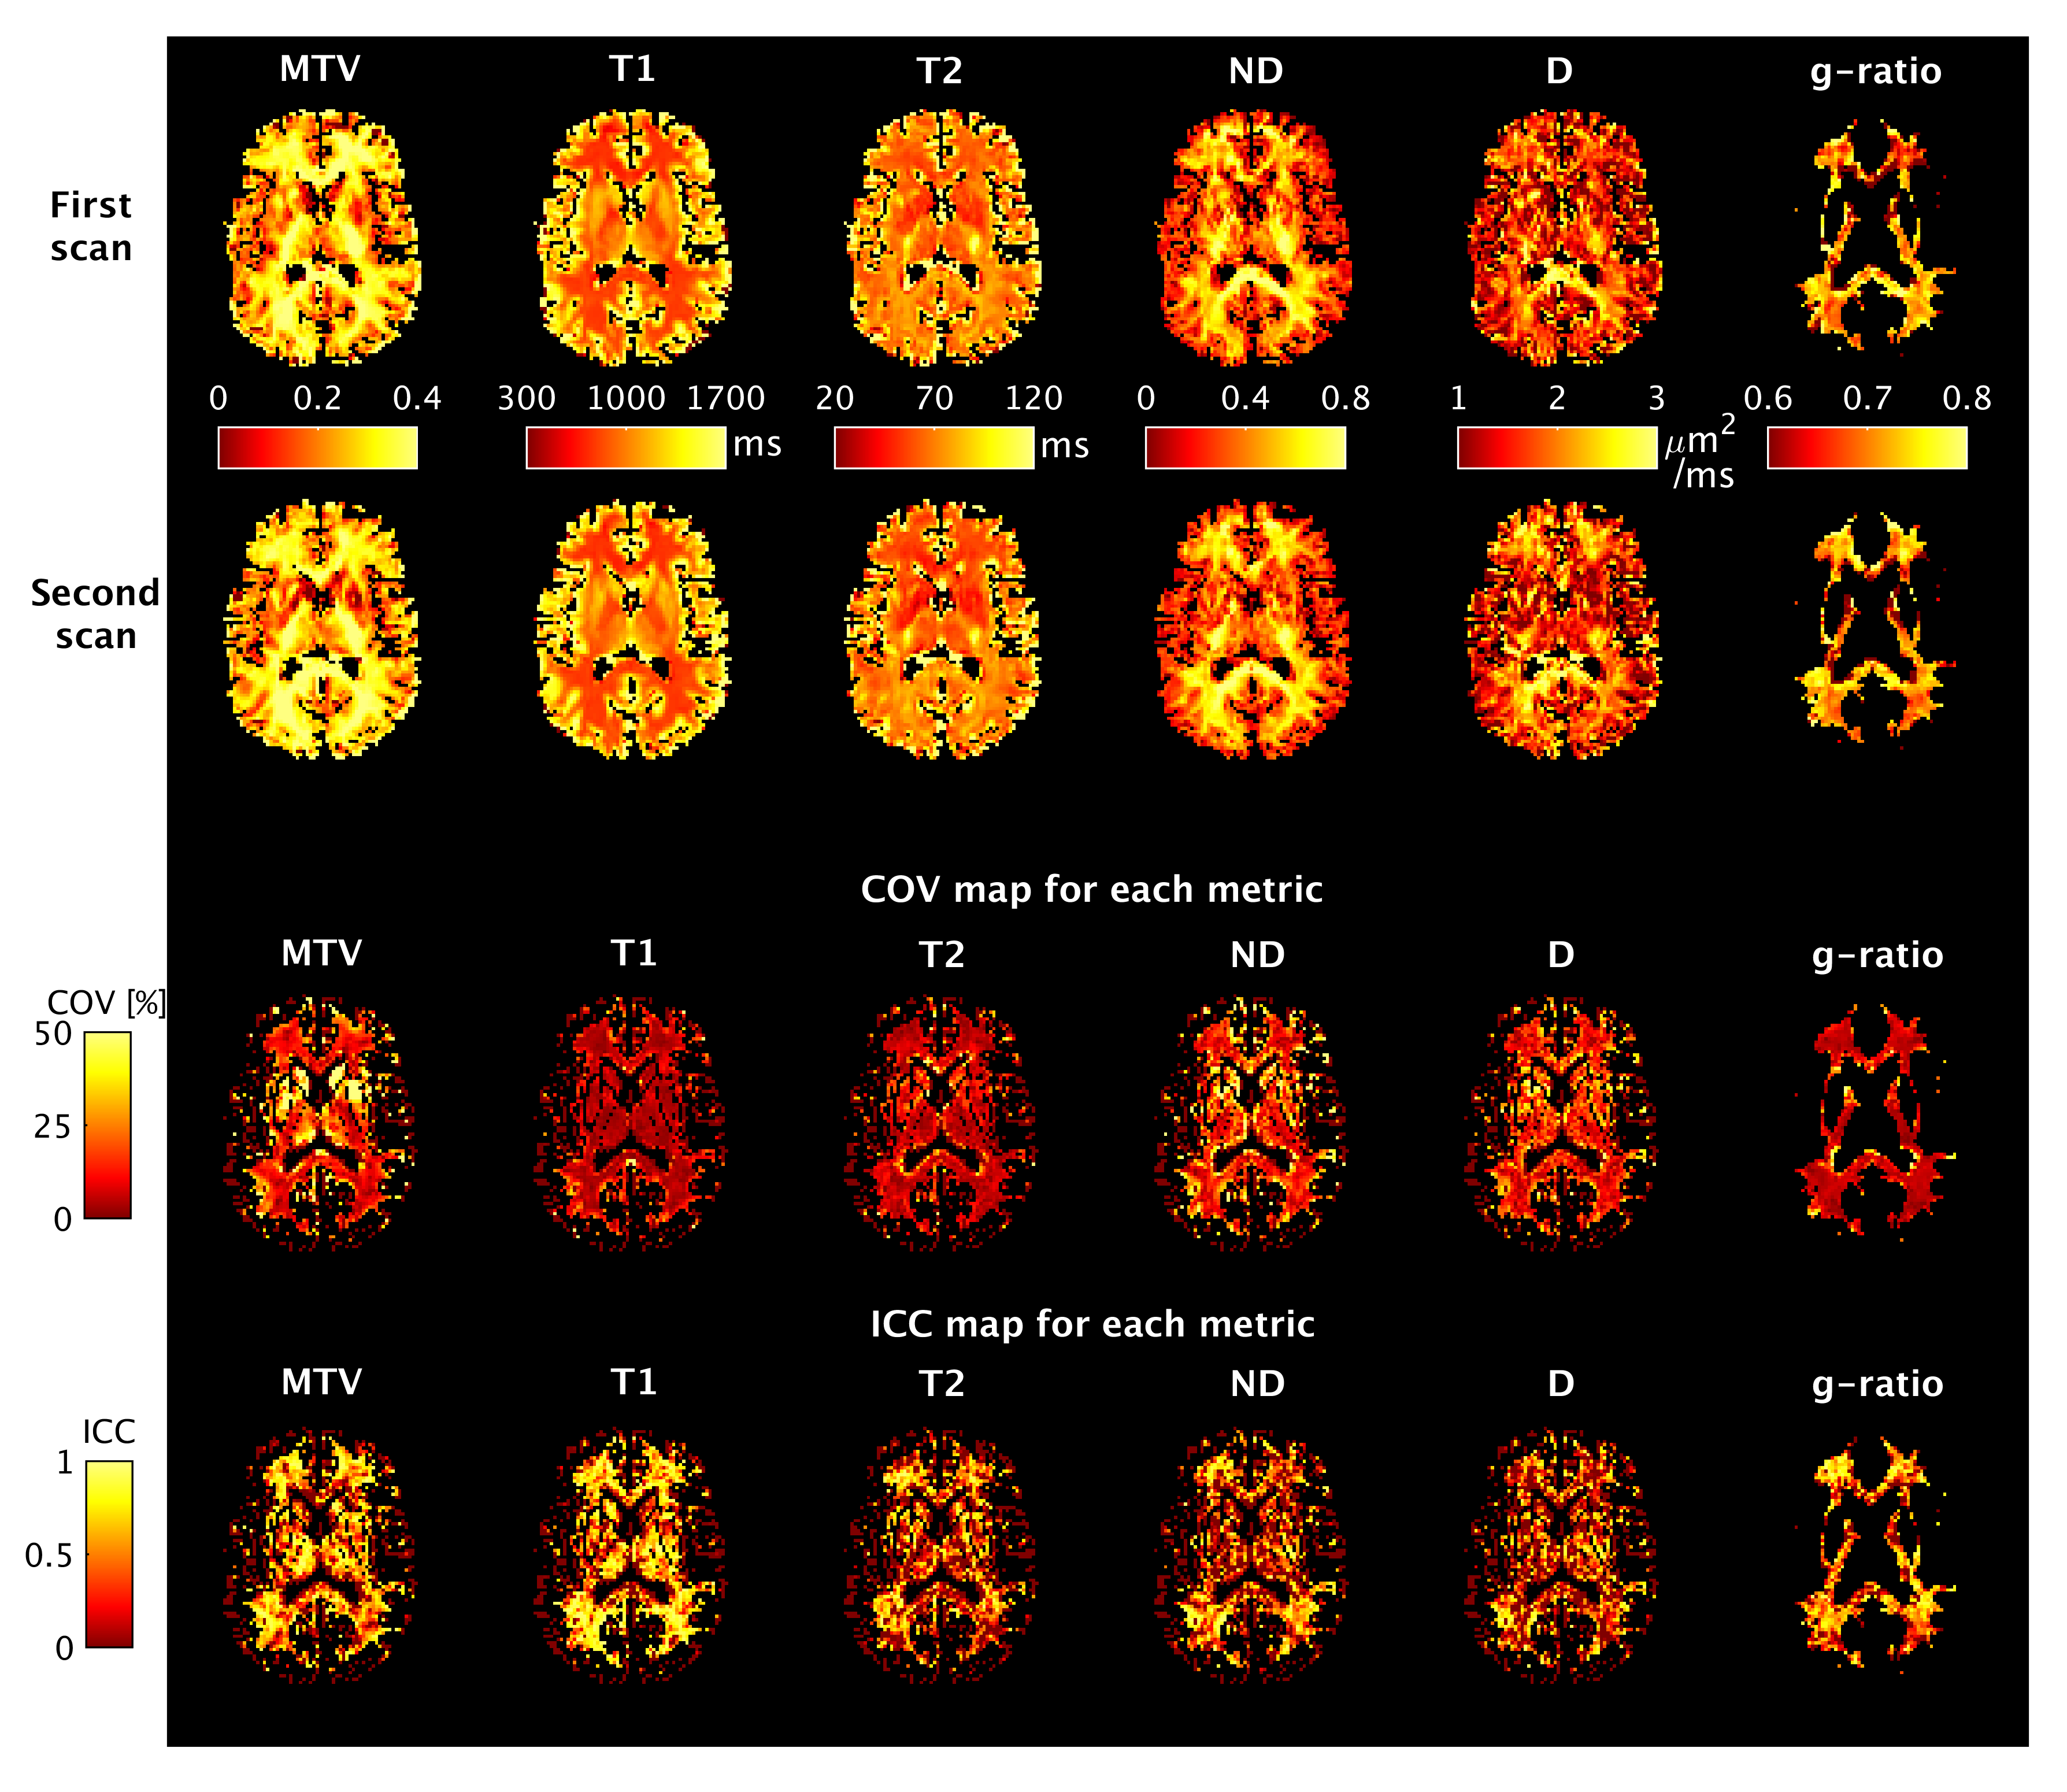
Figure 2 shows single-slice examples of co-registered parametric maps from one subject. Overall, there is good qualitative correspondence between scan and rescan. We observe between-tissue contrast (higher T1, T2 and lower MTV in grey than in white matter) and within-tissue differences (ND and D). MTV and g-ratio values agree with previous literature1,2,7,9. COV and ICC vary across metrics, showing a dependency on tissue type.
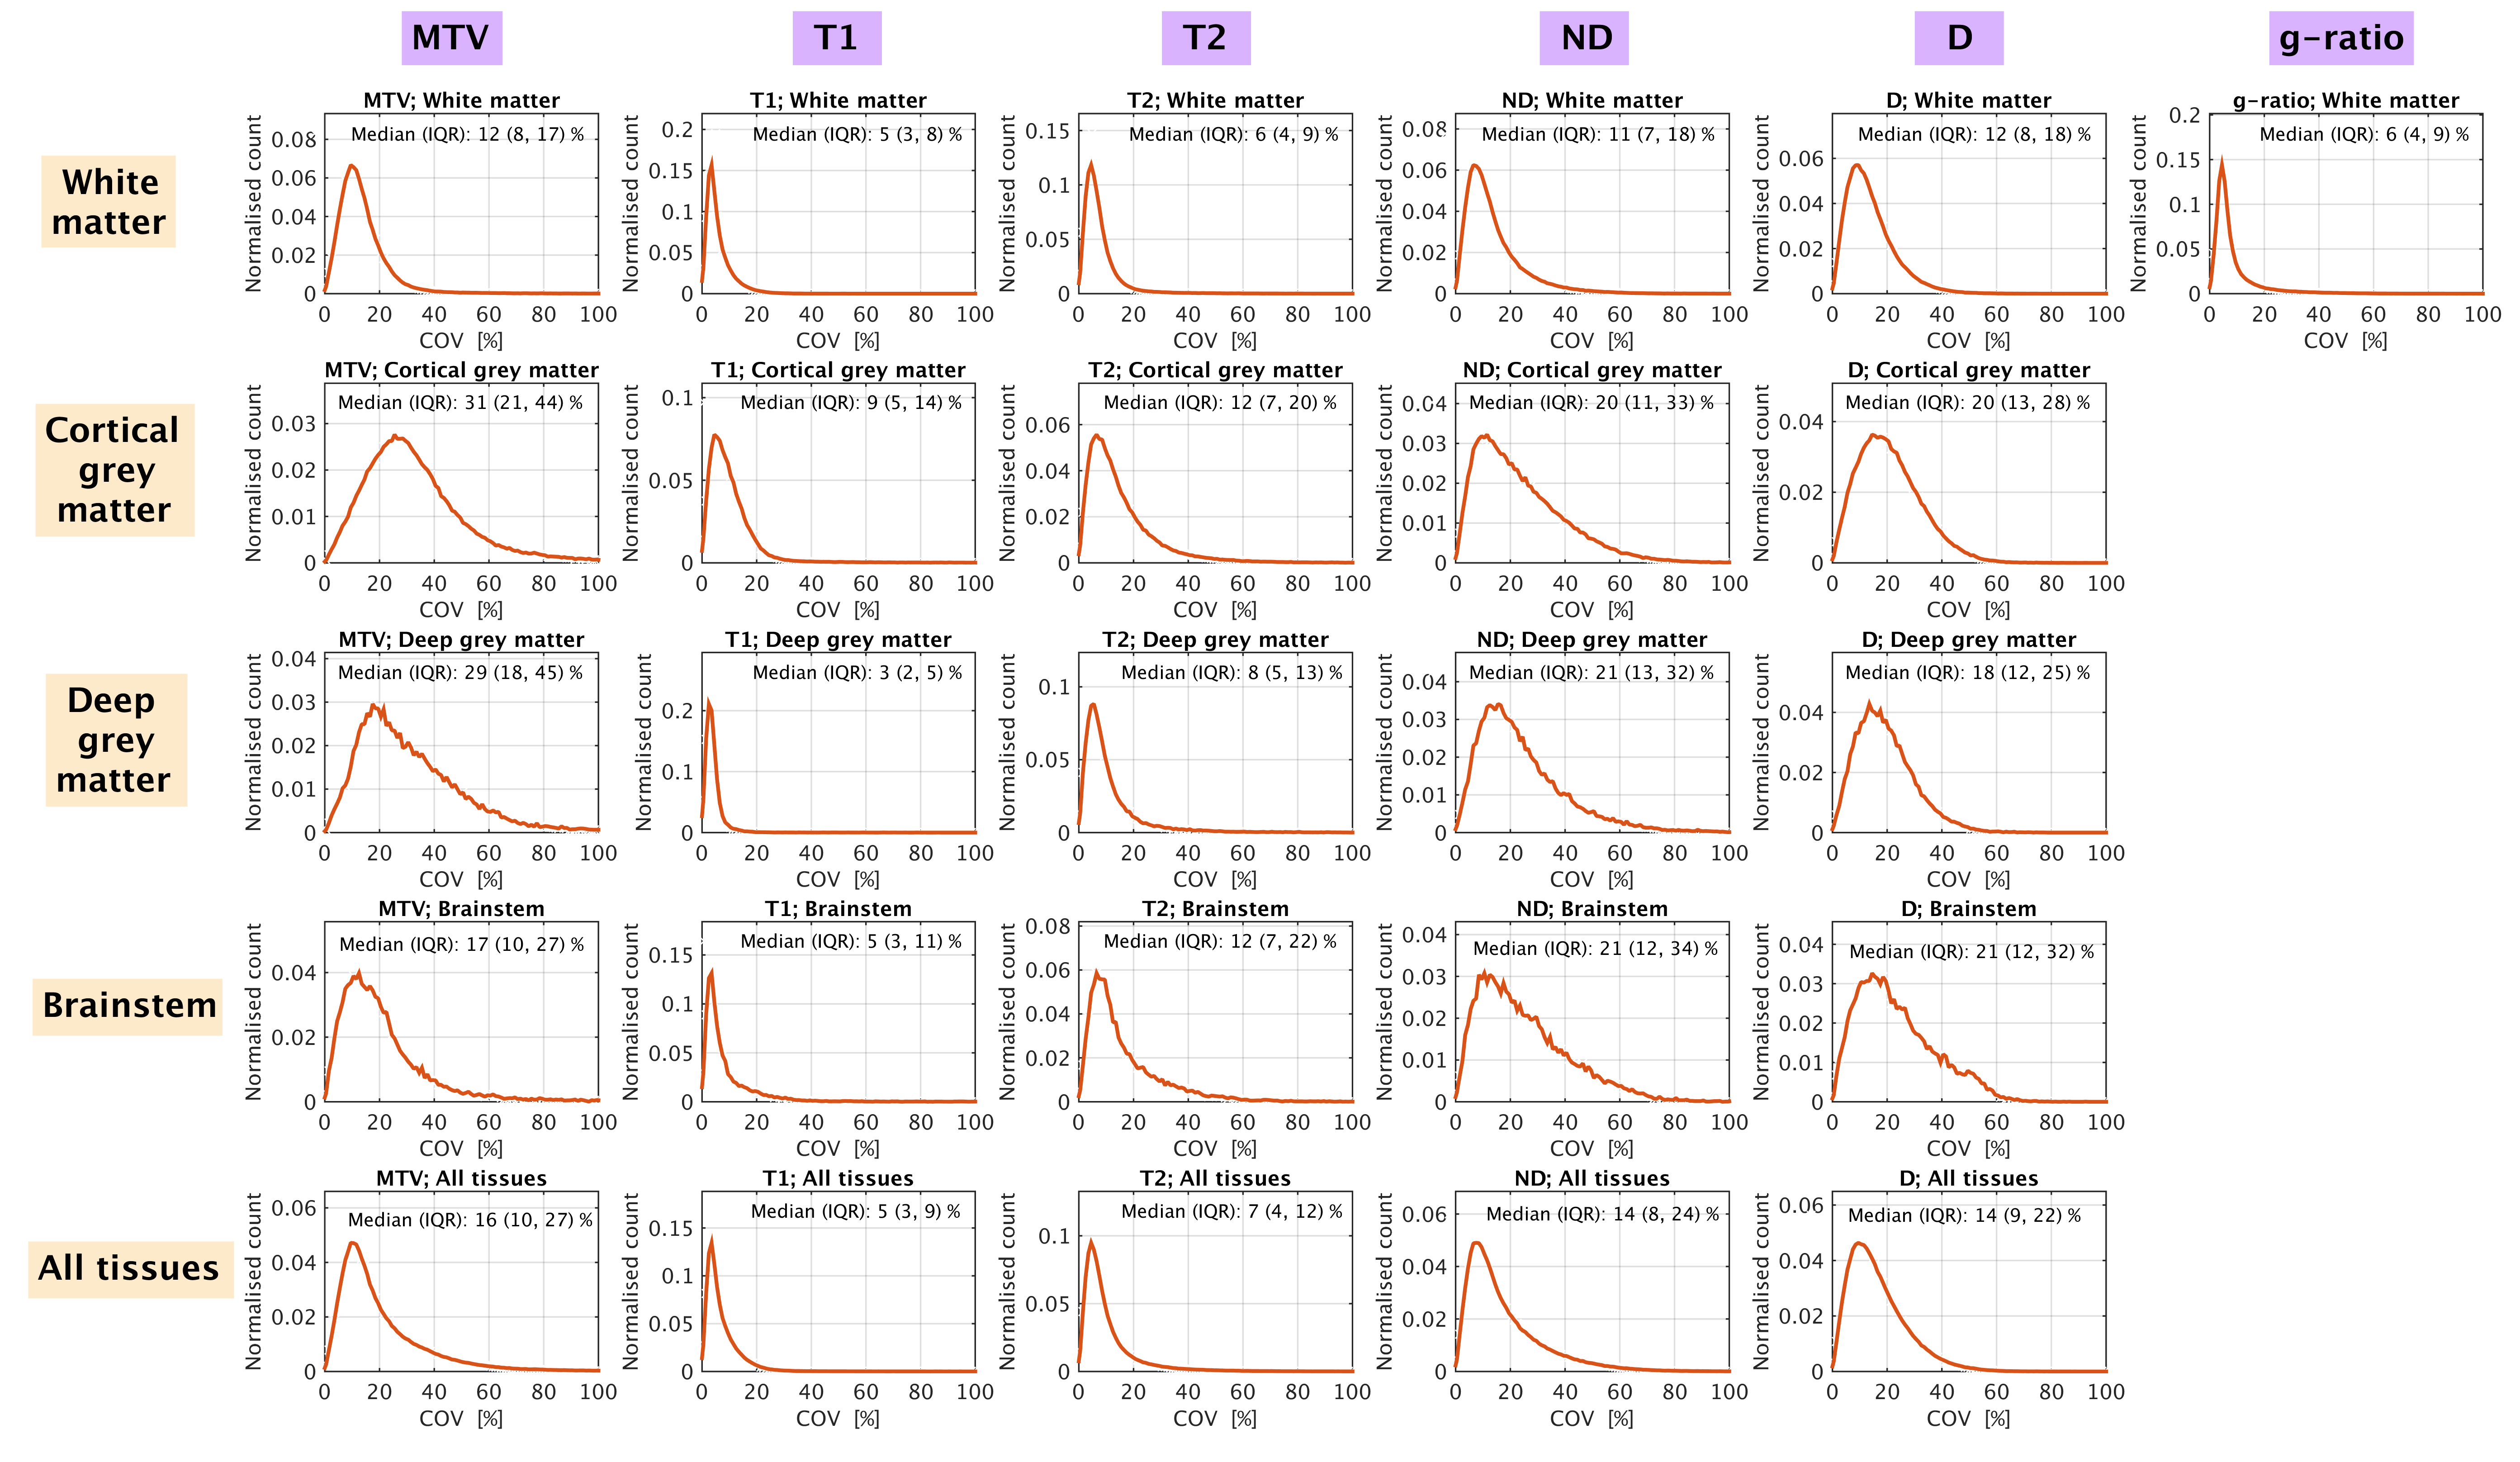
Figure 3 shows tissue-specific distributions of COV (quantifying the sum of biological-induced and error-induced variability). The median COV hits its peak in cortical grey matter for MTV (31%) and is minimum for T1 in cortical grey matter (3%). T1, T2 and g-ratio show lower values of COV (median COV always lower than 13%), whereas COV is higher for ND, D and MTV (median COV always at least of 12%).
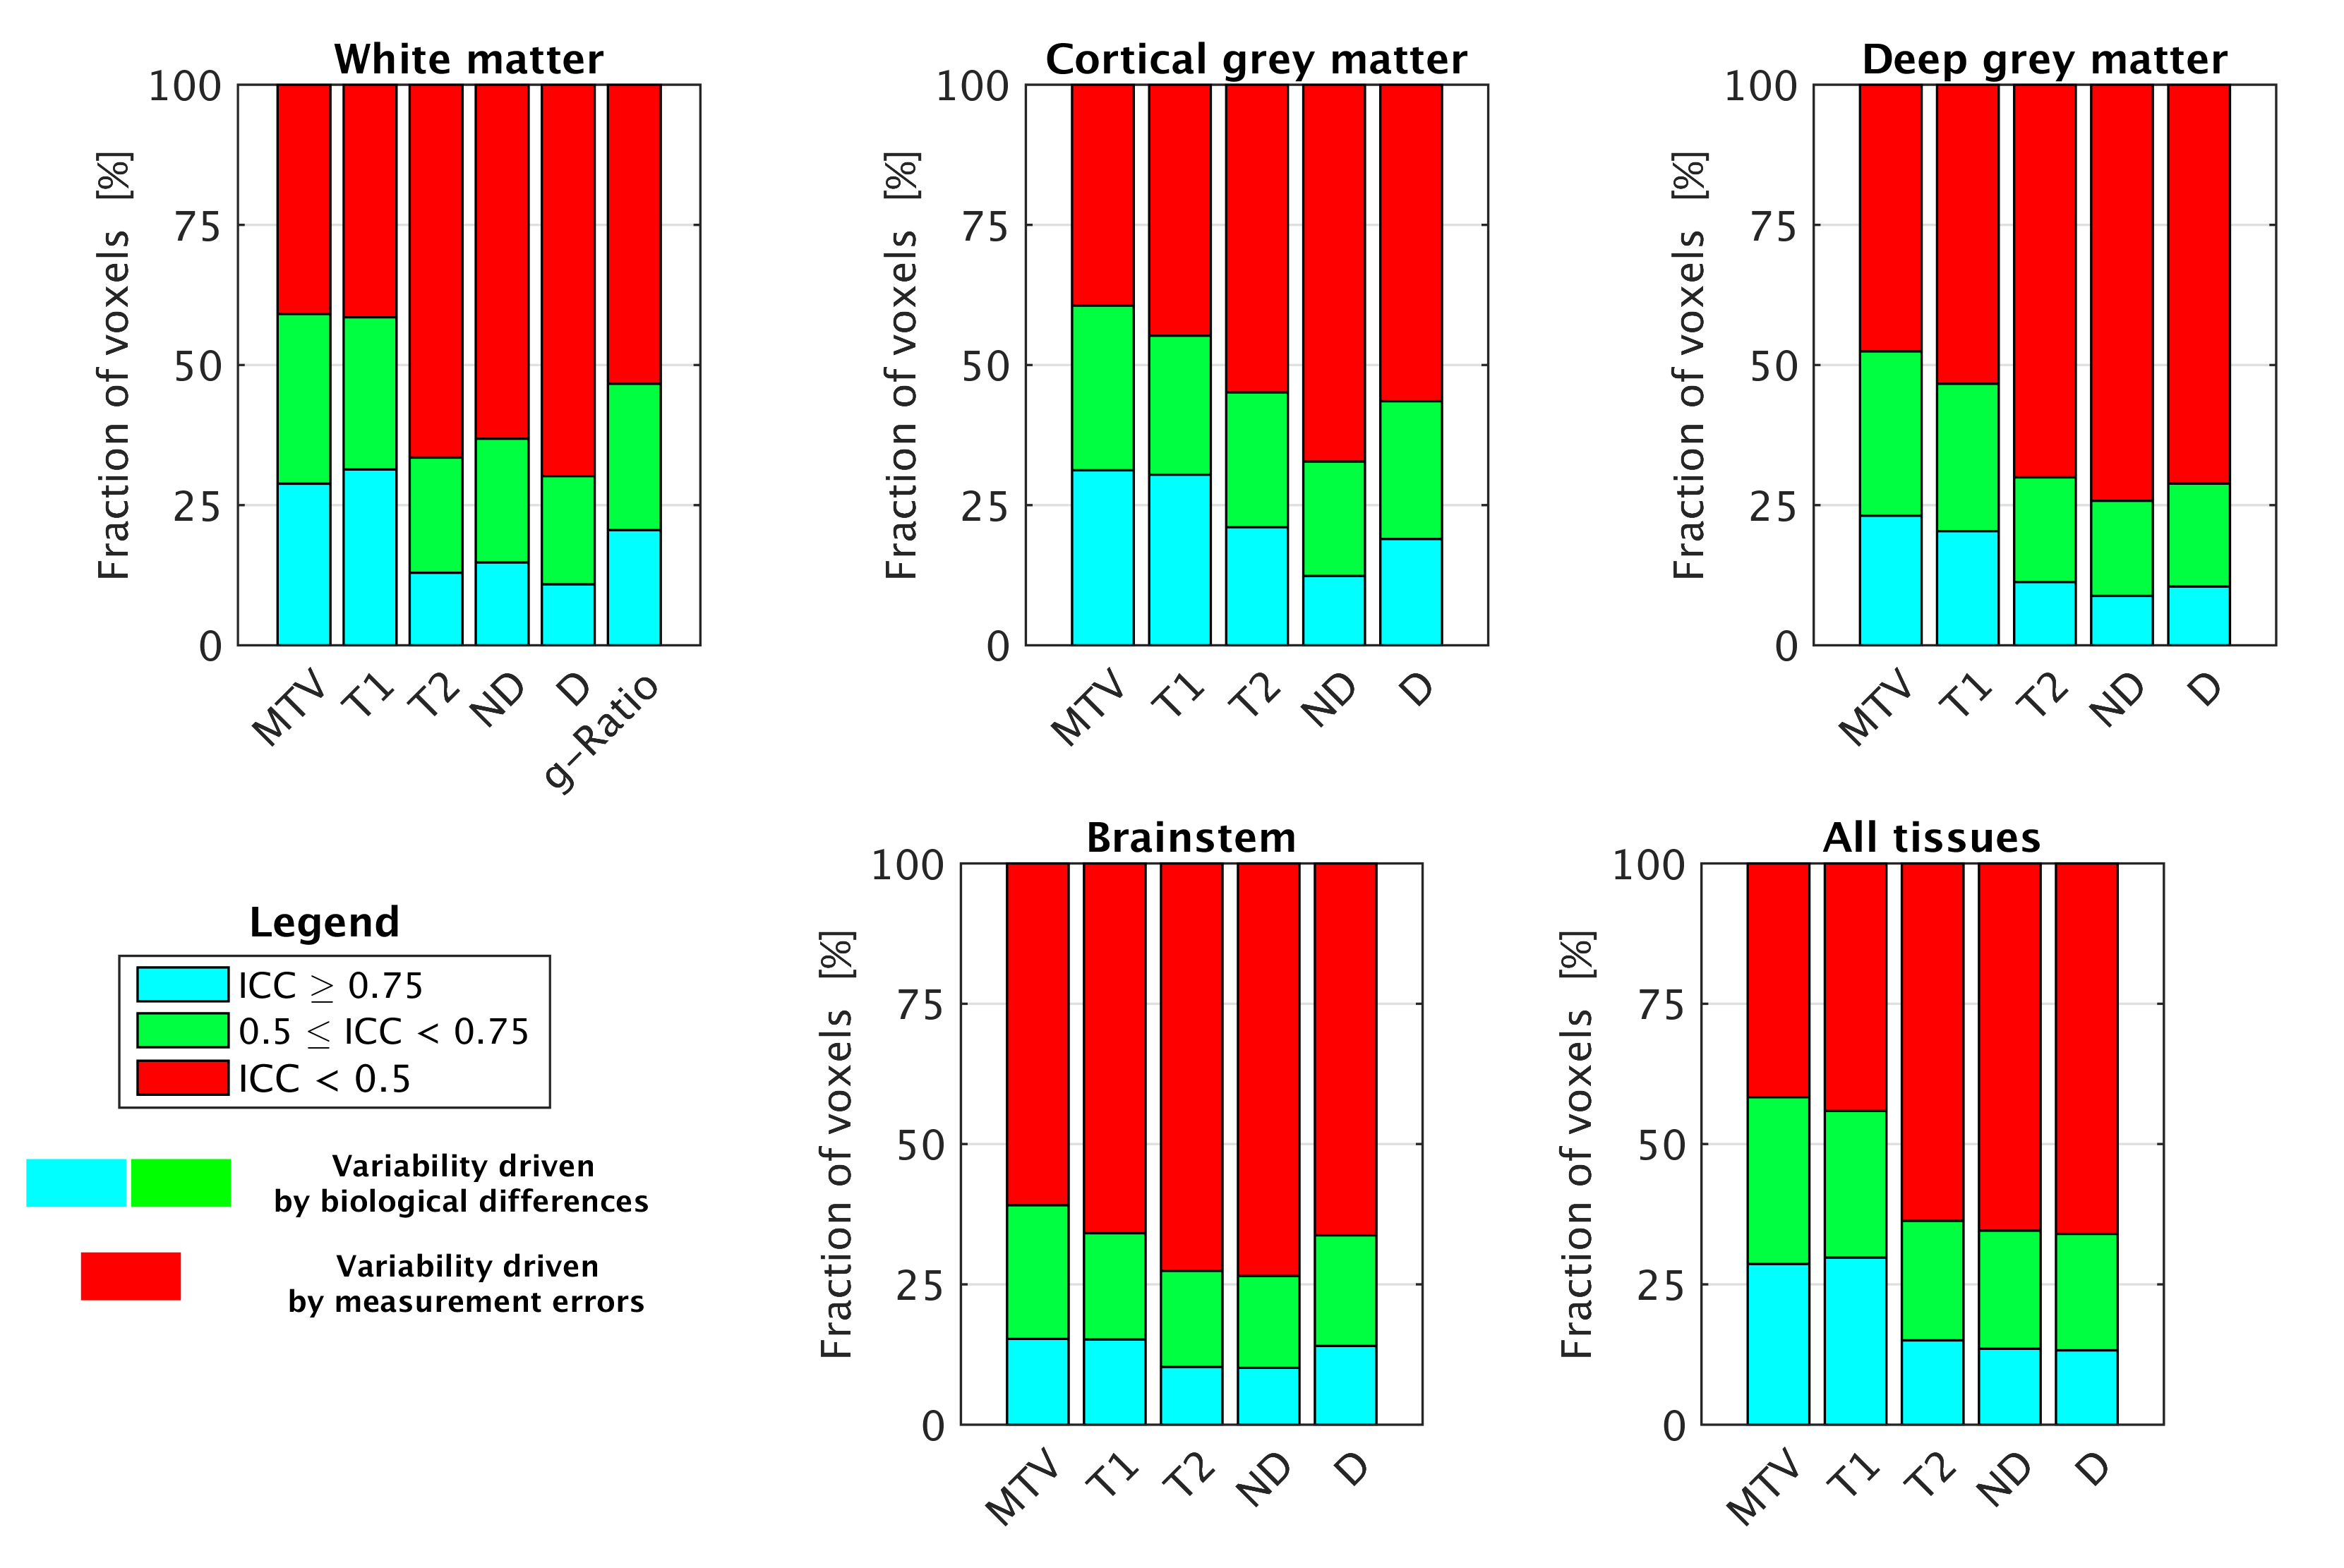
Figure 4 shows tissue-specific distributions of ICC. For MTV, T1 and g-ratio, in half of the voxels or more the total variability is driven by biological differences (ICC > 0.5). For T2, ND and D measurement errors are more relevant (higher proportion of voxels with ICC < 0.5).
Discussion
We have investigated whether multimodal data providing several quantitative indices of brain microstructure can be obtained in reasonable scan times with a unified readout.
Our work proposes a reliable framework for measuring diffusion and relaxometry properties using a common EPI readout for inherent co-localisation. Also, we show for the first time that a recent method7 for MTV estimation can be employed with IRSE data. IRSE-derived MTV agrees with previous literature7,9 and is suitable for highly reproducible g-ratio mapping. Measurement errors (including those coming from generating a common space for reproducibility analysis) drive the total variability in a notable fraction of voxels. This is not surprising given the modest biological variation expected in a cohort of young healthy volunteers (highest median COV of 31%, observed for MTV in cortical grey matter).
Conclusion
We have demonstrated that multimodal imaging with unified EPI readout enables reliable characterisation of brain microstructure in vivo. Future work is warranted to compare the proposed protocol to other approaches in neurological conditions, as well as to reduce the scan time.Acknowledgements
The help of all volunteers. Horizon2020-EU.3.1 CDS-QUAMRI (ref: 634541). ISRT, WfL & CHNF (INSPIRED). UK MS Society. NIHR BRC UCLH/UCL High Impact Initiative (BW.MN.BRC10269). EPSRC (N018702, M020533, I027084, G007748, EP/H046410/1, EP/J020990/1, EP/K005278). MRC (MR/J01107X/1).References
[1] Stikov N, Campbell JSW, Stroh T, et al. In vivo histology of the myelin g-ratio with magnetic resonance imaging. NeuroImage 2015; 118: 397-405.
[2] Mohammadi S, Carey D, Dick F, et al. Whole-brain in-vivo measurements of the axonal g-ratio in a group of 37 healthy volunteers. Front Neurosc 2015; 9: 441.
[3] Veraart J, Novikov DS, Christiaens D, et al. Denoising of diffusion MRI using random matrix theory. NeuroImage 2016; 142: 394-406.
[4] Andersson JLR and Sotiropoulos SN. An integrated approach to correction for off-resonance effects and subject movement in diffusion MR imaging. NeuroImage 2016; 125:1063-1078.
[5] Cardoso MJ, Modat M, Wolz R, et al. Geodesic information flows: spatially-variant graphs and their application to segmentation and fusion. IEEE Trans Medical Imaging 2015; 34(9): 1976-1988.
[6] Modat M, Cash DM, Daga P, et al. Global image registration using a symmetric block-matching approach. J Med Imaging 2014; 1(2): 024003.
[7] Volz S, Nöth U, Jurcoane A, et al. Quantitative proton density mapping: correcting the receiver sensitivity bias via pseudo proton densities. NeuroImage 2012; 63(1): 540-552.
[8] Kaden E, Kelm ND, Carson RP, et al. Multi-compartment microscopic diffusion imaging. NeuroImage 2016; 139: 346-359.
[9] Duval T, Lévy L, Stikov N, et al. g-ratio weighted imaging of the human spinal cord in vivo. NeuroImage 2016; in press.
Figures