3397
Negentropy: non-Gaussian characterization for Diffusion Spectrum Imaging1Biomedical Imaging Center, Santiago, Chile, 2German Center of Neurodegenerative Diseases (DZNE), Bonn, Germany, 3University of Bonn, Bonn, Germany, 4Department of Biomedical Engineering, Pontificia Universidad Católica de Valparaíso, Valparaíso, Chile, 5Department of Electrical Engineering, Pontificia Universidad Católica de Chile, Santiago, Chile
Synopsis
Measuring non-Gaussianity in the diffusion signal has revealed new possibilities for discovering new biomarkers for clinical applications. Therefore, it results desirable to incorporate and quantify the non-Gaussian trait of the diffusion propagator in Diffusion Spectrum Imaging. Unfortunately, the established index known as Kurtosis is sensitive to noise, making it unfeasible to obtain from the noisier, but higher resolution propagator. In this work, we propose an alternative index known as Negentropy. We demonstrate from noisy simulations and in-vivo DSI data the robustness of the Negentropy index against Kurtosis.
Target Audience
Researchers interested in characterization of the diffusion probability distribution.Purpose
To compare an established and a novel index for measuring the non-Gaussianity in DSI data: Kurtosis versus Negentropy.Introduction
Diffusion Kurtosis Imaging (DKI) 1 uses the Kurtosis to take into account the deviation from the Gaussian model, providing a more accurate fit to the diffusion data. It has been shown that DKI reveals additional information for clinical applications 2. However, the computation of the second and fourth moments is sensitive to noise, which makes troublesome to apply to high q-value data collected in Diffusion Spectrum Imaging (DSI) 3.
We propose to use the Negentropy 4 as an alternative index to measure non-Gaussianity. Although Negentropy is the optimal measurement in theory, it cannot generally be used because it requires the covariance matrix of the random variable $$$\mathbf{r} $$$ (spatial resolution). However, given that DSI explicitly obtains the distribution of displacements $$$ p(\mathbf{r}) $$$, it is feasible to compute the covariance matrix from the diffusion propagator. In this work we show that Negentropy is much more robust than Kurtosis obtained from DSI data in the presence of noise.
Methods
We define Negentropy as $$$ nG(p(\mathbf{r})) = H(g(\mathbf{r})) - H(p(\mathbf{r})) $$$, where $$$ g(\mathbf{r}) $$$ is a Gaussian pdf with the same covariance $$$ \Sigma $$$ as $$$ p(\mathbf{r}) $$$, and $$$H$$$ is the entropy defined as $$$ H(p(\mathbf{r})) = - \sum{p(\mathbf{r})\log_2{(p(\mathbf{r}))}} $$$. The covariance $$$ \Sigma $$$ is obtained by fitting a Gaussian distribution to the data with a least squares optimization. In this way, we avoid the estimation of $$$ \Sigma $$$ directly from the method of moments which is sensitive to noise.
For the Kurtosis $$$ \bar{K} $$$, we use the average of the Kurtosis computed along different directions,
$$ \bar{K} = \frac{1}{4\pi}\frac{1}{N} \sum_{\mathbf{n} \in \Omega}^{N}{K_{\mathbf{n}}(p(\mathbf{r})) } $$
where N is the cardinality of the set of directions $$$ \Omega $$$ (for simplicity we used the three orthogonal directions) and $$$ K_{\mathbf{n}}(p(\mathbf{r})) $$$ is the Kurtosis computed along the direction of the unit vector $$$ \mathbf{n} $$$:
$$ K_{\mathbf{n}}(p(\mathbf{r})) = \frac{ \int{p(\mathbf{r}) (\mathbf{r} \cdot \mathbf{n})^4 d\mathbf{r}} }{ (\int{p(\mathbf{r}) (\mathbf{r} \cdot \mathbf{n})^2 d\mathbf{r} })^2 }$$
We
computed these indices for synthetic data according to one and two 60-degree
crossing fibers using a Monte Carlo approach (Camino software 5). We
simulated a Rician-distributed signal adding Gaussian noise to each of the two
channels of the original diffusion signal, so that $$$ P(\mathbf{q}) = \sqrt{(P_{simulation}(\mathbf{q}) + \epsilon_1)^2 + \epsilon_2^2} $$$ , where $$$ε_1, ε_2$$$ ∼ N(0, σ) and σ = 1/SNR 6. $$$P(\mathbf{q})$$$ and $$$p(\mathbf{r})$$$ are a Fourier pair. We used for our simulations SNR = {50, 45,
..., 5}. For each noisy simulated signal, we computed the
Negentropy and the Kurtosis index. The non-Gaussian quantification from
noise-free simulations was considered as the ground truth. We also used in-vivo
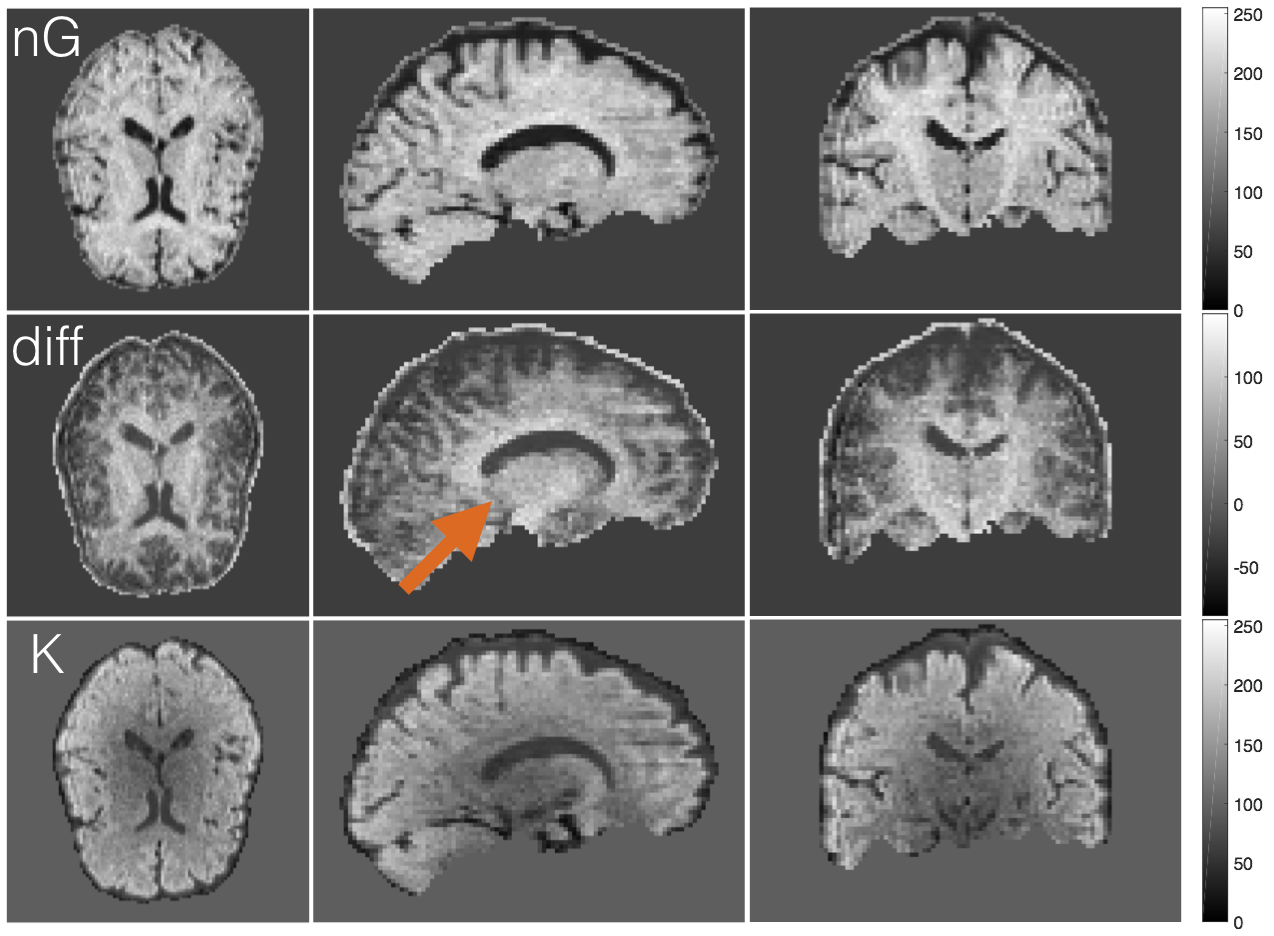
data to create a Negentropy map (nG-map) and a mean Kurtosis map ($$$ \bar{K} $$$-map) to appreciate the
relative differences between them. Maps were rescaled to allow direct
comparison. The in-vivo data was acquired using a 3T Siemens Prisma scanner
with $$$G_{max}$$$ =
80 mT/m and $$$SR_{max} $$$ = 200 T/m/s. Monopolar diffusion encoding was done with δ = 31 ms and ∆
=43.2 ms, qmax =
62.21 mm−1 or
bmax =
6600 s/mm$$$^{2}$$$,
in a sequence with TE = 88 ms, TR = 4.5 s and isotropic resolution of 2.0 mm.
Synthetic and real data were processed in a 11x11x11 q-space grid.
Results
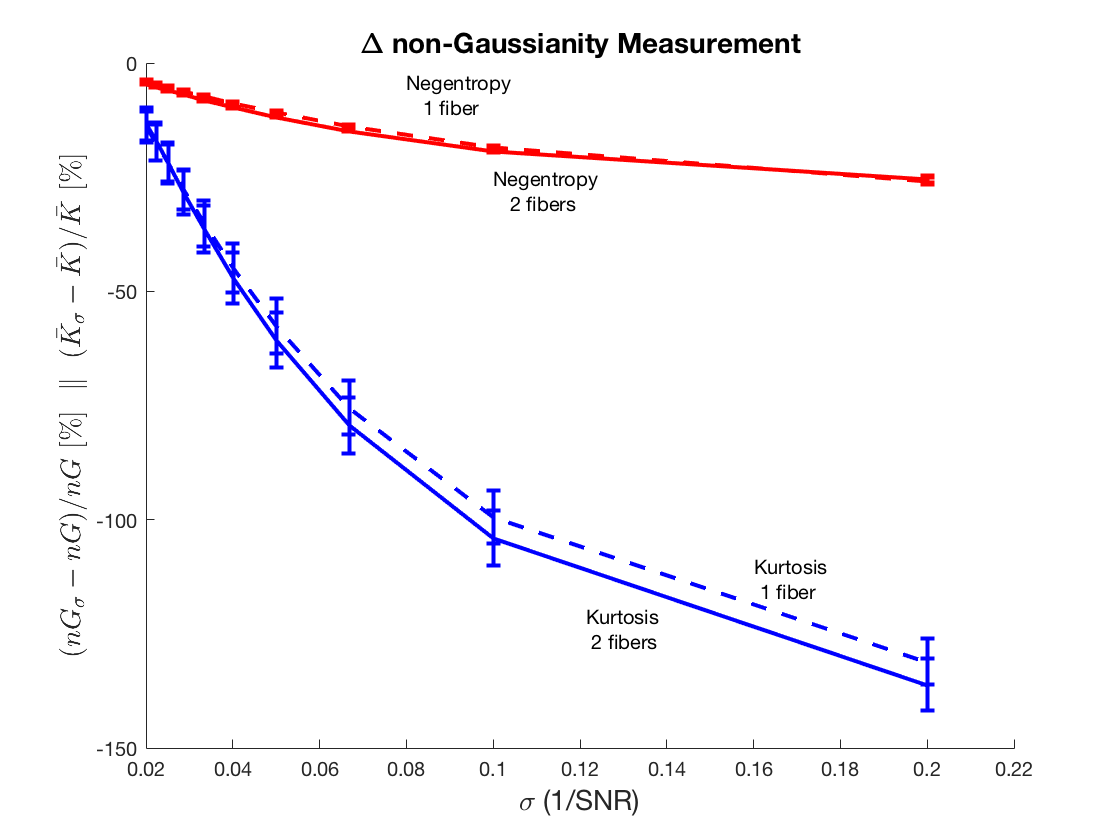
Negentropy degrades much less than Kurtosis as the noise increases. Figure 1 shows that Negentropy only decreases about 30% compared to the ground truth when decreasing SNR to 5, whereas Kurtosis decreases around 140% relative to the ground truth. This is true for one and two-fiber simulations and it is significant, as indicated by the standard deviation. Figure 2 shows the nG-map, the $$$ \bar{K} $$$-map and the relative difference between both. The nG-map is much more homogeneous across the brain than Kurtosis.Discussion
Both Negentropy and Kurtosis measure the non-Gaussianity of a pdf, however, Negentropy is more robust to noise. Although our nG-map looks quite promising, we need further studies to understand completely the contrast obtained from the different diffusion propagators in the quantification of Negentropy.Conclusion
In this work, we demonstrate empirically from noisy simulations and in-vivo DSI data that Negentropy is a more robust indicator of non-Gaussianity than Kurtosis. Kurtosis has been used to increase the characterization of the microstructure in some diseases 2, so in theory, Negentropy could detect the same or finer variations of non-Gaussianity in a noisier, but higher resolution diffusion propagator.Acknowledgements
We want to acknowledge Anillo ACT1416, Fondecyt 1141202 and CONICYT for their support in the development of this work.References
[1] J. Jensen, J. Helpern, and A. et al Ramani. Diffusional kurtosis imaging: The quatinfication of non-gaussian water diffusion by means of magnetic resonance imaging. Magnetice Resonance in Medicine, 53:1432–1440, 2005.
[2] A.J. Steven, J. Zhuo, and E.R. Melhem. Diffusion kurtosis imaging: An emerging technique for evaluating the microstructural environment of the brain. American Journal of Roentgenology, 202:W26–W33, 2014.
[3] V. J. Wedeen, P. Hagmann, W.-Y. I. Tseng, T. G. Reese, , and R. M. Weisskoff. Mapping complex tissue architecture with diffusion spectrum magnetic resonance imaging. Magnetic Resonance in Medicine, 54:1377– 1386, 2005.
[4] A. Hyvaerinen and E. Oja. Independent component analysis: Algorithms and applications. Neural Networks, 13:411–430, 2000.
[5] P. Cook, Y. Bai, S. Nedjati-Gilani, K. Seunarine, and M. G. et al Hall. Camino: Open-source diffusion-mri reconstruction and processing. page 2759, Seattle, USA, 2006.
[6] M. Paquette, S. Merlet, G. Gilbert, R. Deriche, and M. Descoteaux. Comparison of sampling strategies and sparsifying transforms to improve compressed sensing diffusion spectrum imaging. Magnetic Resonance in Medicine, 73:401–416, 2015.
Figures