3395
Rat brain development assessed by high-field neurite orientation dispersion and density imaging1Laboratoire d'imagerie fonctionnelle et métabolique, Ecole Polytechnique Fédérale de Lausanne, Lausanne, Switzerland, 2Département développement et croissance, Université de Genève, Geneva, Switzerland, 3Département de radiologie, Geneva and Lausanne, Switzerland
Synopsis
Diffusion tensor imaging (DTI) has been widely used to study rodent brain development. Nevertheless, the parameters derived from DTI are sensitive to, but non-specific to, the tissue’s microstructure. Recently, NODDI (neurite orientation dispersion and density imaging) has been proposed. We aimed to estimate the real input of NODDI derived parameters in rodent brain development. ODI appears more accurate and specific to reflect GM (increase with dendritic arborization) and WM (decrease with myelination) development than FA and could be a very important parameter in the assessment of perinatal brain injuries. Conclusion about the other NODDI estimates requires further experiments.
Purpose
Diffusion tensor imaging (DTI) has been widely used to study rodent brain development1. Nevertheless, the parameters derived from DTI (diffusivities: mean: MD, axial: AD and radial: RD as well as fractional anisotropy: FA) are sensitive to, but non-specific to, the tissue’s microstructure. For instance, anisotropy can be modulated by the degree of myelination, axonal density, axon diameter, cell membrane permeability... Multi-compartments models have then been proposed including the neurite orientation dispersion and density imaging (NODDI2). From this model, one can estimate the intra-neurite volume fraction (fin), the cerebrospinal volume fraction (fiso) and the orientation dispersion index (ODI) that models the dispersion/fanning of the axonal fibers or dendrites. In this work, we aimed to study ex-vivo rat brain development at different post-natal days (P) by using DTI and NODDI at 9.4T to estimate the real input of NODDI estimates in rodent brain development.Methods
Pup rat brains were collected at P4, P7, P21 and P60 (n=8/age). MR experiments were performed on an actively-shielded 9.4T/31cm magnet (Agilent) equipped with 12-cm gradient coils (400mT/m,120μs) with birdcage coils of 2.5cm (P4-P7-P21) and 3.5cm (P60) diameter. A multi-b-value shell protocol was acquired using a spin-echo sequence with the following parameters: FOV: 17×14mm2 (P4), 20×15mm2 (P7), 23×17mm2 (P21) and 25×20mm2 (P60), matrix size: 128×92, 14 slices of 0.6mm thickness in the axial plane, 4 averages with TE/TR=45/3000ms. 96 DWI were acquired, 15 as b0 reference images and 81 separated in 3 shells (non-collinear and uniformly distributed in each shell) with the following distribution (# of directions/b-value in s/mm2 with δ/Δ=5.5/30ms): 21/1750, 30/3400 and 30/5100. Acquired data were fitted using the NODDI toolbox2. NODDI model traditionally uses three compartments, but for ex-vivo samples a fourth compartment to model stationary water trapped in the structures following death and fixation was added (isotropic restricted compartment: irfrac). NODDI estimates were measured in the cortical grey matter (GM) and white matter (WM). For statistics, a Mann Whitney test was used (significance: P<0.05, P4 vs. P7; P7 vs. P21 and P21 vs. P60).Results
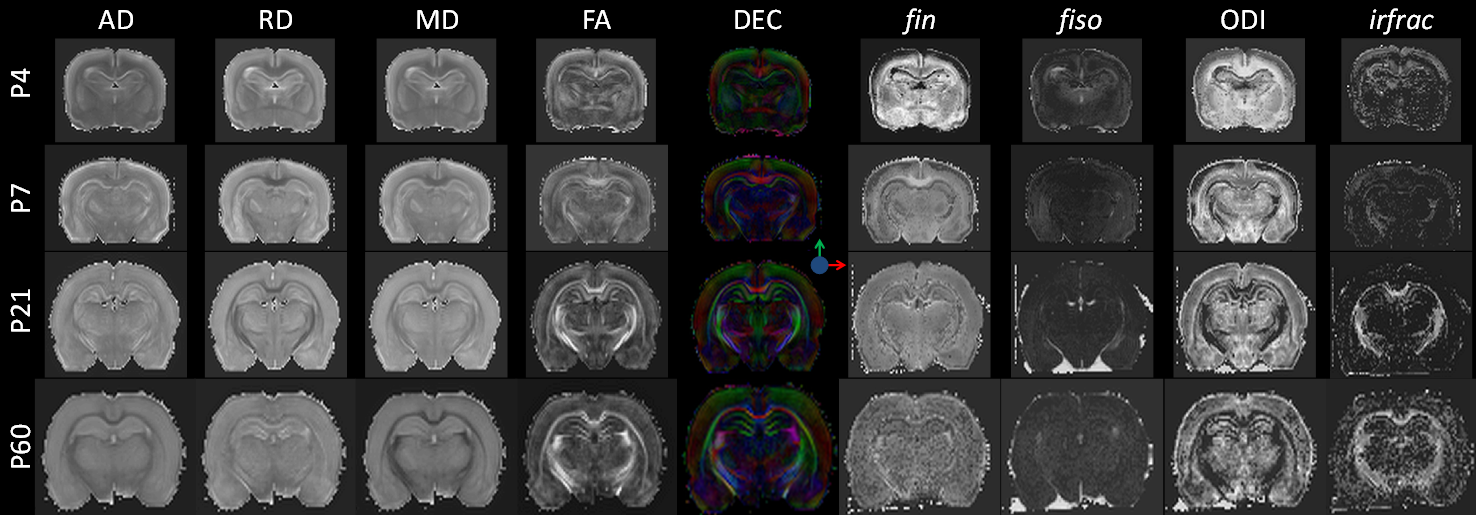
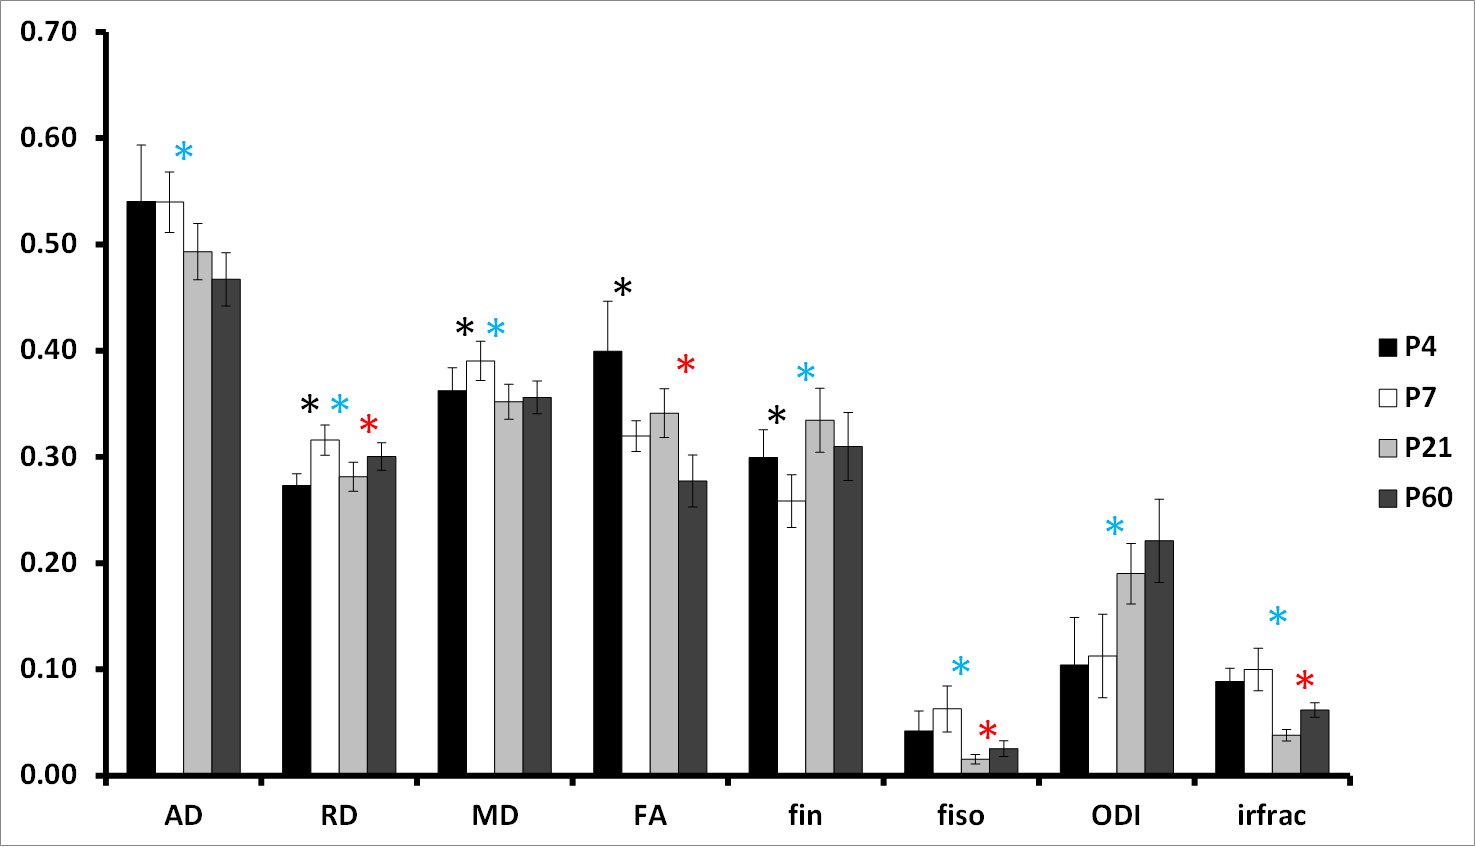
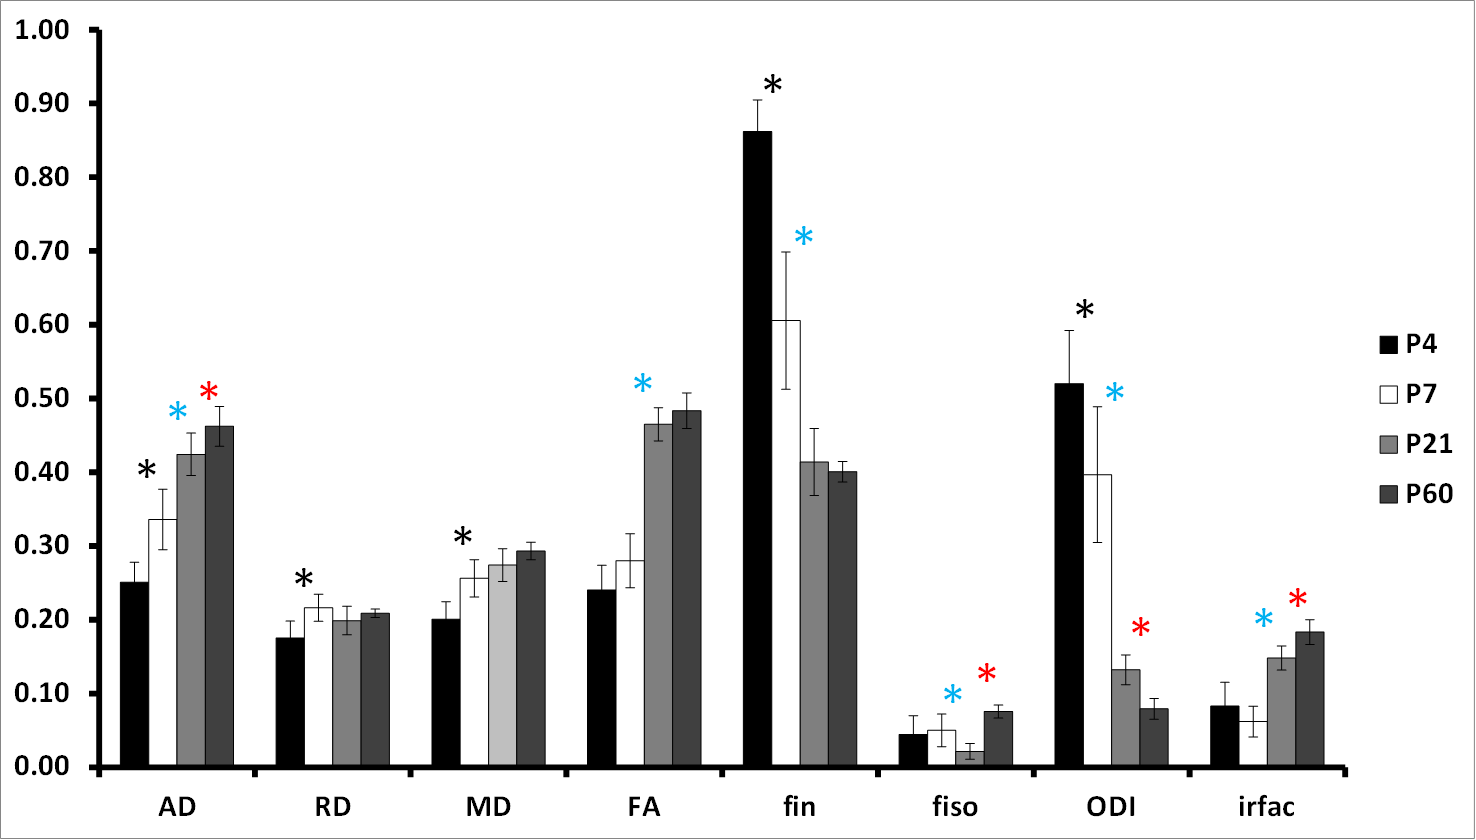
At P4 and P7, separation of cortical layers was clearer on fin and ODI maps than on FA maps (Figure 1). In GM (Figure 2), AD decreased mainly from P7 to P21 whereas RD showed a bell shape from P4 to P7 (increase), P7 to P21 (decrease) and P21 to P60 (increase). Consequently, MD followed the same pattern. A significant decrease of FA was observed from P4 to P7 and from P21 to P60. fin decreased from P4 to P7 then increased from P21 to P60. ODI increased gradually from P4 to P60 but significantly only from P7 to P21. fiso was decreased from P7 to P21 then increased from P21 to P60 in both GM and WM. In WM (Figure 3), AD increased whereas ODI decreased both gradually from P4 to P60. RD and MD increased mainly from P4 to P7. Significant FA increase was found mainly from P7 to P21 with a gradual tendency before and after but not significant. Finally, fin decreased drastically from P4 to P7 and P7 to P21 to reach a plateau. Significant changes of irfrac were observed in GM and WM from P7 to P21 and P21 to P60.Discussion and conclusion
In GM, the decrease of FA coincides with the phase of neocortical maturation with transformation of the radial glia into the more complex astrocytic neuropil (e.g. arborization of basal dendrites of cortical neurons)3,4. As such, ODI values reflect very well the cortical development. In the WM, setting up of pre-myelinating oligodendrocytes (P4 to P7) followed by myelination (P7 to P21 mainly) leads to AD and consequently FA increase as well as ODI decrease. ODI varies more gradually than FA from P4 to P60 reflecting myelination but also fiber compaction during development. The fiso values might have been biased by fixation process as they were expected to reflect the decrease of cerebral water content during development. Similarly, the variations of fin specifically on WM with drastic decrease is surprising and does not match with the development of pre-myelinating and myelinating micro-structure. From P4 to P60, cerebral microstructure evolves (myelin, size of the structures, cellularity…). Depending on the stage of development, the effect of fixation on the tissue may be different. These differences could explain irfrac variations among the ages. In conclusion, ODI appears more accurate and specific to reflect GM (increase with dendritic arborization) and WM (decrease with myelination) development than FA and could be a very important parameter in the assessment of perinatal brain injuries. Conclusion about the other NODDI estimates requires further experiments.Acknowledgements
Supported by le fond national Suisse n°33CM30-124101/140334, the CIBM of the UNIL, UNIGE, HUG, CHUV, EPFL, Leenards and Jeantet foundation.References
[1] van de Looij Y et al. MRI of animal models of developmental disorders and translation to human imaging. Cur. Opin. in Neur. 2014 Apr;27(2):157-67.
[2] Zhang H et al. NODDI: practical in vivo neurite orientation dispersion and density imaging of the human brain. Neuroimage. 2012 Jul 16;61(4):1000-16.
[3] McKinstry RC et al. Radial organization of developing preterm human cerebral cortex revealed by non-invasive water diffusion anisotropy MRI. Cereb. Cortex. 2002 Dec;12(12):1237-43.
[4] Sizonenko SV et al. Developmental changes and injury induced disruption of the radial organization of the cortex in the immature rat brain revealed by in vivo diffusion tensor MRI. Cereb. Cortex. 2007 Nov;17(11):2609-17.
Figures