Takuya Aoike1, Noriyuki Fujima2, Masami Yoneyama3, Suzuko Aoike1, Hiroyuki Sugimori4, Kinya Ishizaka1, and Kohsuke Kudo2
1Department of Radiological Technology, Hokkaido University Hospital, Sapporo, Hokkaido, Japan, 2Department of Diagnostic and Interventional Radiology, Hokkaido University Hospital, 3Philips Electronics Japan, 4Faculty of Health Sciences, Hokkaido University
Synopsis
The purpose of this study was to assess the
variation of T2 values by T2 map with the pre-pulse of diffusion gradient
(=DW-T2 map). T2 value of GM was gradually decreased as b-value increased. From
this result, water diffusivity based selective removal of tissue component such
as perfusion fraction or extracellular extravascular space can be obtained
using DW-T2 map technique. This technique can reveal the more detain in the
human brain tissue characteristics.
Introduction
The quantitative T2
value is important parameter which reflects the tissue specificity related to
the tissue transverse relaxation. Measurement of T2 value enables to quantitative evaluation for
the property of numerous substances. Clinical utility of quantitative T2 value
was previously reported for the evaluation of diseases such as metastatic brain
tumors, Sturge-Weber syndrome and multiple sclerosis.1 In general, T2 map
can be obtained by multiple echo-time (TE) acquisitions with pixel by pixel
basis. However, there are various components in each pixel such as the
intracellular space, extracellular space and perfusion fraction. Measured T2
value in each pixel by conventional pixel by pixel basis T2 map was considered
to be obtained as a mixed and averaged value between various T2 values in
multiple components in the brain tissue. In contrast, diffusion gradient as a
use for pre-pulse can result in signal loss according to the degree of the
water diffusivity in various components, introduced as diffusion-weighted image
(DWI). By using various degree of diffusion gradient (i.e. various b-values) as
pre-pulse, roughly separation of diffusion based tissue component such as
perfusion and non-perfusion related signal, or intracellular and extracellular
space may be accomplished. Therefore, it is expected that T2 map with the
pre-pulse of diffusion gradient can provide selectively T2 value based on
multiple tissue component by using the various b-values.
The purpose of this study was to assess the
variation of T2 values by T2 map with
the pre-pulse of diffusion gradient (=DW-T2 map).
Methods
1) Subjects
Three healthy volunteers with no history of
the past brain disease were included in this study. Details of these volunteers
were as follows; 3 male, age, 26 years in all subjects.
2) MR scanning
All subjects were scanned on a 3 Tesla MR
scanner (Achieva TX; Philips Healthcare, Best, The Netherlands) with a 8-channel
head coil.
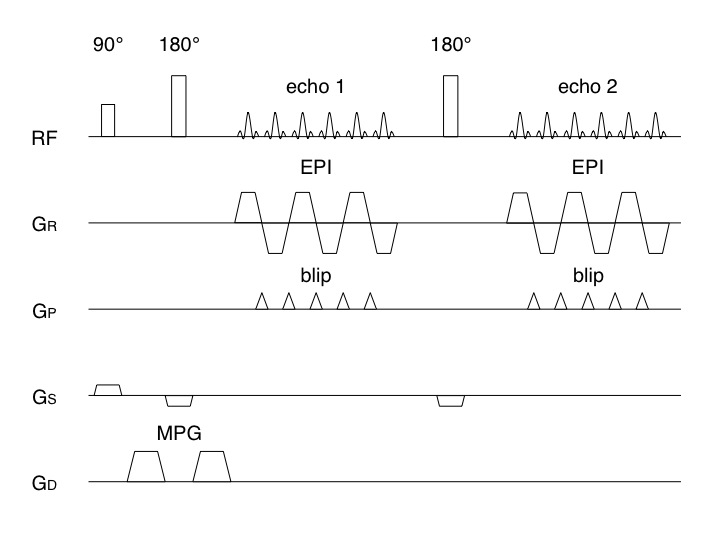
DW-T2 map used spin-echo echo-planar
imaging (SE-EPI) with TR=4500ms, TE1=55ms, TE2=160ms, slice-thickness=5mm,
matrix=128×128, FOV=240×240mm. The scanning range of DW-T2 map acquisitions were
planned to cover the whole brain including the cerebellum at the lower end. Scans with b-values (s/mm2) = 0, 200, 500, 1000 and diffusion
gradient was acquired after the 90° excitation pulse and 180° refocusing pulse (Fig. 1). Conventional T2 map was also acquired using the multiple echoes by SE readout.
3) Data analysis
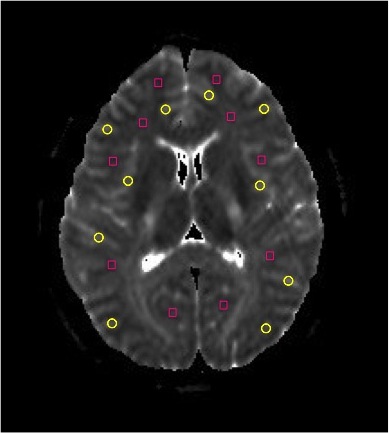
In each T2 map, manual regions of interest
(ROI) was placed bilaterally on gray matter (GM) and white matter (WM) in level
of the evenly basal ganglia,2 after that, each T2 value of GM and WM
in each ROI was determined as mean value in the ROI (Fig. 2). Twenty ROIs were placed in a subject.
Finally, total sixty ROIs from three subjects were analyzed.
4) Statistical analysis
Analysis 1
The obtained T2 value in each ROI (GM and
WM) was compared between DW-T2 map and conventional T2 map using Wilcoxon rank
sum test.
Analysis 2
The obtained T2 value by DW-T2 map in each
ROI (GM and WM) was compared between various b-values (0, 200, 500 and 1000) using
multiple comparison (Steel-Dwass’ test with
a bonferroni correction).
Statistical significance was set to p<0.05 for all
tests.
Results
Analysis 1
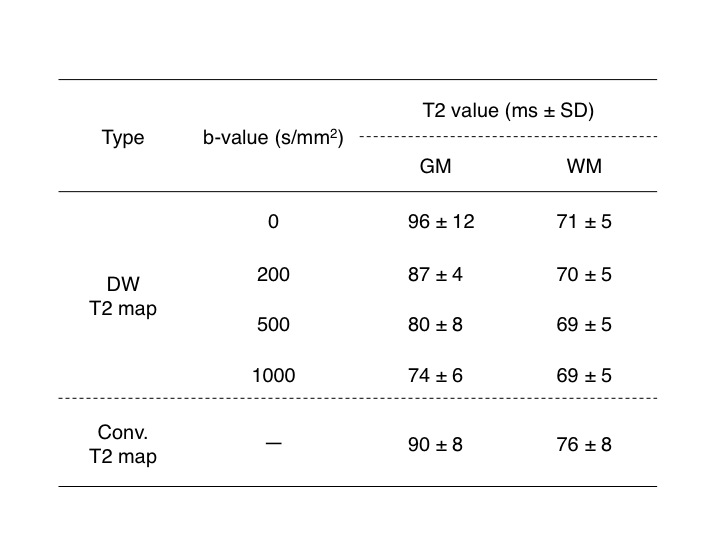
In GM ROI, T2 value of conventional method
(90±8) was significantly lower than T2 value obtained by DW-T2 map (96±12) (p<0.05). In contrast, T2 value in WM ROI of conventional
method (76±8) was significantly higher than T2 value obtained by DW-T2 map (71±12) (p<0.05) (Table. 1).
Analysis 2
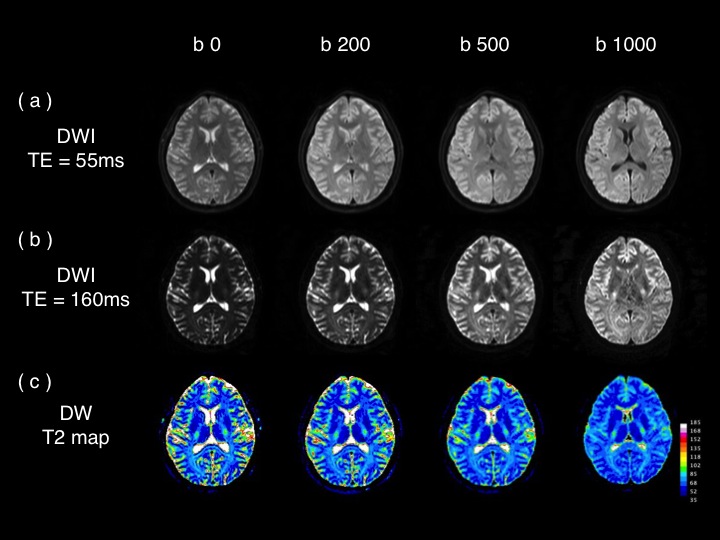
In GM ROI, as b-value increased, T2 value by DW-T2
map was linearly decreased (p<0.05). In WM ROI, T2 values by DW-T2 map were not
differ significantly among all b-values (Fig. 3).
Discussion and Conclusion
In the comparison of T2 value between
conventional and DW-T2 map, the difference of T2 value might be affected by the
difference of readout. In the comparison of T2 value among various
b-values in DW-T2 map, T2 value of GM was gradually decreased as b-value
increased. From this result, water diffusivity based selective removal of
tissue component such as perfusion fraction or extracellular extravascular space
can be obtained using DW-T2 map technique. This technique can reveal the more
detain in the human brain tissue characteristics.Acknowledgements
No acknowledgementsReferences
1. Hagiwara A, Hori M, Yokohama K, et al. Utility of a Multiparametric Quantitative MRI Model That Assesses Myelin and Edema for Evaluating Plaques, Periplaque White Matter, and Normal-Appearing White Matter in Patients with Multiple Sclerosis: A Feasibility Study. AJNR Am J Neuroradiol originally published online on october 27, 2016, 10.3174/ajnr.A4977.
2. Wansapura JP, Holland SK, Dunn RS , et al. NMR relaxation times in the human brain at 3.0 tesla. Journal of magnetic resonance imaging, 1999, 9.4: 531-538.