3390
Comparison of diffusion propagator imaging metrics for accurate microstructure characterization in clinically acceptable scan times1Institute of Child Health, University College London, London, United Kingdom, 2Neuroimaging, King's College London, London, United Kingdom
Synopsis
Despite the abundance of models to describe the diffusion propagator, its usefulness has not yet been explored in a clinical/clinical research setting. In this study, we have compared global diffusion propagator imaging metrics to recently described measures of anisotropy and probability profiles at different displacement scales to characterise microstructure. Moreover, we have shown that these metrics offer complementary information to the ones currently established. Finally we have also acquired a "Reference Dataset" with several different diffusion weightings and demonstrated that by choosing the right combination, accurate reconstruction of both types of metrics is possible for clinically acceptable scan times.
Introduction
Despite the abundance of models and imaging methods to represent the diffusion propagator, its full potential has yet to be exploited clinically, mainly due to the large amounts of data and long acquisition times required[1][2]. Also, there is still no agreement regarding how many and which diffusion weightings should be used to study microstructural properties and how they affect corresponding metrics. Additionally, while existing propagator-based metrics are useful, they offer a global perspective of the propagator, without discriminating extra information present at different displacement scales. Here, we first compared the complementarity of recently developed displacement-specific metrics[3] with established global propagator metrics. A high-quality “Reference Dataset” composed of 460 diffusion directions across 6 distinct b-values was then acquired to compare reconstructed metrics. Finally, we subsampled this dataset, generating multiple acquisition protocols with different combinations of diffusion weightings, investigating the ability to correctly recover metrics within clinically acceptable standards.
Methods
Data acquisition:In-vivo data were acquired in a single healthy adult human subject using a 3T GE MR750 MR scanner with maximum gradient strength of 50 mT.m-1 and slew rate of 200 mT.m-1.s-1. Acquisition parameters included voxel size=2mm x 2mm x 2mm, FOV=256 x 256mm, 72 slices, NEX=1, TE=79.4ms, TR=4000ms. Data were collected using a multi-band diffusion weighted single-shot spin-echo EPI, with a multi-band acceleration factor of 3, in-plane acceleration ARC factor of 2 and anterior-posterior phase encoding. A range of b-values [750,1000,1500,2000,2500,3000]s.mm-2 along [60,60,60,90,90,100]directions and 6 non-diffusion-weighted volumes (b0) for each acquisition were acquired. Interleaved with each individual shell acquisition, 6 additional b0s of opposite phase encoding polarity were acquired, for correction of susceptibility-induced distortions.
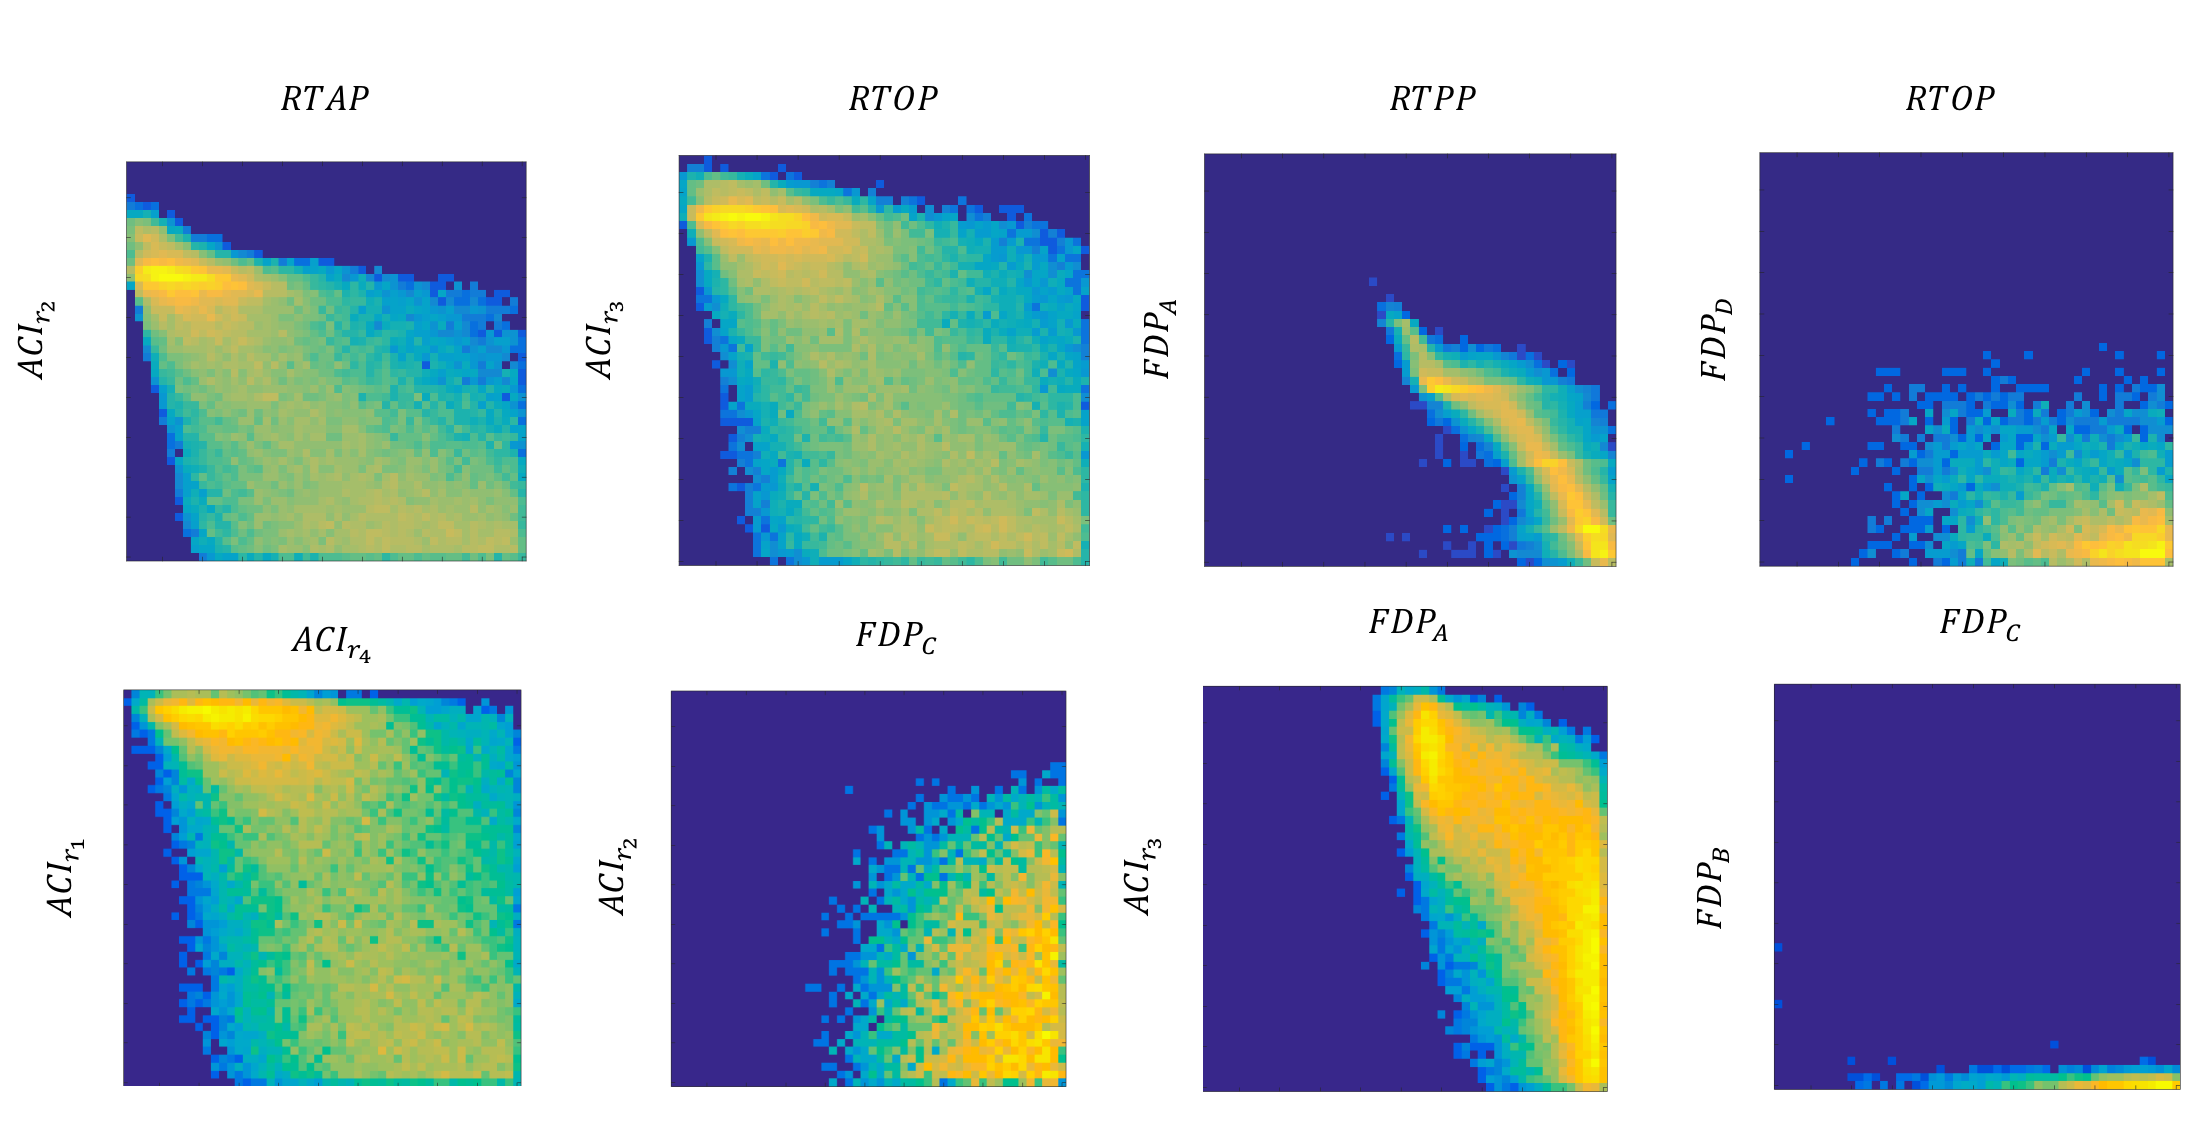
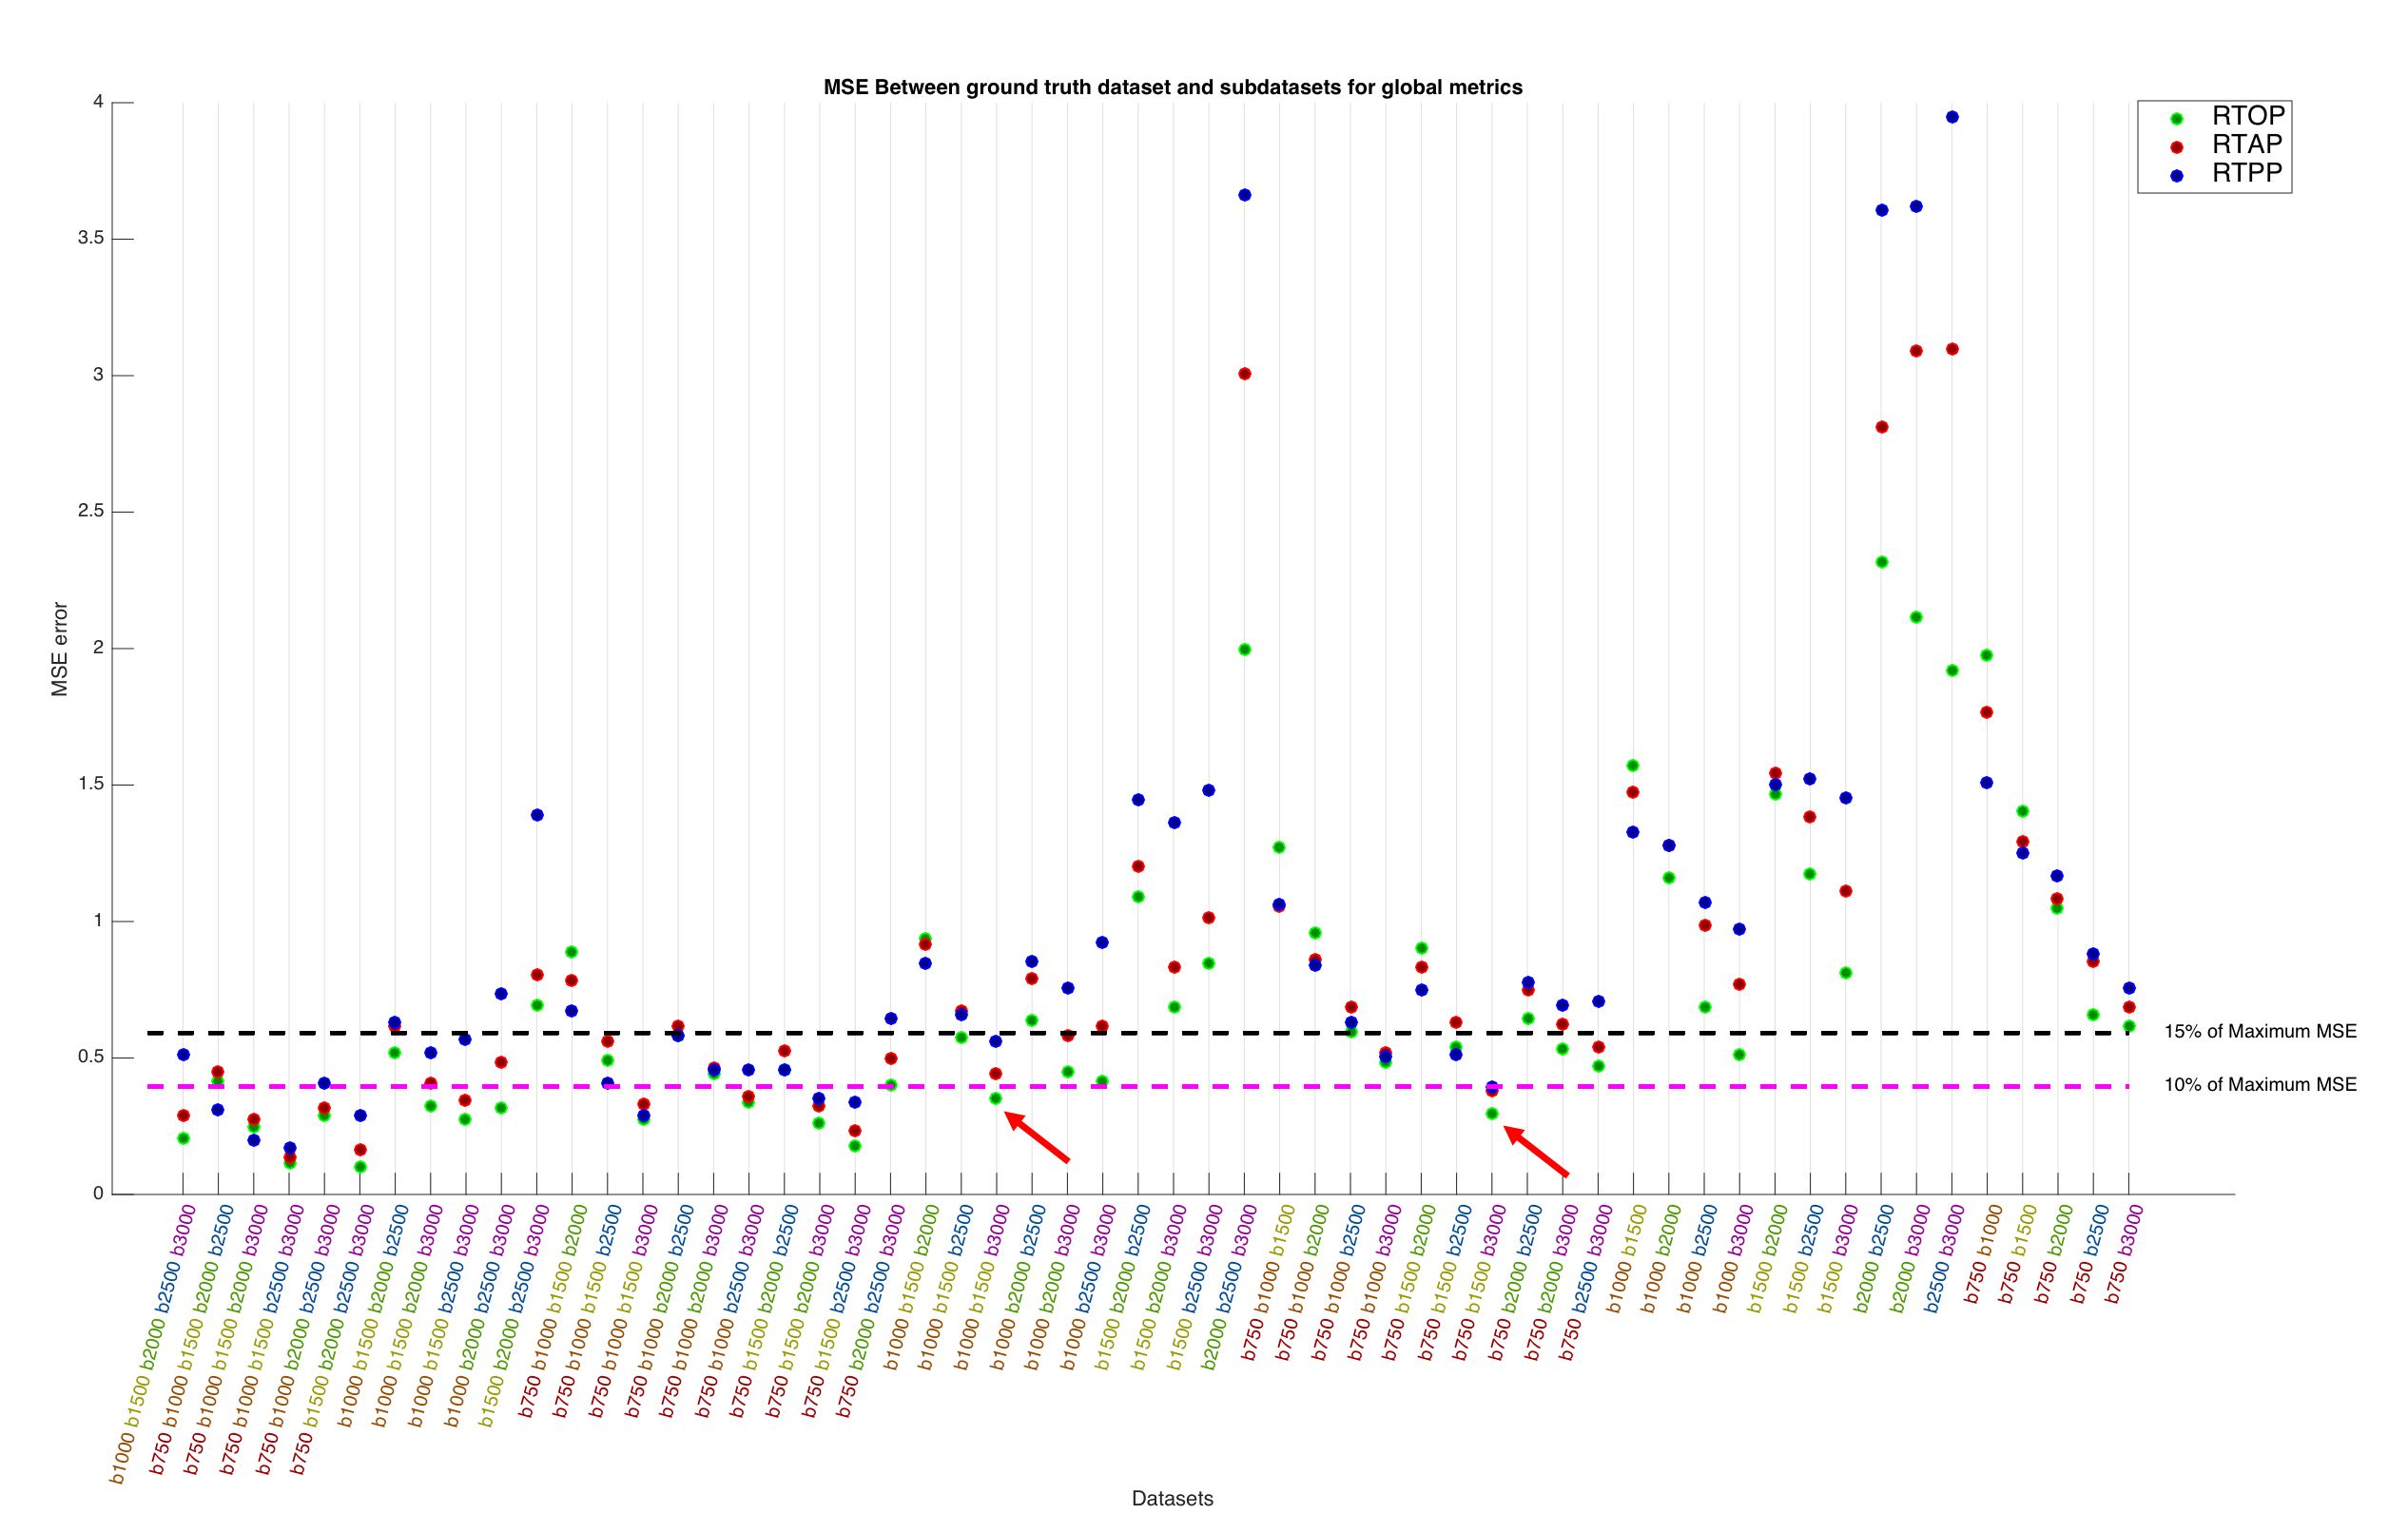
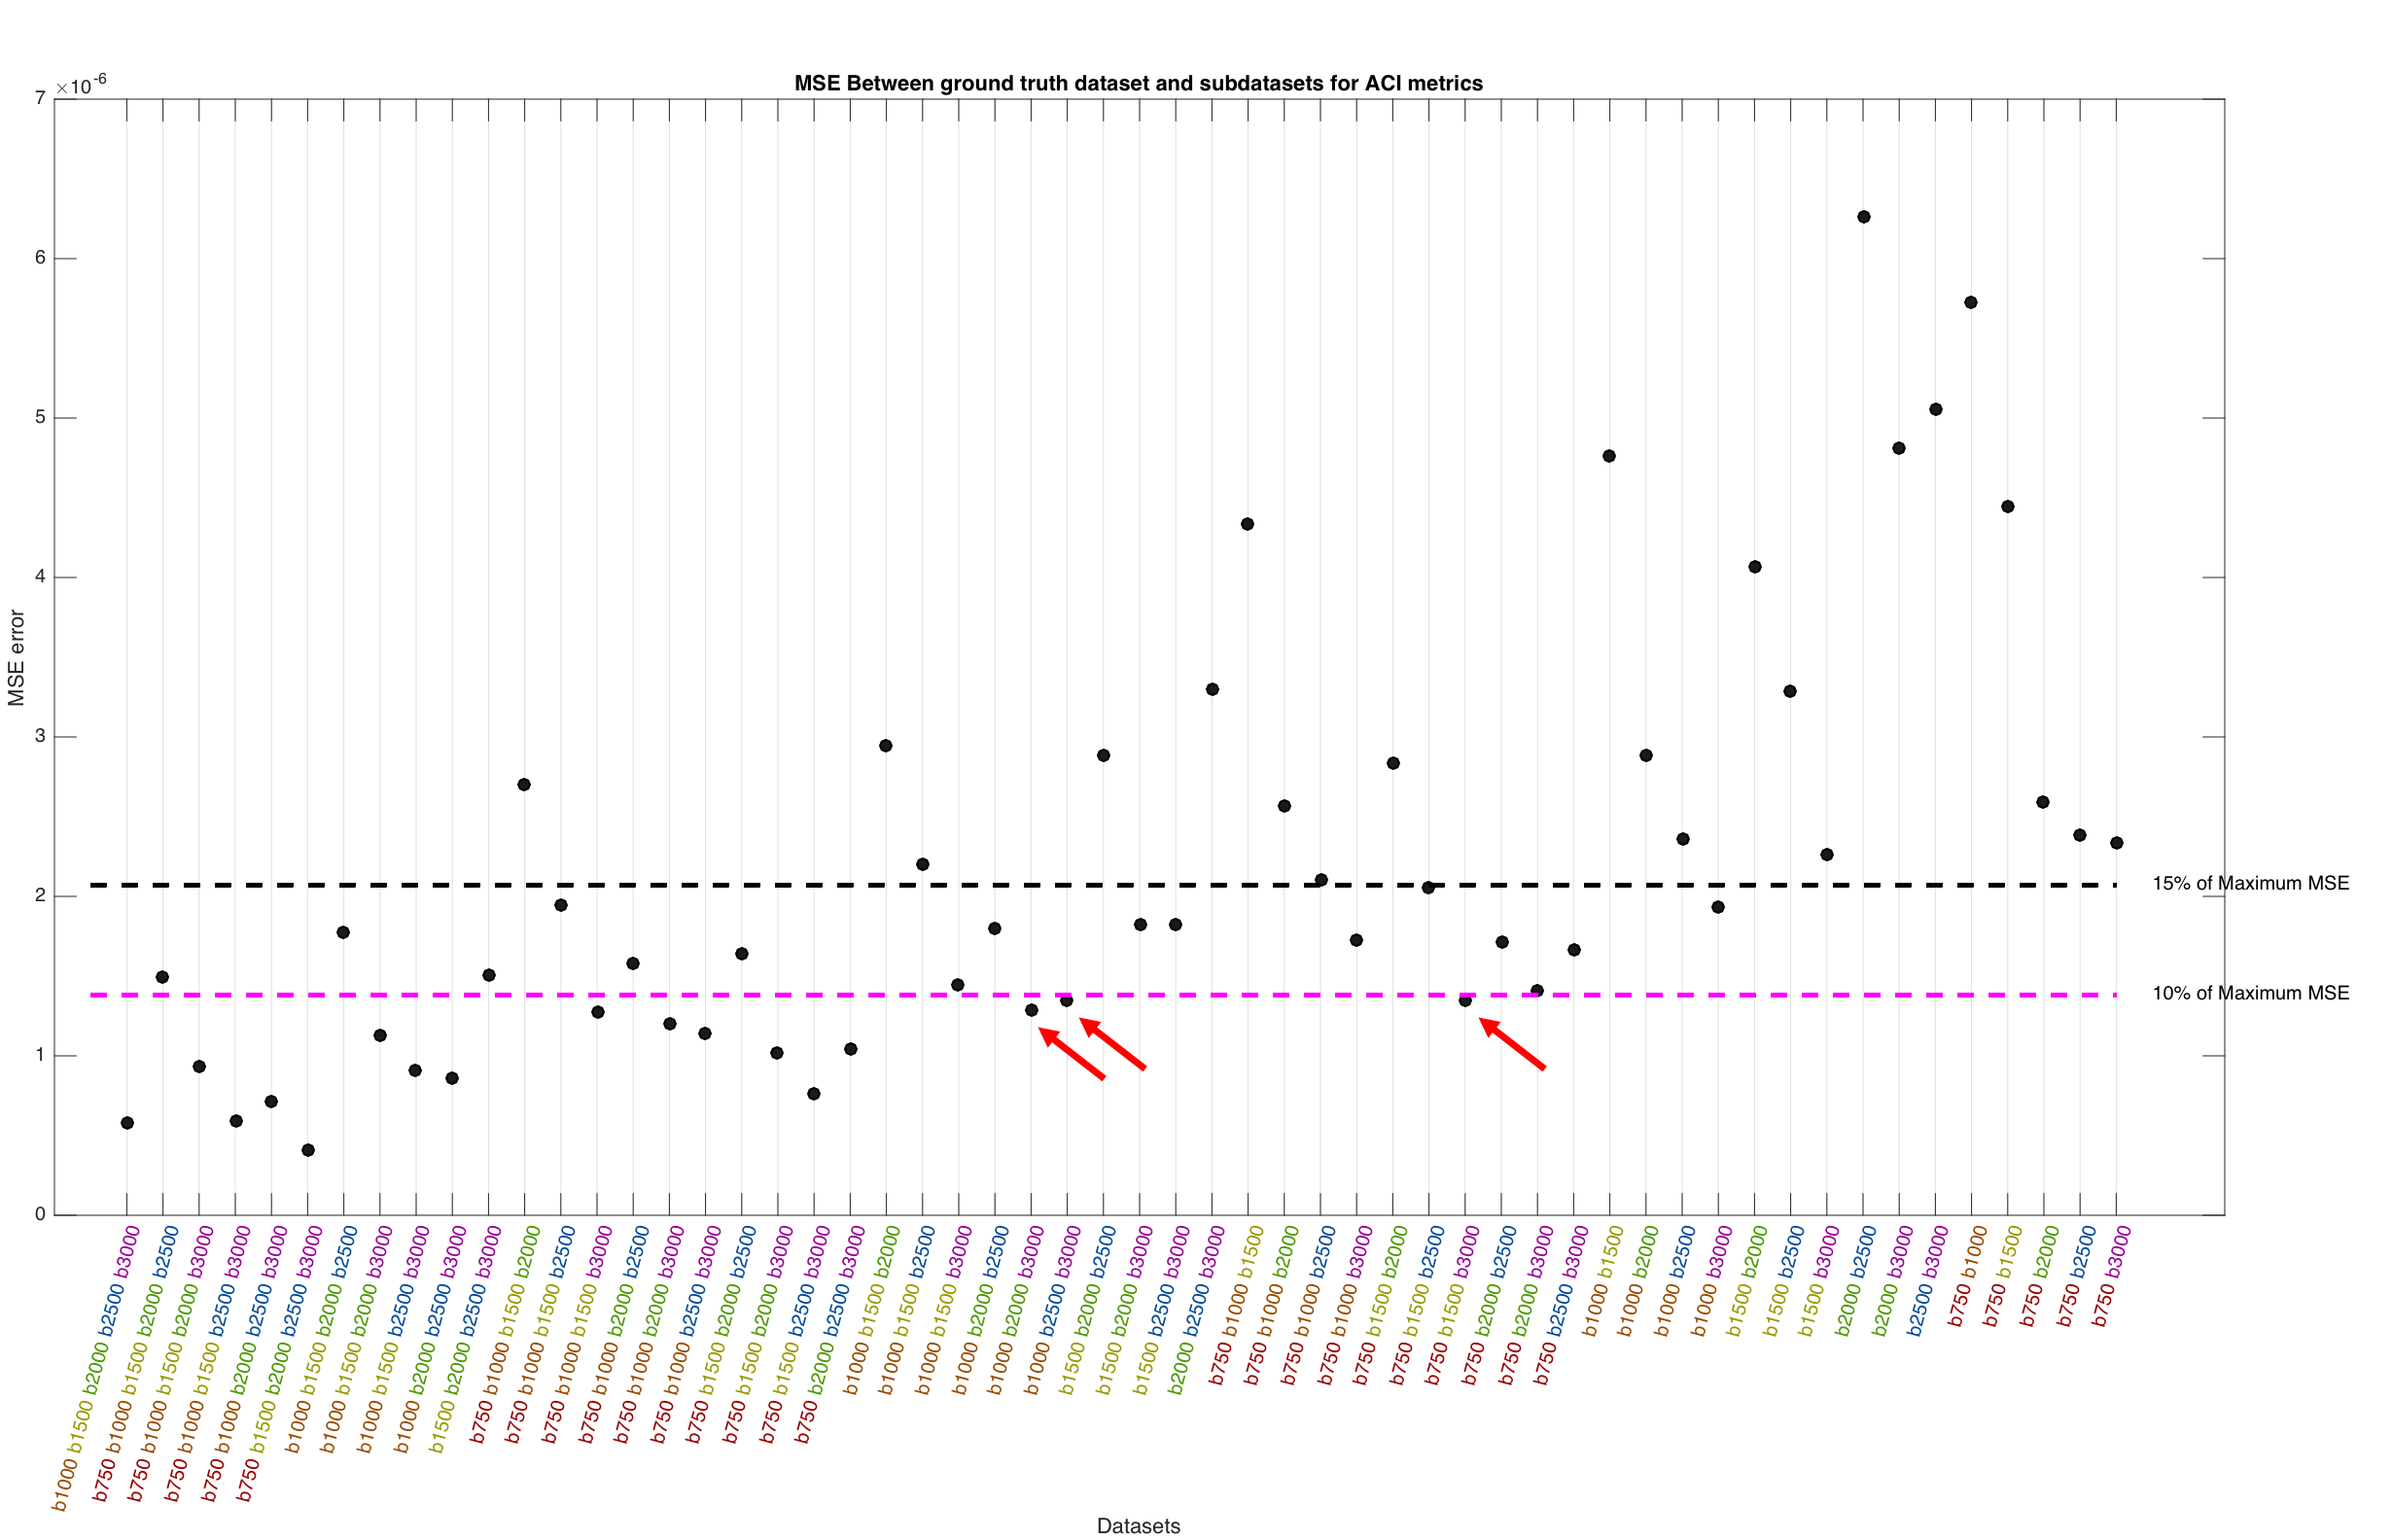
Processing:TOPUP and EDDY (FSL tools) were used to correct for distortions and to perform motion and eddy current correction in all diffusion weighted volumes simultaneously[4]. After pre-processing, the “Reference Dataset” was subsampled into smaller number of shells, i.e., all combinations of 5,4,3 and 2 shells. MAP-MRI coefficients were then fit, and Return-to-origin(RTOP), Return-to-Axis(RTAP) and Return-to-Plane Probability(RTPP) maps extracted directly from dipy[5]. Furthermore, the diffusion propagator was computed at a maximum displacement of 40$$$\mu m$$$, over a volume of 35x35x35 points, yielding a resolution of approximately 2$$$\mu m$$$. Displacement-specific metrics, namely Angular Complexity Index(ACI) and Fractional Displacement Probability(FDP)[3], respectively describing the anisotropy and probability fraction of the propagator at different scales were also calculated(Fig.1). Four ACI profiles were computed at 10,16,22 and 28$$$\mu m$$$, respectively $$$ACIr_{1}$$$,$$$ACIr_{2}$$$,$$$ACIr_{3}$$$ and $$$ACIr_{4}$$$; defining the limits of $$$FDP_{A}$$$,$$$FDP_{B}$$$,$$$FDP_{C}$$$ and $$$FDP_{D}$$$, of 0-10,10-16,16-22 and 22-28$$$\mu m$$$ respectively. In order to evaluate the information content of both types of metrics, a joint histogram analysis was performed(Fig.2). Finally, the Mean Squared Error(MSE) was calculated between the “Reference Dataset” and each subsampled counterpart, and plotted for all metrics(Figures 3-5).
Results and Discussion
This study suggests that there is additional information by looking at different scales of the diffusion propagator. As illustrated in Fig.1, different contrasts can be extracted by using displacement-specific metrics which are potentially useful for distinguishing anatomy and/or pathology. Joint histograms show that ACI and FDP metrics offer complementary information to established global propagator descriptors like RTOP/RTAP/RTPP(Fig.2 – top row); furthermore, information given by specific displacement bands and/or anisotropy at different scales, should also be explored (Fig.2 – bottom row). Fig.3 displays the MSE between the "Reference dataset" and subsampled schemes. Additionally, two dashed lines are plotted to help differentiate acquisition schemes that fall under 15% and 10% of the maximum MSE. It is possible to see that MSE generally increases with decreasing shells for all global metrics; depending, nonetheless, on the considered shells. Fig.4 and 5 show the average MSE for displacement-specific metrics, respectively FDP and ACI. Similarly to Fig.3, there is an MSE increase with decreasing shells. The best trade-off in terms of low MSE on a range of metrics versus clinical/clinical research setting potential is b750_b1500_b3000, corresponding to 220 gradient directions acquired in approximately 15min. However, the number of directions has not been optimised and could almost certainly be decreased without performance loss resulting in shorter acquisition times.
Conclusion
In this study we have demonstrated the use of multi-shell techniques to provide new information regarding the human brain and that, without the advent of multiband and other acceleration techniques, this is not easily performed in a clinical/clinical research setting. We additionally determined heuristically which and how many diffusion weightings are necessary to accurately reconstruct diffusion propagator imaging metrics. Finally, we show that exploring different displacement scales of the diffusion propagator offers complementary information to current global metrics and provides new contrasts that can be used in future studies of both healthy and pathological scenarios.Acknowledgements
The author acknowledges EPSRC and GE Healthcare for funding the PhD project the has in part led to this work.References
1- Avram, A. V., Sarlls, J. E., Barnett, A. S., Özarslan, E., Thomas, C., Irfanoglu, M. O., et al. (2016). Clinical feasibility of using mean apparent propagator (MAP) MRI to characterize brain tissue microstructure. NeuroImage, 127, 422–434. http://doi.org/10.1016/j.neuroimage.2015.11.027
2 - Ferizi, U., Schneider, T., Witzel, T., Wald, L. L., Zhang, H., Wheeler-Kingshott, C. A. M., & Alexander, D. C. (2015). White matter compartment models for in vivo diffusion MRI at 300mT/m. NeuroImage, 118(C), 468–483. http://doi.org/10.1016/j.neuroimage.2015.06.027
3 - Lacerda L.M; Barker, G.J; Dell’Acqua, F.Angular Complexity and Fractional Displacement Probability: New metrics for diffusion propagator imaging. In Proceedings of the 24th Annual Meeting of ISMRM, Toronto, Canada, 2015. Abstract 3045.
4 - Andersson, J. L. R., & Sotiropoulos, S. N. (2016). An integrated approach to correction for off-resonance effects and subject movement in diffusion MR imaging. NeuroImage, 125, 1063–1078. http://doi.org/10.1016/j.neuroimage.2015.10.019
5 - Garyfallidis, E., Brett, M., Amirbekian, B., Rokem, A., van der Walt, S., Descoteaux, M., et al. (2014). Dipy, a library for the analysis of diffusion MRI data. Frontiers in Neuroinformatics, 8(175), 554–28. http://doi.org/10.3389/fninf.2014.00008
Figures