3387
In-vivo Bundle-Specific Axon Diameter Distributions Estimation across the Corpus Callosum1Signal Processing Lab (LTS5), École Polytechnique Fédérale de Lausanne, Lausanne, Switzerland, 2Sheerbrooke Connectivity Imaging Laboratory (SCIL), University of Sheerbrooke, Canada, 3University Hospital Center (CHUV) and University of Lausanne (UNIL), Switzerland, 4Department of Computer Science, University of Verona, Italy
Synopsis
Over the last decade microstructure imaging has become commonly endorsed to estimate quantitative features of neuronal tissue. However, those techniques estimate the microstructure only locally. Microstructure informed tractography was recently proposed to bolster microstructure estimates by accounting for the structure of the white matter bundles. The purpose of this study was to extend this novel technique for evaluating bundle-specific axon diameter distributions and investigate bundle-specific properties in the human brain. The experiment was performed on the MGH adult HCP dataset. The findings suggest potential application in the estimation of the axon diameter distribution along white matter bundles in whole-brain tractograms.
Purpose
Histological analysis of the human Corpus Callosum performed by Aboitiz1 suggests that white matter thin fibers characterize anterior and posterior parts, while central part reveal larger fibers. Furthermore, voxel-wise estimates of axon diameter distributions2 with in vivo diffusion MRI (dMRI) measurements using 300 mT/m gradients confirmed the low-high-low pattern in the human Corpus Callosum. Here we use a global microstructure informed tractography approach for estimating axon diameter distributions1-4. The experiment was performed on MGH adult HCP data5. The findings of this investigation complement those of earlier studies.Methods
Recently, the COMMIT (Convex Optimization Modeling for Microstructure Informed Tractography) framework was proposed6,7 to formulate efficiently both tissue microstructure estimation and tractography in a joined expression. The whole dMRI image is modeled as a linear combination of the diffusion signal originating from all the streamlines of an input tractogram, in addition to local contributions from other tissue compartments: $$\boldsymbol{y}=\boldsymbol{A}\boldsymbol{x}+\eta\,,$$ where $$$\boldsymbol{y}$$$ contains all dMRI measurements, $$$\boldsymbol{A}$$$ is the dictionary (or linear operator) implementing a generic multi-compartment model8 for the signal contributions of the streamlines in each voxel and $$$\eta$$$ is the acquisition noise. The following nonnegative least-squares problem is solved to estimate the contributions $$$\boldsymbol{x}$$$ of all compartments: $$\underset{\boldsymbol{x}\ge0}{\operatorname{argmin}}\;||\boldsymbol{A}\boldsymbol{x}-\boldsymbol{y}||_2^2.$$ The dictionary $$$\boldsymbol{A}$$$ was build according to the CylinderZeppelinBall model8: axons represented as cylinders with given radii and fixed longitudinal diffusivity $$$d_\parallel$$$, extra-axonal space modelled as anisotropic tensors with same $$$d_\parallel$$$, but different $$$d_\perp$$$, and also an isotropic diffusion compartment. The formulation considers each fiber as combination of calibers and, thus, allows multiple contributions to be defined per individual pathway. The estimated coefficients $$$\boldsymbol{x}$$$ that are associated with each fiber represent its volume weighted axon diameter distribution (ADD); from these values, we can compute the axon diameter index of each streamline in the tractogram following the principles introduced with AMICO9. The code is freely-available at https://github.com/daducci/COMMIT.
We tested our approach on 20 subjects acquired with the 3T human MRI scanner equipped with 300 mT/m gradients and freely-available in the MGH Adult Diffusion Data5. Whole-brain tractography was performed using probabilistic Particle Filtering Tractography10 to enforce streamline connecting the GM (1 seed/voxel). The tissue model was set as follows: 14 cylinders with radii equally-spaced in the range $$$0.5\,\mu\text{m}-7\,\mu\text{m}$$$, $$$d_\parallel=1.7\cdot10^{-3}\,\text{mm}^2/\text{s}$$$, $$$d_\text{iso}=3.0\cdot10^{-3}\,\text{mm}^2/\text{s}$$$ and 4 different values for $$$d_\perp$$$. From the Corpus Callosum, 5 regions of interest (ROI) were defined according to the FreeSurfer parcellation and the streamlines passing through them were extracted using the White Matter Query Language (WMQL)11. Figure 1 shows the streamlines labelled with different color according to the bundle segmentation. For each ROI, we selected all streamlines passing through it, computed their axon diameter index and plotted their distribution to show the axon composition of each bundle. These streamlines were selected in order to compare bundle-specific ADD with previous voxel-wise dMRI2-4,12 and histological1,13 studies.
Results and discussion
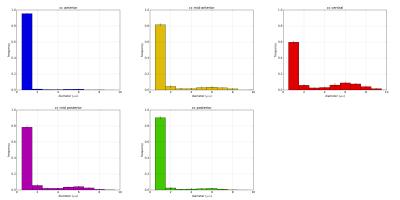
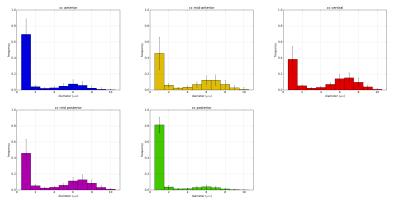
A first analysis on intra-scan variability of the bundle-specific ADD was performed on one subject using 5 different tractograms. Figure 2 demonstrate the reproducibility of the estimates as we find that bundle-specific ADD has low standard deviation across different tractograms in the same subject.
A second analysis on inter-subject variability was performed on 20 subjects of the dataset. In Figure 3 we report the possibility to recover similar pattern across different subjects. The bundle-specific ADD varies across subjects, however the low-high-low pattern is consistent. The analysis confirms that the bundles passing through the anterior (blue streamlines) and the posterior (green streamlines) contain more small-axons than streamlines passing through the mid-body. Furthermore, the study report that small-axons are predominant across the CC.
Our findings about the ADD of fiber bundles are compatible with the voxelwise ADD2-4,12 and histological analyses1,13 in the midsagittal slice of CC.
Conclusion
This study has shown the feasibility to recover ADD estimation in-vivo in the human brain, confirming the practicability to resolve bundle composed of axons of different calibers using microstructure informed tractography14-15. It also shows intra-scan and inter-subject reproducibility of the ADD's low-high-low pattern using HCP data. These experiments confirmed that the bundle-specific ADD is reproducible across subjects. A limitation of this study is in the parcellation of white matter and tractography. Future work will address these issue by segmenting the CC more accurately and future investigation of the influence of the tractography parameters will be performed in order to get tractograms more representative to the anatomy. Notwithstanding these limitations, this study showed that microstructure informed tractography can be used to obtain bundle-specific ADD estimations.Acknowledgements
No acknowledgement found.References
1. Aboitiz F, Scheibel AB, Fisher RS, and Zaidel E. Fiber composition of the human corpus callosum. Brain Research, 598(1–2):143 – 153, 1992.
2. McNab JA, Edlow BL, Witzel T, et al.. The human connectome project and beyond: Initial applications of 300 mt/m gradients. NeuroImage, 80:234 – 245,2013.
3. Assaf Y, Blumenfeld-Katzir T, Yovel Y, and Basser PJ. AxCaliber: a method for measuringaxon diameter distribution from diffusion MRI. Magnetic resonance in medicine, 59(6):1347–1354, 2008.
4. Barazany D, Basser PJ, and Assaf Y. In vivo measurement of axon diameter distribution inthe corpus callosum of rat brain. Brain, 132:1210–1220, 2009.
5. Setsompop K, Kimmlingen, Eberlein, et al. Pushing the limits of in vivo diffusion MRI for the humanconnectome project. NeuroImage, 80:220 – 233, 2013. Mapping the Connectome
6. Daducci A, Dal Palú A, Lemkaddem A, and Thiran J-P. A convex optimization framework for global tractography. In Proc. IEEE ISBI, pages 524–7, April 2013.
7. Daducci A, Dal Palú A, Lemkaddem A, and Thiran J-P. COMMIT: Convex Optimization Modeling for Microstructure Informed Tractography. IEEE Trans Med Imaging, 33(1):246–57,2014.
8. Panagiotaki E, Schneider T, Siow B, Hall MG, Lythgoe MF, and Alexander DC. Compartment models of the diffusion MR signal in brain white matter: A taxonomy and comparison. NeuroImage, 59(3):2241–2254, 2012.
9. Daducci A, Canales-Rodriguez EJ, Zhang H, et al.. Accelerated Microstructure Imaging via Convex Optimization (AMICO) from diffusion MRI data. Neuroimage, 105:32–44, 2015.
10. Girard G, Whittingstall K, Deriche R, and Descoteaux M. Towards quantitative connectivity analysis: reducing tractography biases. NeuroImage, 98:266 – 278,2014.
11. Wassermann D, Makris N, Rathi Y, et al. The white matter query language: a novel approach for describing human white matter anatomy. Brain Structure and Function, pages 1–17, 2016.
12. Alexander DC, Hubbard PL, Hall MG, et al. Orientationally invariant indices of axon diameter and density from diffusion MRI. NeuroImage, 52(4):1374–1389, 2010.
13. Lamantia AS and Rakic P. Cytological and quantitative characteristics of four cerebral commissures in the rhesus monkey. J Comp Neurol, 291(4):520–37, 1990.
14. Barakovic M, Romascano D, Dyrby TB, et al. Combining tractography and microstructure to assess bundle-specific axon diameter distributions. ISMRM Diffusion Workshop,2016.
15. Barakovic M, Romascano D, Dyrby TB, et al. Assessment of bundle-specific axon diameter distributions using diffusion mri tractography. OHBM, 2016.
Figures


