3386
Quantification of pore size distributions using double diffusion encoding: assessment of the feasibility on a clinical system1Medical imaging dept, St-Luc University hospital, Université Catholique de Louvain, Brussels, Belgium
Synopsis
Recently, Double Diffusion Encoding (DDE) has been proposed for quantification of pore size distributions in a voxel or a Region Of Interest. Although the technique has been validated on animals with experimental MR systems, its translation to human scanners is challenging, mainly because of the limited gradient strength available on clinical systems. In this work, we present a validation of DDE on a clinical scanner on a biological phantom (asparagus). Furthermore, we restricted the acquisition time to 16 minutes which remains acceptable in clinical conditions.
Purpose
Double Diffusion Encoding (DDE) allows quantification of Pore Size Distributions (PSD) in a voxel or a Region Of Interest1,2 (ROI) . Recently, this technique has been validated on animals with experimental scanners3 using large scan times (several hours). In this work, we demonstrate the feasibility and validate PSD estimation on a clinical scanner with acceptable scan time on a biological phantom (asparagus).Methods
We implemented a DDE sequence (double spin echo with single shot EPI read out of the second echo) on an Achieva 3T scanner (Philips, Best, The Netherlands). The two gradient pairs had identical diffusion time and zero mixing time. Six white asparagus stems were placed in a wrist antenna (4 Channels) with their axis aligned with the z-direction (Feet-Head). Five axial slices (thickness 4 mm) were imaged with 2mm*2mm in plane resolution (acquisition) and 1.35mm for reconstruction. Diffusion parameters were: 6 equidistant q-values from 0 to 40mm-1 by stepping the gradient pulses (duration δ=12.6ms) from 0 to 80mT/m and diffusion time ∆=60ms. Five equidistant angles θ between the two gradient pairs were used, ranging from 0 to 180° in the xy-image plane (first pair was along the y-direction). Other parameters were: TE=162ms, TR=4654ms, SENSE factor=2, NSA=8 leading to a scan time=16min. An extra standard DTI sequence with 32 gradient directions and b=800s/mm2 with the same resolution as DDE was performed in order to locate the fibers of the pro-epidermis. The signal attenuation EV of a voxel ($$$\frac{S(q,\theta)}{S(q=0)}$$$) is :
$$E_V(q,\theta)=\sum_{i=1}^N f_i.E(q,\theta,a_i) \qquad[1]$$
where N is the number of sampled pore sizes, E is the attenuation for a cylindrical pore of radius ai and fi is its volume-weighted contribution. The relative probability is then Pi= fi/ai2 and the PSD is given3 by the ensemble of Pi normalized to 1. E was calculated numerically with the MCF method4 and we used N=20. A parametric estimation was performed assuming a log-normal distribution (2 parameters: µ and σ). Note that a gaussian contribution was added in eq. [1] but was always found to be negligible in our work. For validation, light microscopy was performed wherefrom PSD estimations where obtained using ImageJ software (National Institutes of Health, USA). Pore sizes can also be obtained from DDE using only one q-value and two angles (0 and 180°) and thus with reduced scan time. The mean radius of gyration <r2> is then estimated through1,5 :
$$<r^2>=(3/2)\frac{E_V(q,180°)-E_V(q,0)}{q^2} \qquad [2]$$
For a cylinder, <r2>=a2/2. We compared the
results of both methods.
Results
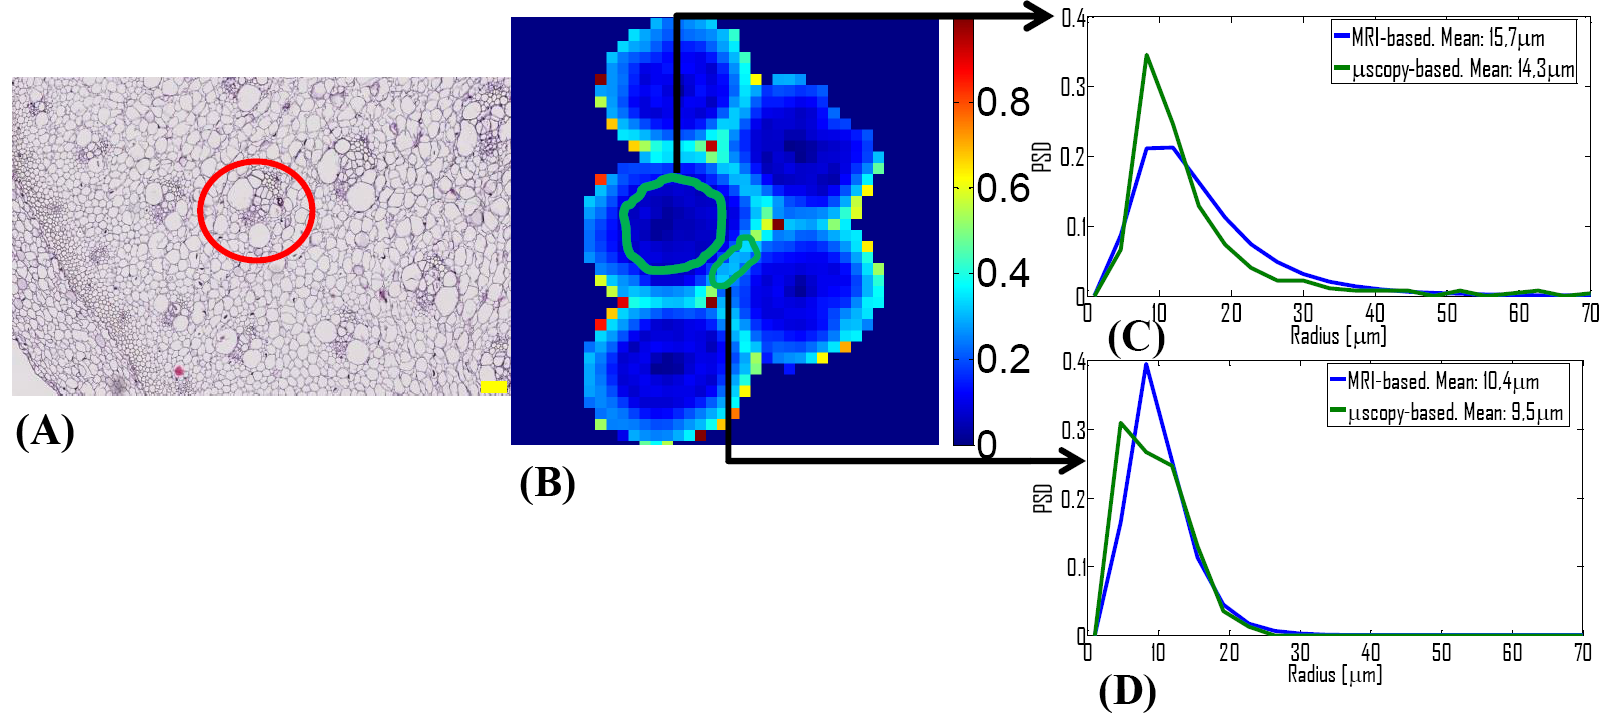
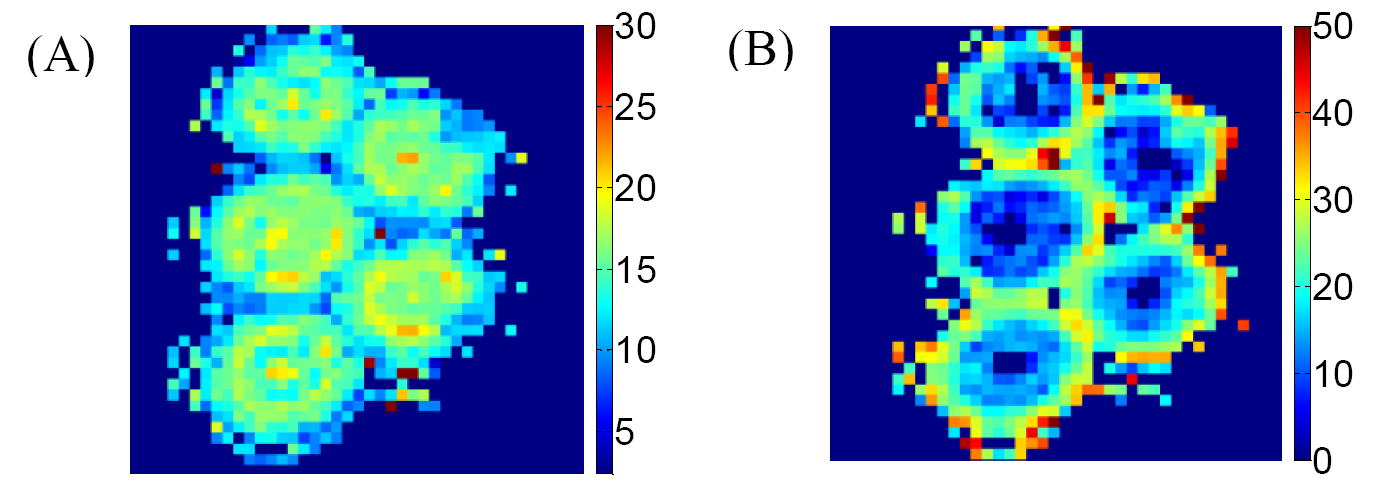
Figure 1 (A) shows a microscopy image of an asparagus. In the bottom-left corner, the pro-epidermis can be seen as well as a vascular bundle in the red circle. Both these cylindrical structures yield a detectable MR signal while the remaining parenchyma (e.g. spheres) cannot be observed6 at the long TE=162ms. In Fig. 1 (B), a fractional anisotropy map obtained from DTI is shown. In Fig. 1 (C) and (D), the PSD’s calculated with MRI (blue) and microscopy (green) are shown for two ROI’s: one in the pro-epidermis and the other enclosing vascular bundles scattered through the asparagus. Finally, two size (radius) maps are displayed in Fig. 2. In Fig. 2 (A), the PSD is estimated in each voxel from which we calculated the mean size. In Figure 2 (B), in each voxel, the radius is derived from <r2> with q=21mm-1.Discussion and conclusion
Our estimated PSD’s seem to agree with those obtained from microscopy. However, the mean radius was overestimated by 10% in both ROI’s. A part of the explanation may reside in an unavoidable sample shrinkage that occurs during its preparation for microscopy. Size maps obtained on the basis of <r2> were inconsistent with microscopy as they exhibited larger pore sizes in the pro-epidermis than in the scattered vascular bundles. Moreover, the results were very dependent on the used q-value. PSD estimations are more accurate because they take the whole distribution into account at expense of longer scan times (i.e. using more data). Note that we also tried nonparametric estimation methods7 (least squares and Tikhonov regularization) to estimate the Pi’s. However, only the presented parametric method yielded acceptable results. In conclusion, PSD estimation seems to be feasible on a clinical scanner within an acceptable scan time. The method will be further optimized to reduce scan time and/or improve the quality of the parametric maps.Acknowledgements
No acknowledgement found.References
1) Callaghan PT. Translational Dynamics & magnetic resonance. Oxford University Press (2011).
2) Benjamini D, Komlosh ME, Basser PJ, Nevo U. Nonparametric pore size distribution using d-PFG: comparison to s-PFG and migration to MRI. J Magn Reson. 2014; 246: 36-45.
3) Benjamini D, Komlosh ME, Holtzclaw LA, Nevo U, Basser PJ. White matter microstructure from nonparametric axon diameter distribution mapping. Neuroimage. 2016;15;135:333-44.
4) Ozarslan E, Shemesh N, Basser PJ. A general framework to quantify the effect of restricted diffusion on the NMR signal with applications to double pulsed field gradient NMR experiments. J Chem Phys. 2009; 14;130(10):104702.
5) Koch MA, Finsterbusch J. Towards compartment size estimation in vivo based on double wave vector diffusion weighting. NMR Biomed. 2011 Dec;24(10):1422-32.
6) Lätt J, Nilsson M, Rydhög A, Wirestam R, Ståhlberg F, Brockstedt S. Effects of restricted diffusion in a biological phantom: a q-space diffusion MRI study of asparagus stems at a 3T clinical scanner. MAGMA. 2007;20(4):213-22.
7) Aster R, Borchers B, Thurber C. Parameter estimation and inverse problems. Elsevier Academic Press (2012).
Figures