3384
Oscillating gradient improves the sensitivity of diffusion functional MRI1Radiology, Johns Hopkins University School of Medicine, BALTIMORE, MD, United States, 2Neuroimaging Research Branch, National Institute on Drug Abuse, Intramural Research Program, National Institutes of Health, Baltimore, MD, United States, 3Radiology, New York University School of Medicine, NY, United States
Synopsis
Synopsis: Diffusion functional MRI (DfMRI) has been proposed to detect neuronal activations more directly than BOLD-fMRI, but its sensitivity to cell swelling associated with neuronal activities remains less known. Numerical simulations suggest that oscillating gradient spin echo (OGSE) diffusion MRI is more sensitive to changes in cell size than conventional pulsed gradient spin echo (PGSE) diffusion MRI. In adult rat brain DfMRI experiments with forepaw stimulation, ADC measured by OGSE showed significant reductions during stimulation, and the reductions were significantly larger than those measured by PGSE, suggesting OGSE may be more sensitive to cell swelling associated with neuronal activation than PGSE.
Purpose
Diffusion function MRI (DfMRI) has been proposed as a more direct approach to detect neuronal activities than BOLD-based fMRI1, assuming that DfMRI signals reflect neuronal swelling during activation. However, the sensitivity of DfMRI to neuronal activation has not been well established. Some studies argued that the vascular components2,3 still have considerable effects on DfMRI signals. A recent in-vitro study reported that DfMRI can detect neuronal depolarization induced by pharmacological manipulations, but not by physiological stimulation4. Given this evidence, it is necessary to improve the sensitivity of DfMRI to cell swelling during normal neuronal activity.
In recent years, time-dependent diffusion MRI (dMRI) has been used to distinguish microstructural changes based on their spatial scales5. The development of oscillating gradient spin echo (OGSE) sequences allows us to achieve relatively short diffusion times to detect changes at small spatial scales6. In this study, we hypothesized that the OGSE-based DfMRI sequence can increase the sensitivity to detect neuronal activities than conventional pulsed gradient spin echo (PGSE)-based DfMRI.
Methods
Experiments were performed on adult Sprague-Dawley rats (n=5) using a 9.4 T MRI system by measuring the fMRI responses to electrical forepaw stimulation. Details on animal preparation and anesthesia can be found in (7). The stimulation paradigm consisted of seven alternating cycles of 40 s ON/40 s Off, starting with a 20-s pre-stimulation baseline. The acquisition included gradient-echo EPI (GE-EPI), PGSE-EPI (δ/Δ=10/13.8 ms, b=700 and 1500 s/mm2), and OGSE-EPI (f=100 Hz, one oscillating cycle, b=700 s/mm2). The imaging parameters were: FOV = 35x35 mm, matrix size = 64x64, TE = 13 ms for GE-EPI and 41.4 ms for PGSE/OGSE-EPI, TR = 1 s, 5 slices with a thickness of 1mm. After initial GE-EPI data showed positive BOLD responses in the sensory cortex, non-diffusion-weighted and diffusion-weighted images were acquired in an interleaved fashion, from which the temporal changes in apparent diffusion coefficient (ADC) were obtained. The stimulation session was repeated three times for each acquisition modality. The DfMRI data were analyzed using the AFNI software, and regions of interest were defined as the location of activation in the sensory cortex based on the non-diffusion-weighted images on individual rats. Numerical simulation of cell phantom was performed using the MIST Toolbox8, with an intracellular diffusivity of 2x10⁻³ mm2/s, sphere radius from 1-15 μm, and PGSE and OGSE waveforms that were matched to the rat brain experiments.Results
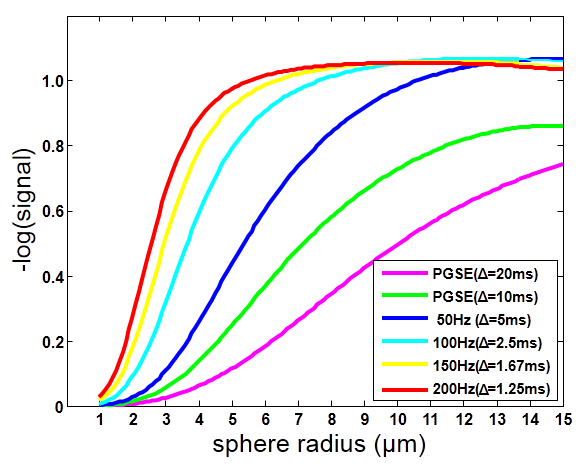
Numerical simulations (Fig. 1) of dMRI signals from a phantom of packed spheres showed that signals measured using OGSE-dMRI (50 Hz to 200 Hz, equivalent diffusion time = 5 ~ 1.25 ms) have higher sensitivity to cell swelling than PGSE-dMRI (diffusion time = 10 and 20 ms). The slopes of the curves reflect the sensitivity of dMRI signals to changes in sphere radius, as in the case of cell swelling. The OGSE-dMRI curves rise faster than PGSE-dMRI for sphere radius in the range of 1 to 10 μm, which is approximately the size of neurons.
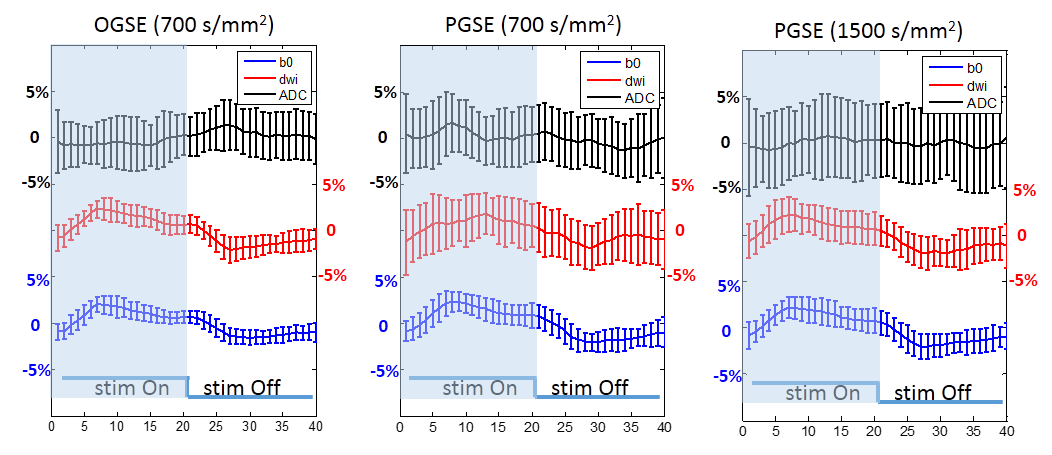
In the in-vivo experiments, forepaw stimulation induced an increase in MRI signals in both non-diffusion-weighted and the diffusion-weighted images (either PGSE or OGSE) (Fig. 2). However, for the ADC measurements, only the time course of OGSE-ADC showed a slight decrease when stimulation was ON. Averaged signals during stimulation-on and -off periods showed that the non-diffusion-weighted and diffusion-weighted signals had approximately 2% increases (Fig. 3A-B). The average ADCs measured using OGSE during stimulation showed a 1% reduction compared to that without stimulation (Fig. 3C). In comparison, the ADC measured by PGSE at b=700 s/mm2 showed no significant difference between stimulation on and off; and ADC at b=1500 s/mm2 showed approximately 0.5% signal reduction during stimulation, which was slightly lower compared that from the OGSE experiments (p = 0.037, paired one-tailed t-test).
Discussion
Neuronal activation is likely to cause only
small changes in the cell size4. The
simulation and in-vivo experiments suggest that OGSE dMRI has higher
sensitivity to neuronal activation than conventional PGSE dMRI. The experiments
were designed to minimize the contributions from the vascular components. By
computing ADCs based on interleaved non-diffusion-weighted and
diffusion-weighted signals, the effects of changes in T2 and vascular occupancy
were mostly removed. In addition, the OGSE waveform is less sensitive to the
effects of background gradients9. In comparison, the ADC measured by PGSE at
b=1500 s/mm2 has higher sensitivity than that at b=700 s/mm2,
which has been suggested to be more sensitive to background gradient effects. Conclusion
Our results suggest that the OGSE sequence is more sensitive to PGSE sequence in detection of neuronal activities.Acknowledgements
This work was made possible by the following funding supports: R01HD074593 (JZ) and R21 NS098018 (DW).References
1. Darquié A, Poline JB, Poupon C, Saint-Jalmes H, Le Bihan D. Transient decrease in water diffusion observed in human occipital cortex during visual stimulation. Proc. Natl. Acad. Sci. U.S.A. 2001;98:9391–5.
2. Miller K, Bulte D, Devlin H, Robson M, Wise R, Woolrich M, Jezzard P, Behrens T. Evidence for a vascular contribution to diffusion FMRI at high b value. Proceedings of the National Academy of Scinces 2007;104:20967–20972.
3. Pampel A, Jochimsen T, Möller H. BOLD background gradient contributions in diffusion-weighted fMRI—comparison of spin-echo and twice-refocused spin-echo sequences. NMR in Biomedicine 2010;23:610–618.
4. Bai R, Stewart C, Plenz D, Basser P. Assessing the sensitivity of diffusion MRI to detect neuronal activity directly. Proceedings of the National Academy of Sciences 2016;113:E1728–E1737.
5. Gore J, Xu J, Colvin D, Yankeelov T, Parsons E, Does M. Characterization of tissue structure at varying length scales using temporal diffusion spectroscopy. NMR in Biomedicine 2010;23:745–756.
6. Does M, Parsons E, Gore J. Oscillating gradient measurements of water diffusion in normal and globally ischemic rat brain. Magnetic Resonance in Medicine 2003;49:206–15.
7. Lu H, Zou Q, Gu H, Raichle ME, Stein EA, Yang Y. Rat brains also have a default mode network. Proc. Natl. Acad. Sci. U.S.A. 2012;109:3979–84.
8. Drobnjak I, Siow B, Alexander D. Optimizing gradient waveforms for microstructure sensitivity in diffusion-weighted MR. Journal of Magnetic Resonance 2010;206:41
9. Hong X, Dixon TW. Measuring diffusion in inhomogeneous systems in imaging mode using antisymmetric sensitizing gradients. Journal of Magnetic Resonance 1992;99:561–570.
Figures