3382
Biomarkers for fiber density: comparing Stejskal-Tanner diffusion encoding metrics with microscopic diffusion anisotropy from double-diffusion encoding imaging1Department of Systems Neuroscience, Medical Center Hamburg-Eppendorf, Hamburg, Germany, 2Max Planck Institute for Human Cognitive and Brain Sciences, Leipzig, Germany, 3UCL Institute of Cognitive Neurology, University College London
Synopsis
Different MRI biomarkers for fiber and myelin density have been proposed for MR g-ratio mapping, leaving open the question which biomarker is optimal. Here, we compare four different MRI biomarkers for fiber density using standard
Purpose
The recent development on a highly flexible biophysical model that relates the microscopic g-ratio, only accessible by ex vivo histology, to MRI biomarkers for the myelin and fiber compartment (1), shows promising results for in vivo mapping g-ratio, here dubbed MR g-ratio. Different MRI biomarkers have been proposed for MR g-ratio mapping, leaving open the question which biomarker is optimal. A recent study has compared suitable biomarkers for the myelin compartments (2) but not for fiber density biomarkers. A fundamental problem of most current models for fiber density is that they are estimated from the standard Stejskal-Tanner (ST) diffusion encoding (3). Consequently, these models need to disentangle the influence of macroscopic arrangements (e.g., dispersion and fiber crossing (4)) from microscopic properties (e.g., fiber density) of fiber pathways on the diffusion signal. The microscopic diffusion anisotropy (MA), which is estimated by the double-diffusion encoding technique (5), is solely sensitive to the microscopic properties of fiber pathways (6). As such, it can serve as a silver standard for measuring the microscopic properties of fiber pathways. Therefore, we hypothesize that a better measure of the microscopic environment shows higher (and more significant) correlations to the MA metric. The purpose of this study is to test the similarity of four ST-diffusion encoding based biomarkers for fiber density to the silver-standard MA metric: (i) tract fiber density (TFD) (7), (ii) intra-cellular volume fraction (icvf) (8,9), (iii) microscopic fractional anisotropy (μFA) (10), and (iv) fractional anisotropy (FA). Thereby, the additional comparisons to μFA and FA are included for sanity checking: μFA should correlate very well (as it specifically models the microscopic anisotropy) and FA should correlate less well, as the diffusion tensor model does not sufficiently model the influence of the macroscopic arrangement of fibers on the diffusion signal (4).Methods
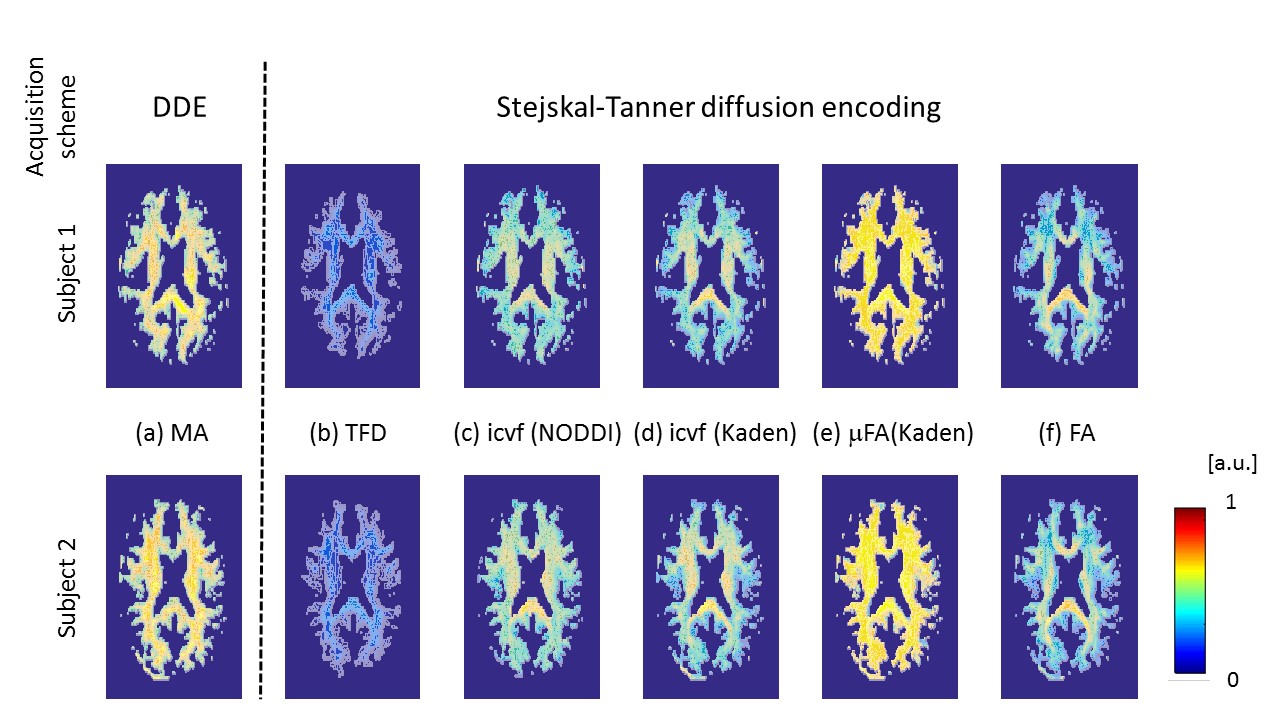
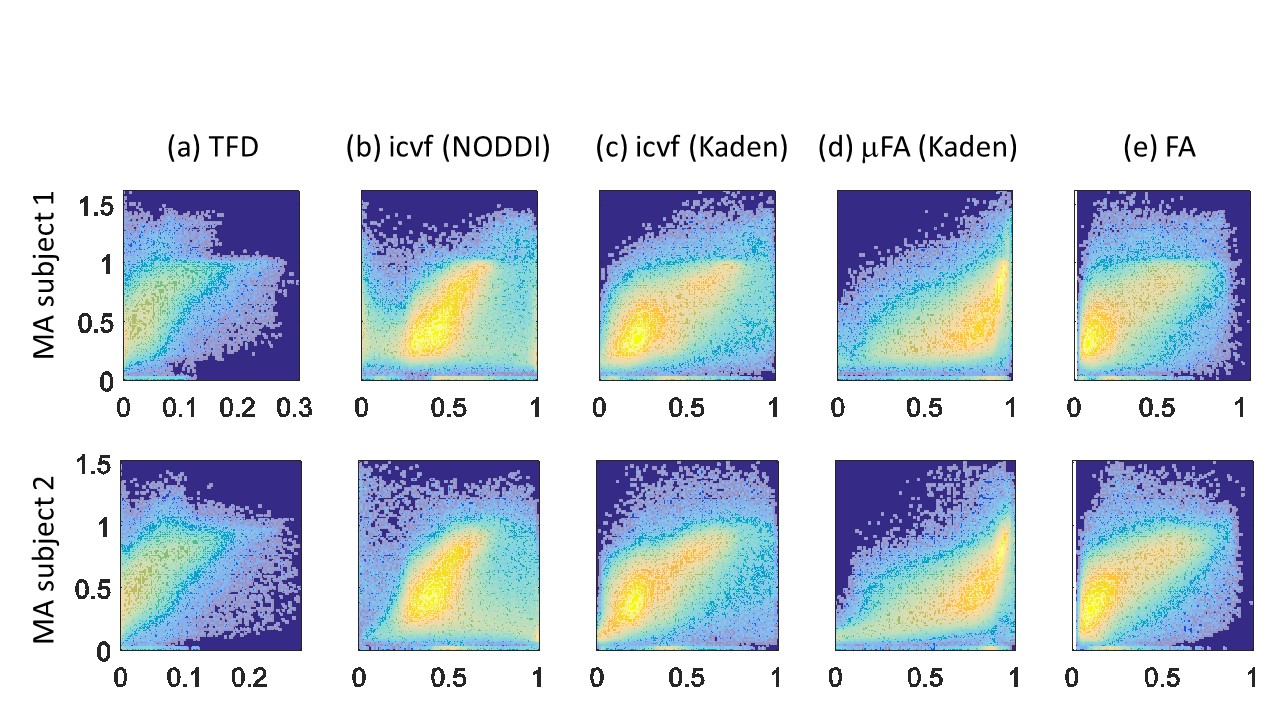
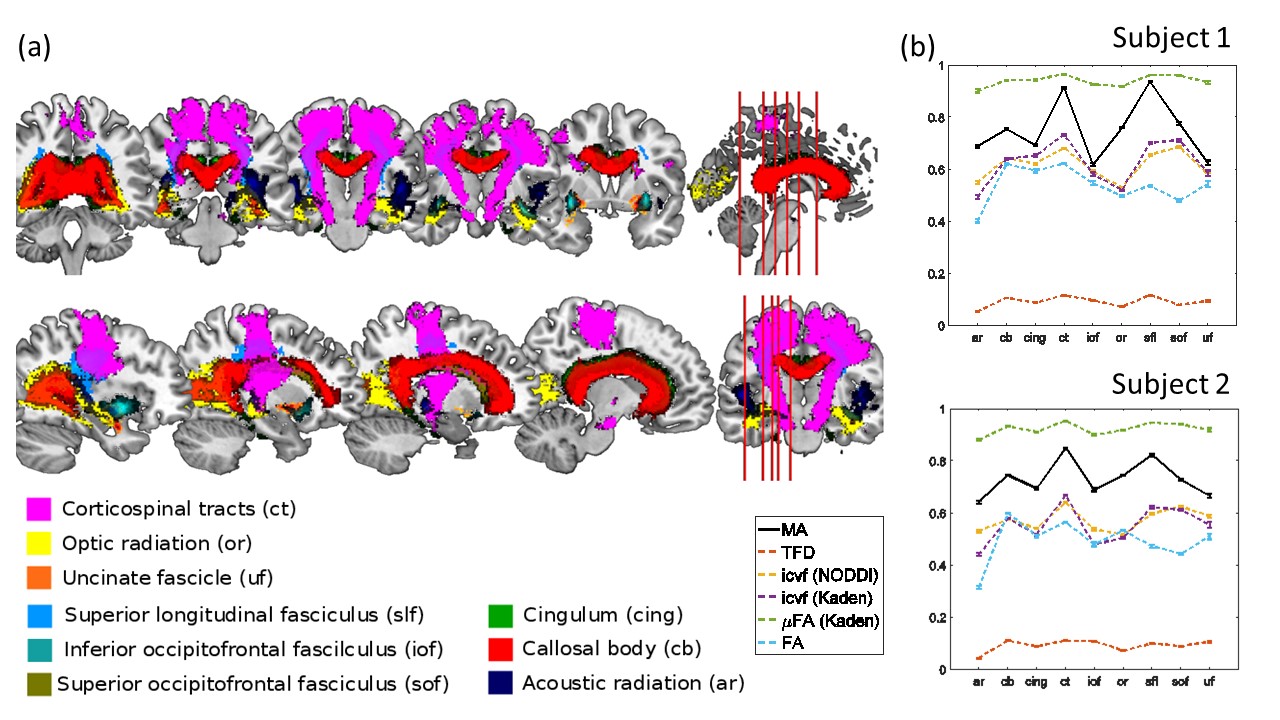
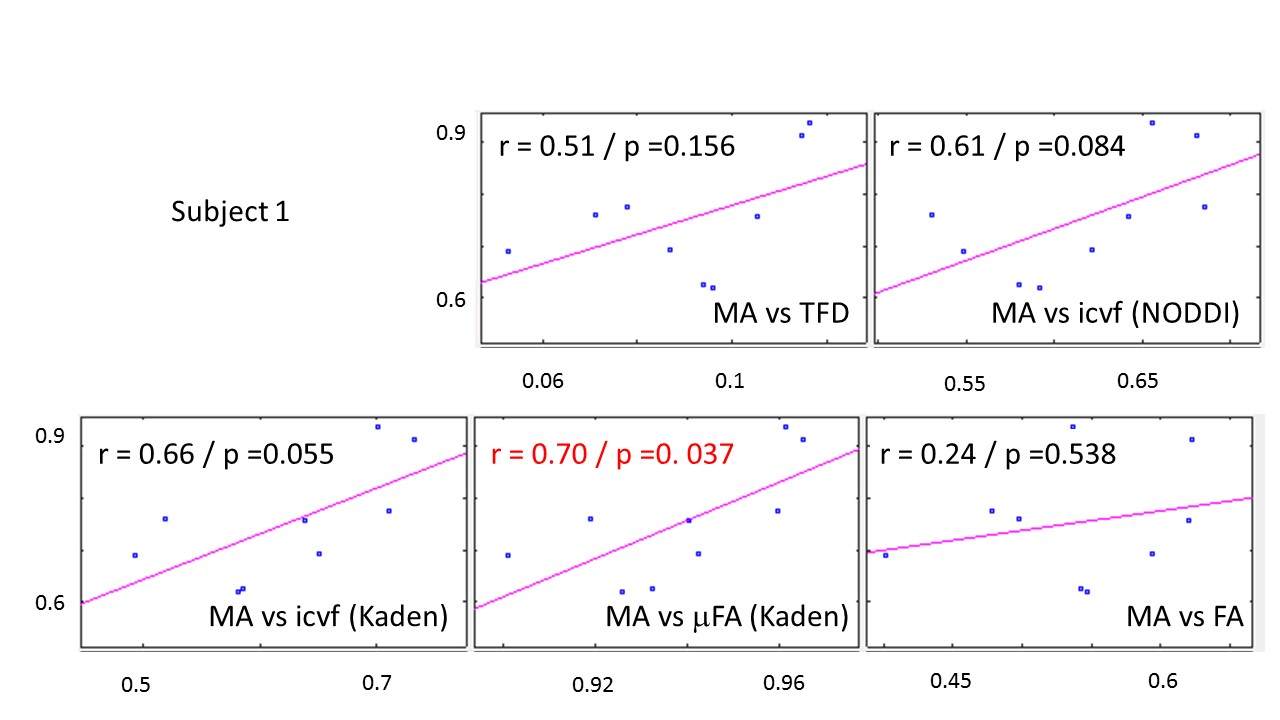
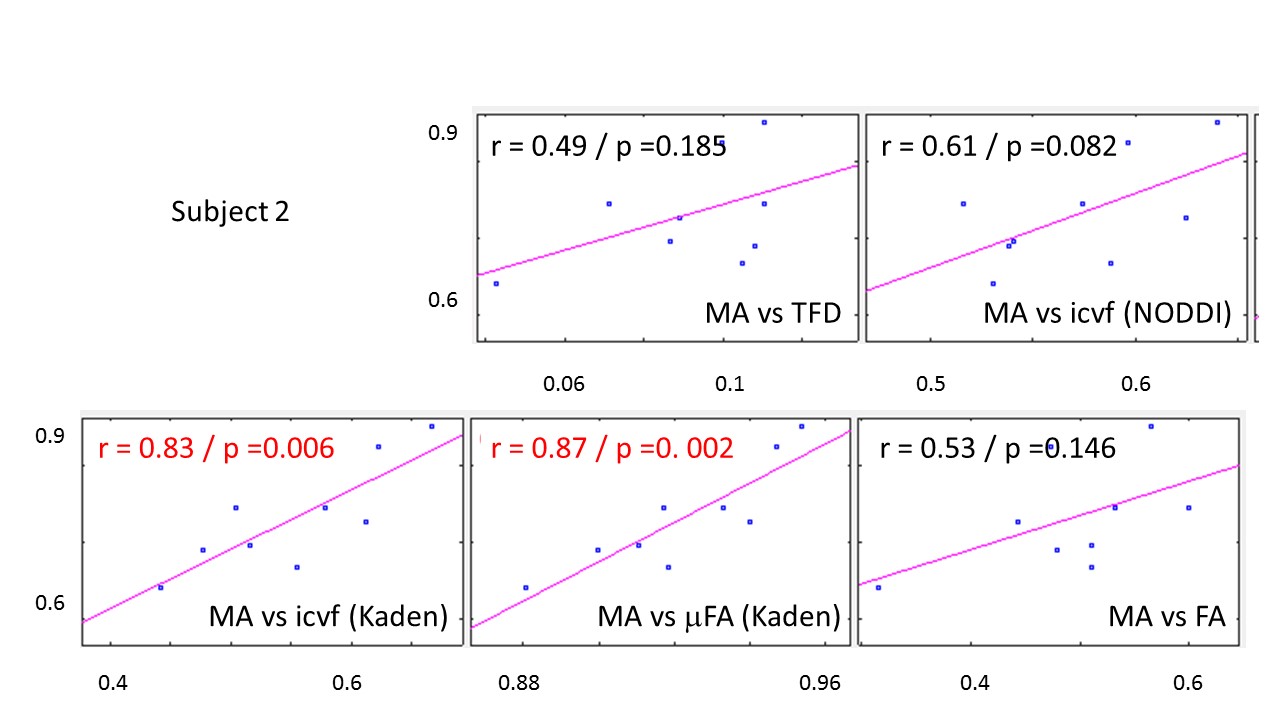
MRI: A multi-shell diffusion-weighted imaging protocol was acquired on 2 healthy volunteers with the following details: 1.6 mm isotropic spatial resolution, b-values of b=1000 s/mm2, b=2000 s/mm2, 60 directions for each shell, 12 reference images without diffusion weighing (b=0 s/mm2), all repeated with reversed phase-encoding directions, making 264 images per subject. MRI was performed on a 3T Tim TRIO system (Siemens, Erlangen). Analysis: Data analyses were performed using: MATLAB (The MathWorks, Natick, MA, R2014b); statistical parametric mapping (SPM12, London) and DARTEL (11) for spatial registration; the ACID toolbox for pre-processing and diffusion tensor fitting (12,13); Fibertools (7) for calculating the TFD; the NODDI toolbox (9) for calculating icvf (NODDI); and the Spherical Mean Technique (SMT) toolbox (8,10) for calculating the icvf (Kaden) and μFA (Kaden). For quantitative comparison the median and standard error within 9 major fiber tracts (Fig. 3a) were calculated for the metrics MA, icvf (NODDI), icvf (Kaden), μFA (Kaden), and FA. Fiber tracts were selected from the SPM anatomy toolbox (14).Results and Discussion
The whole-brain comparisons (Fig. 1 and 2) showed qualitative agreement between the two subjects. The μFA biomarker by Kaden et al. (8) showed the highest correlation to MA, and TFD the lowest (Fig. 4 and 5). When comparing the correlation between MA and the two icvf metrics, the metric by Kaden et al. outperformed the NODDI metric. Since the two icvf models differed only in the way they handled macroscopic fiber arrangements (NODDI used a single Watson distribution (9) and Kaden et al. used the STM (10)), we can conclude that STM better accounts for the macroscopic fiber arrangement than NODDI. However, one should bear in mind that drawing conclusions from this correlative comparison about the sensitivity of the ST-based biomarkers for fiber density is difficult because the MA is not only sensitive to fiber density but also to other microscopic properties such as the pore size (6). This makes the interpretation of the low and not significant correlation coefficient between TFD and MA particularly difficult: is it because TFD is less sensitive to microscopic fiber properties or because it is sensitive to different compartments, i.e. to fiber density but not to pore size?Conclusion
The fact that the icvf metric by Kaden et al. shows higher correlation to MA than NODDI could mean it better disentangles macroscopic from microscopic properties of fiber pathways and thus serves better as a biomarker for the fiber density than the NODDI based icvf. However, these preliminary results are drawn from two subjects only and need to be confirmed within a larger group of subjects.Acknowledgements
SM received funding from the EU's Horizon 2020 / MSC grant agreement no. 658589.References
(1) Stikov N, Campbell JSW, Stroh T, Lavelée M, Frey S, Novek J, Nuara S, Ho M-K, Bedell BJ, Dougherty RF, Leppert IR, Boudreau M, Narayanan S, Duval T, Cohen-Adad J, Picard P-A, Gasecka A, Côté D, Pike GB. In Vivo Histology of the Myelin G-Ratio with Magnetic Resonance Imaging. NeuroImage 2015;118:397–405.
(2) Campbell J, Leppert I, Boudreau M, Narayanan S, Duval T, Cohen-Adad J, Pike GB, Stikov N. inProc Intl Soc Mag Reson Med 24 2016 Abstr. 1501,2016.
(3) Stejskal EO, Tanner JE. Spin Diffusion Measurements: Spin Echoes in the Presence of a Time-Dependent Field Gradient. J. Chem. Phys. 1965;42:288.
(4) Jones DK, Knösche TR, Turner R. White Matter Integrity, Fiber Count, and Other Fallacies: The Do’s and Don’ts of Diffusion MRI. NeuroImage 2013;73:239–254.
(5) Lawrenz M, Koch MA, Finsterbusch J. A Tensor Model and Measures of Microscopic Anisotropy for Double-Wave-Vector Diffusion-Weighting Experiments with Long Mixing Times. J. Magn. Reson. San Diego Calif 1997 2010;202:43–56.
(6) Lawrenz M, Brassen S, Finsterbusch J. Microscopic Diffusion Anisotropy in the Human Brain: Reproducibility, Normal Values, and Comparison with the Fractional Anisotropy. NeuroImage 2015;109:283–297.
(7) Reisert M, Mader I, Umarova R, Maier S, Tebartz van Elst L, Kiselev VG. Fiber Density Estimation from Single Q-Shell Diffusion Imaging by Tensor Divergence. NeuroImage 2013;77:166–176.
(8) Kaden E, Kelm ND, Carson RP, Does MD, Alexander DC. Multi-Compartment Microscopic Diffusion Imaging. NeuroImage 2016;139:346–359.
(9) Zhang H, Schneider T, Wheeler-Kingshott CA, Alexander DC. NODDI: Practical in Vivo Neurite Orientation Dispersion and Density Imaging of the Human Brain. NeuroImage 2012;61:1000–1016.
(10) Kaden E, Kruggel F, Alexander DC. Quantitative Mapping of the per-Axon Diffusion Coefficients in Brain White Matter. Magn. Reson. Med. 2016;75:1752–1763.
(11) Ashburner J. A Fast Diffeomorphic Image Registration Algorithm. NeuroImage 2007;38:95–113.
(12) Mohammadi S, Möller HE, Kugel H, Müller DK, Deppe M. Correcting Eddy Current and Motion Effects by Affine Whole-Brain Registrations: Evaluation of Three-Dimensional Distortions and Comparison with Slicewise Correction. Magn Reson Med 2010;64:1047–1056.
(13) Mohammadi S, Hutton C, Nagy Z, Josephs O, Weiskopf N. Retrospective Correction of Physiological Noise in DTI Using an Extended Tensor Model and Peripheral Measurements. Magn. Reson. Med. 2013;70:358–369.
(14) Eickhoff SB, Stephan KE, Mohlberg H, Grefkes C, Fink GR, Amunts K, Zilles K. A New SPM Toolbox for Combining Probabilistic Cytoarchitectonic Maps and Functional Imaging Data. NeuroImage 2005;25:1325–1335.
Figures