3381
Microstructural Information from Modeling of the SDE and DDE MRI Signals in the Spinal Cord1School of Chemistry, The Raymond and Beverly Sackler Faculty of Exact Sciences, Tel Aviv University, Tel Aviv, Israel, 2School of Mathematical Sciences, The Raymond and Beverly Sackler Faculty of Exact Sciences, Tel Aviv University, Tel Aviv, Israel, 3Sagol School of Neuroscience, Tel Aviv University, Tel Aviv, Israel
Synopsis
Various diffusion MRI approaches were suggested to study the complex water diffusion in neuronal tissues and gleaning microstructural information thereof. Nevertheless, to date, only few attempts were done to correlate between the microstructural features obtained from single diffusion encoding (SDE) and double diffusion encoding (DDE) MRI experiments. The main objective of the present study is to compare between the microstructural information obtained from both diffusion MRI methodologies, under similar experimental conditions, when performed on a fixed porcine spinal cord.
Background
Various diffusion MR approaches were employed to study complex water diffusion in neuronal tissues1. Those were usually based on single diffusion encoding (SDE) MR experiments. More recently, double diffusion encoding (DDE) MR experiments were proposed as an additional means for characterizing water diffusion and potentially suggesting gleaning microstructural information. Furthermore, DDE MR experiments were suggested as a means to observe microscopic anisotropy in macroscopically isotropic systems2. The mathematical equivalence between SDE and DDE MR was pointed out3. However, to date only few attempts were made to compare between the microstructural features obtained from SDE and DDE MR experiments performed on neuronal tissues4-6. The purpose of the present study is to compare between the microstructural information obtained from both methodologies when performed on a fixed porcine spinal cord (SC). Here, the data was analyzed by fitting every pixel as a superposition of a free diffusing component and a series of restricted components having infinite cylindrical geometries based on previous methods4-8.Methods
Diffusion MRI experiments were conducted on a 14.1T NMR spectrometer equipped with a 3 T/m gradients system. Fixed SC of a seven-week-old pig was immersed in PBS overnight, placed in an 8 mm NMR tube filled with Fluorinert. Two shot SDE and DDE EPI sequences were used. One 2 mm slice was acquired with a FOV of 8.5×8.5 mm2 and a matrix of 128×128, resulting in an in-plane resolution of 0.066×0.066 mm2. Both SDE and DDE experiments were performed perpendicular to the main axis of the SC with similar experimental parameters: TR=3000 ms, δ=2.5 ms and Δ/TE of 20/54, 30/74 and 40/94. The SDE MRI experiments were performed with G= [2…2360] mT/m (40 equal steps, qmax=251.2 mm-1) and NA=140. The angular DDE MRI experiments were performed with φ= [0ᵒ…360ᵒ] (13 equal steps), |G1|=|G2|= [960…1200] mT/m (5 equal steps, qmax=127.7 mm-1) and NA=92. The fitting procedures were performed by using a pixel-by-pixel analysis according to the method previously outlined in references4-8. The SDE and DDE signals were modeled as a superposition of the MR signals arising from the different components or compartments (neglecting exchange). Each of the restricted or free diffusing components were modeled as a solution of the Bloch Torrey equation using the Multiple Correlation Function for infinite cylinder with specific radii or free diffusion, respectively7,8. The assumption is that the restricted compartments in the tissue have continued weight distributions of the radii. The optimization was carried out using the CVX tool9. The only parameters that were determined by the user were ADC (0.5·10-9 m2/s) and the range of radii (0.1:10 µm, 40 equal steps) one wishes to explore.Results and Discussion
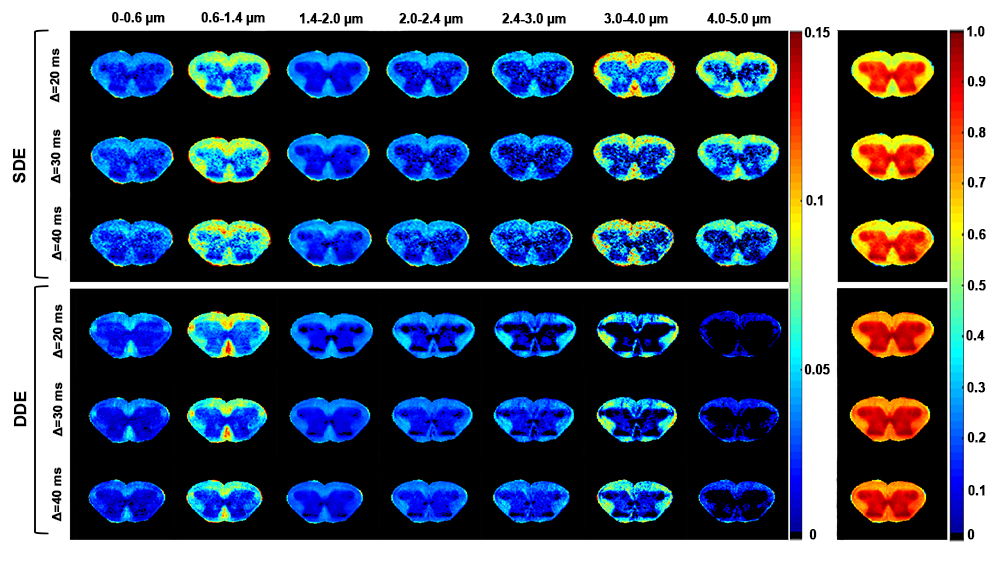
Figure 1 shows the axon diameter maps obtained from SDE and DDE MRI experiments performed at several diffusion times. A clear distinction between the white and gray matter areas is observed, as expected, in all of the axon diameter distribution maps. The fraction maps obtained with different diffusion times are similar, implying that the restricted diffusion is well characterized under these experimental conditions. When comparing the SDE and DDE maps, the relatively larger fractions in the white matter are observed for the diameter ranges of 0.6-1.4 µm and 3-4 µm. Moreover, for the SDE experiments we found also a relatively large fraction of diameters in the range of 4-5 µm, which is not observed in the DDE experiments. In addition, the free diffusion maps extracted from the DDE experiments show somewhat larger fractions than those obtained from the SDE experiments.
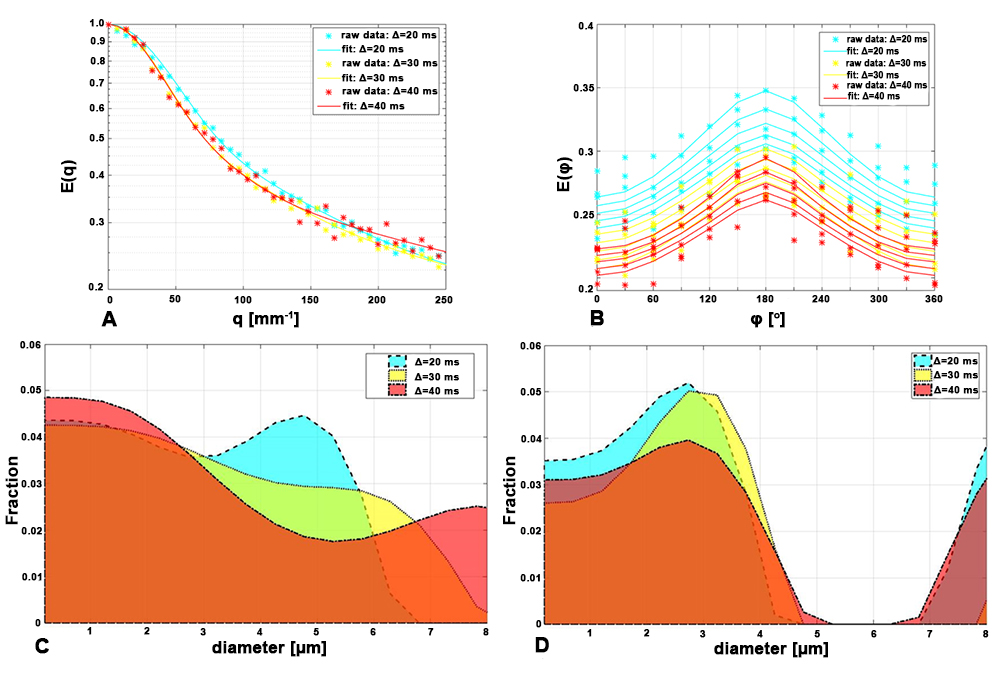
Figure 2 shows the fitting of the data along with histograms of diameters and their fractions for one representative pixel obtained from the SDE and DDE MRI experiments using different diffusion times. The model is capable of fitting the experimental data accurately, even though the SNR is limited. The range of diameters captured by SDE, appear to be larger than those extracted from the DDE experiments. Two fraction peaks of average diameters are observed for the SDE experiments, showing some diameters which appear to be beyond the limit of the restricted diameters range. However, the DDE experiments show one relatively narrow distribution of diameters with a mean of about 2 µm. Thus, it appears that the DDE MRI experiments, and the present experimental conditions, provide a somewhat more reliable estimation of the structural characteristics of the sample.
Conclusion
Modeling of signals from SDE and DDE MRI experiments provides a successful means in characterizing the white matter microstructure of a porcine SC with no prior knowledge about the diffusion characteristics and the number of restricted compartments that are present.Acknowledgements
No acknowledgement found.References
1. Jones DK. Diffusion MRI: theory, methods, and applications. New York: Oxford University Press, 2010. 2. Finsterbusch J. Multiple-wave-vector diffusion-weighted NMR. Annu Rep NMR Spectrosc. 2011; 72: 225-299. 3. Jespersen SN, Equivalence of double and single wave vector diffusion contrast at low diffusion weighting. NMR in Biomed. 2012; 25(6): 813-818. 4. Morozov D, Bar L, Sochen N, Cohen Y. Microstructural information from single-pulsed-field-gradient and angular double-pulsed-field-gradient NMR: from model systems to nerves. The ISMRM 23rd annual meeting and exhibition. Toronto, Ontario, Canada. 2015; 1998. 5. Morozov D, Bar L, Sochen N, Cohen Y. Modeling of the diffusion MR signal in calibrated model systems and nerves. NMR in Biomed. 2013; 26(12): 1787-1795. 6. Morozov D, Bar L, Sochen N, Cohen Y. Microstructural information from angular double-pulsed-field-gradient NMR: From model systems to nerves. Magn Reson Med. 2015; 74(1): 25-32. 7. Grebenkov DS. Laplacian eigenfunctions in NMR. I. A numerical tool. Concepts Magn Reson (A). 2008; 32A(4): 277-301. 8. Bar L, Sochen N. A spectral framework for NMR signal with restricted diffusion. Concepts Magn Reson (A). 2015; 44(1): 16-53. 9. CVX Research, version 2.0 beta. http://cvxr.com/cvx.Figures