3379
White matter microstructural properties are related to inter-individual differences in cognitive instability after sleep deprivation1xidian, xi'an, People's Republic of China, 2xijing hospital, xi'an, People's Republic of China
Synopsis
ract-based spatial statistical analyses was used to investigate whether the individual differences in cognitive instability after SD was related to differences in WM structure. Resistant group exhibited significantly higher FA than vulnerable group, significant negative correlations were found between numbers of psychomotor vigilance task(PVT)lapses and FA in multiple regions. Our results also showed that 63% of individual variability in PVT lapse may be explained by variations in FA within superior longitudinal fasciculus and splenium of the corpus callosum. These findings suggested that cognitive instability after SD is closely associated with individual differences in WM integrity.
INTRODUCTION
Rather than eliminating the capability to perform, the effect of sleep deprivation (SD) on cognition is characterized by destabilizing performance. One of the leading paradigms used to assay cognitive instability in SD is the psychomotor vigilance task (PVT) (1). Lapses of the PVT have been considered to be the gold standard of cognitive instability (2). However, PVT lapses induced by SD exhibit substantial differences between subjects that range from apparent cognitive resistance to severe cognitive impairment(3,4). Importantly, the inter-individual differences in PVT lapses after SD had been shown to be trait-like which were stable over repeated exposures to SD, regardless of recent sleep history(5). Suggested by current neurobiological evidence, PVT lapses emerged when the efficiency of neural signal transmission became compromised across multiple brain regions(6). Efficient communication in the human brain relies on the integrity of white mater tracts(7). As a consequence, the present study investigated whether the inter-individual differences in PVT lapses could be influenced by the difference in WM structures.METHODS
Twenty-four subjects participated the rested wakefulness (RW) session and sleep deprivation (SD) session which were randomized in a cross-over fashion. Diffusion data were acquired with a 3-Tesla MRI system (EXCITE, General Electric, Milwaukee, Wisconsin) at the Department of Radiology of Xijing Hospital, Fourth Military Medical University, Xi’an, China. Participants were median-split into resistant and vulnerable groups according to the mean number of lapses in the final three hours of SD. Tract-based spatial statistics (TBSS) were adopted to examine the between-group differences in DTI measures including fractional anisotropy (FA), mean diffusivity (MD), axial diffusivity (AD) and radial diffusivity (RD)(8). Moreover, the relationships between the DTI measures and the number of lapse were also investigated as a group (all subjects). Finally, a hierarchical multiple regression was performed to investigate the contribution of DTI measures of significant brain regions in predicting the number of lapse.RESULTS
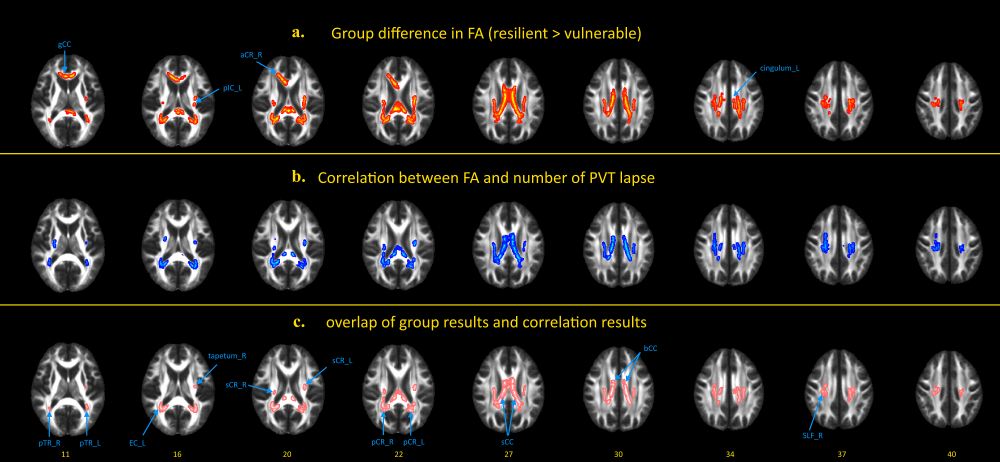
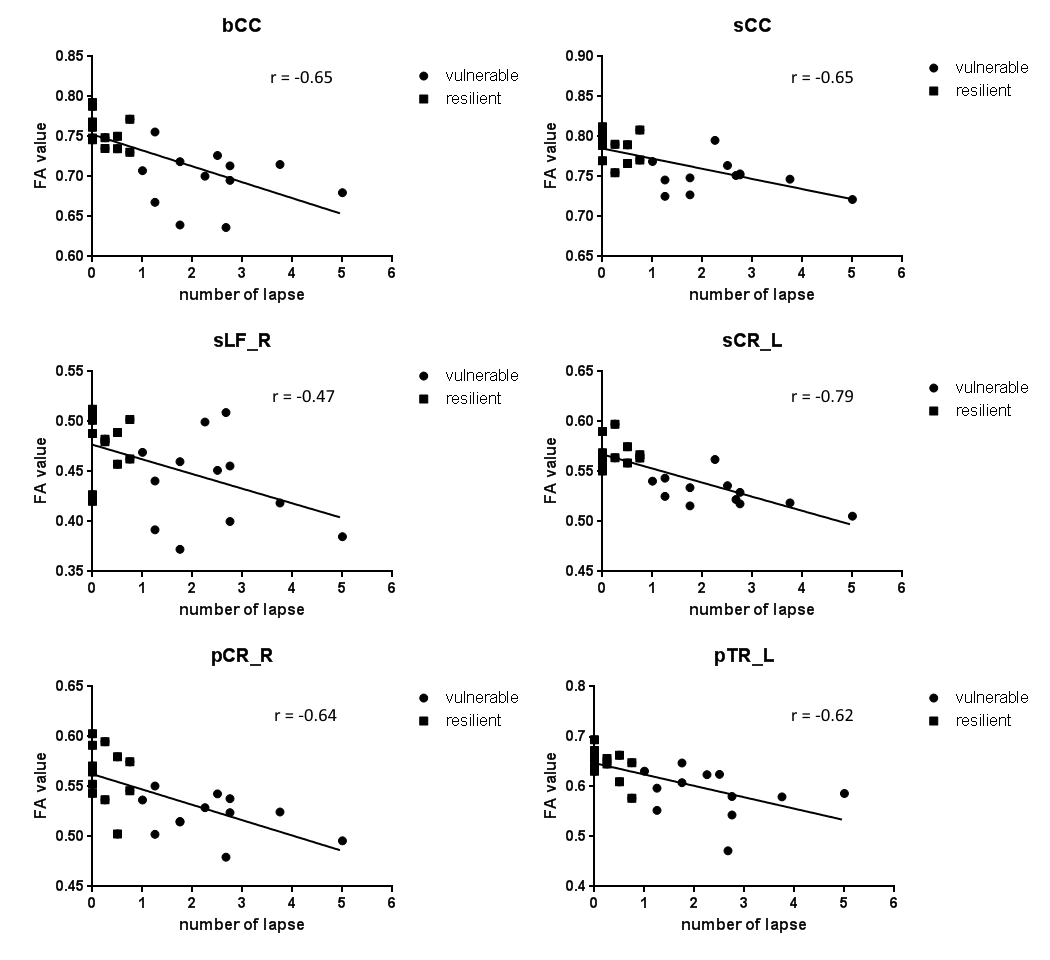
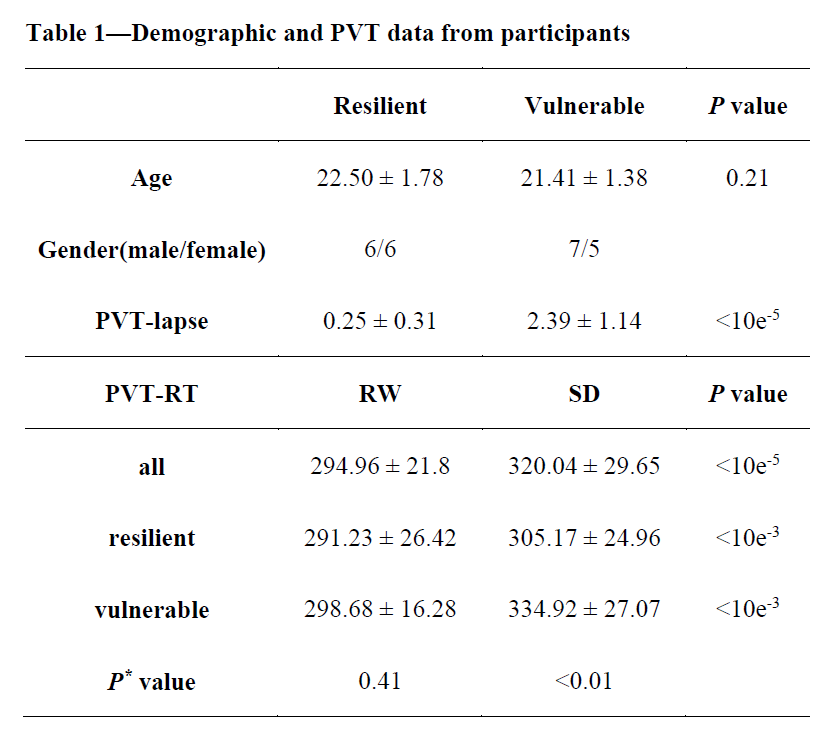
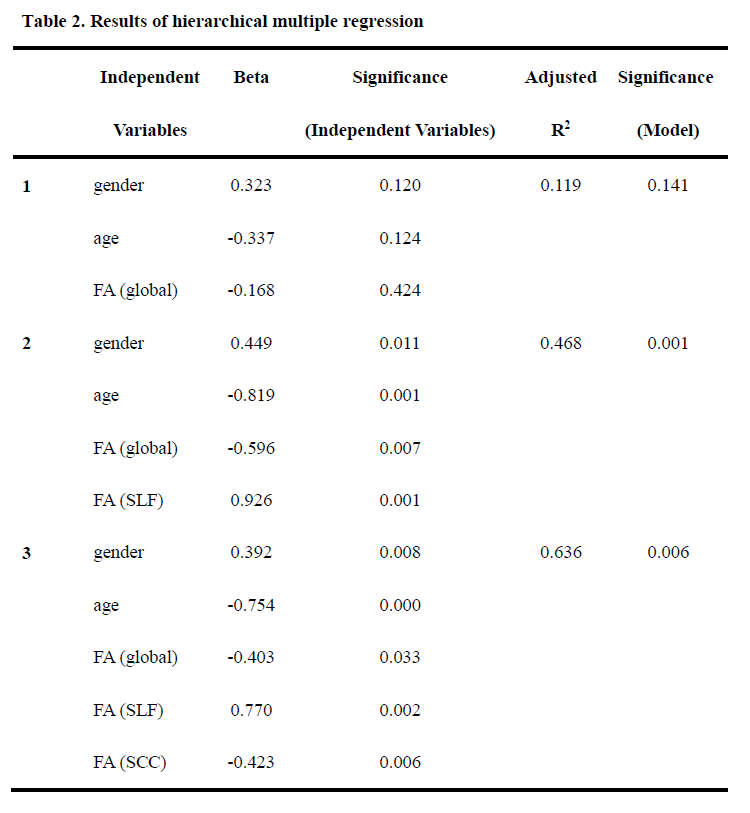
The PVT performances are summarized in Table 1. The mean number of lapses in the resistant group was 0.25, and this value was 2.39 in the vulnerable group. Compared with the vulnerable group, the resistant group exhibited significantly increased FA in multiple brain regions (P < 0.05, corrected, Figure 1a). At the group level, significant negative relationships between the number of lapses and FA values were found in multiple regions, which indicated that lower FA values were associated with higher numbers of PVT lapses (P < 0.05, corrected, Figure. 1b). The between-group results and correlation results showed large overlap (Figure. 1c). Figure 2 illustrates the relationships between the FA values in these WM tracts and the number of lapses. Finally, hierarchical regression analyses indicated that 63% of individual variability in PVT lapse may be explained by variations in FA within superior longitudinal fasciculus and splenium of the corpus callosum (Table 2).DISCUSSION
We found that differential vulnerability in PVT lapses after SD was associated with FA values in widespread WM tracts including corpus callosum that connects the hemispheres, corticothalamic/thalamocortical fibers that connect the cerebral cortex with the thalamus and fiber bundles that connect fronto-parietal regions. Using hierarchical multiple regression, we found two most representative fiber tracts that can predict lapses of PVT after SD, our findings strongly strengthen the fact that cognitive instability after SD is closely associated with individual differences in WM integrity.Acknowledgements
This study was financially supported by National Basic Research Program of China under Grant Nos. 2015CB856403 and 2014CB543203, the National Natural Science Foundation of China under Grant Nos. 81271644, 81471811, 81471738, 61401346, 81271534 and 81160452, and the Fundamental Research Funds for the Central Universities. We would like to thank Zeyang Li, lin liu and Ting Zhou for assistance with data collection.References
1. Doran S, Van Dongen H, Dinges DF. Sustained attention performance during sleep deprivation: evidence of state instability. Archives italiennes de biologie 2001;139(3):253-267.
2. Yeo BT, Tandi J, Chee MW. Functional connectivity during rested wakefulness predicts vulnerability to sleep deprivation. NeuroImage 2015;111:147-158.
3. Van Dongen HP. Connecting the dots: from trait vulnerability during total sleep deprivation to individual differences in cumulative impairment during sustained sleep restriction. Sleep 2012;35(8):1031.
4. Kuna ST, Maislin G, Pack FM, Staley B, Hachadoorian R, Coccaro EF, Pack AI. Heritability of performance deficit accumulation during acute sleep deprivation in twins. Sleep 2012;35(9):1223-1233.
5. Van Dongen H, Baynard MD, Maislin G, Dinges DF. Systematic interindividual differences in neurobehavioral impairment from sleep loss: evidence of trait-like differential vulnerability. SLEEP-NEW YORK THEN WESTCHESTER- 2004;27(3):423-433.
6. Lim J, Dinges DF. Sleep deprivation and vigilant attention. Ann N Y Acad Sci 2008;1129(1):305-322.
7. Roberts RE, Anderson EJ, Husain M. White matter microstructure and cognitive function. The Neuroscientist 2013;19(1):8-15.
8. Smith SM, Jenkinson M, Johansen-Berg H, Rueckert D, Nichols TE, Mackay CE, Watkins KE, Ciccarelli O, Cader MZ, Matthews PM. Tract-based spatial statistics: voxelwise analysis of multi-subject diffusion data. Neuroimage 2006;31(4):1487-1505.
Figures