3378
Charatization of Peritumoral Regions of Cerebral Tumor with Neurite Orientation Dispersion and Density Imaging (NODDI)1Institute of Brain Science, National Yang-Ming University, Taipei, Taiwan, 2Department of Medical Research and Education, Taipei Veterans General Hospital, Taipei Veterans General Hospital, Taipei, Taiwan, 3Department of Radiology, Taipei Veterans General Hospital, Taipei, Taiwan
Synopsis
In this work, primary tumors of the central nervous system, including glioma and meningiomas, were studied with NODDDI. The parameters derived from NODDI was examined to differentiate peritumoral edema and characterize complex structural abnormalities using diffusion MRI (dMRI) of a clinical MRI scanners. As a result, a better understanding of this perplexity with the aid of modern imaging is clearly necessary to define the blurred tumor margins and confront the recurrences in long-term treatment.
Purpose
NODDI (Neurite Orientatiion Dispersion and Density Imaging)1 was proposed to probe microstructures of normal brain tissue, when several disease categories (e.g. multiple sclerosis, focal cortical dysplasia, etc.) showed features of parameter maps of NODDI. In this work, primary tumors of the central nervous system, including glioma and meningiomas, were studied with NODDDI. The parameters derived from NODDI was examined to differentiate peritumoral edema and characterize complex structural abnormalities using diffusion MRI (dMRI) of a clinical MRI scanners. Peritumoral edema contributes strongly to symptoms associated with brain tumors and has potential of tumors infiltrations causing the possibility of recurrent gliomas. As a result, a better understanding of this perplexity with the aid of modern imaging is clearly necessary to define the blurred tumor margins and confront the recurrences in long-term treatment2.Methods
Data: 12 subjects with glioma or meningioma were recruited for the studies using the 3T MRI (MR750, GE, Milwaukee, WI, USA) with an 8-channel head coil. Following the 2016 WHO classification of tumors of the CNS, all subjects can be separated into three groups by a clinical neuropathology diagnosis 3 as low-grade gliomas (LGG, 4 patients), high-grade gliomas (HGG, 5 patients with three anaplastic astrocytoma,1 glioblastoma and 1anaplastic oligoastrocytoma) and meningioma. DMRI data from 12 patients were acquired with a two-shell protocol and both NODDI and DTI parameters were estimated.
Image Acquisition: Images were acquired using the dual spin-echo echo planar image (EPI) sequence with following parameters: TR/TE = 11300/92.6ms and two shells of spherical 24 and 48 gradients directions at b-values of 700, and 2000s/mm2, respectively, with ten interleaved B0 (b-value=0). The acquisition protocol was based on the exemplification of accuracy of NODDI parameters1. Without interpolation, the images were reconstructed as 1.8mm isotropic resolution.
ROI segmentation and data analysis: Regions of interest (ROIs), including tumor, edema, cysts, necrosis, and normal-tissue-like area, were manually created on the region of hyperintensity on T2, T2-FLAIR (fluid attenuated inversion recovery) images and T1-Gadolinium contrast imaging of each person.(Figure A) Segmentation of white and gray matter tissue was estimated and coregister of different imagings with Statistical Parametric Mapping (SPM) [NITRC, UCL, UK]. Consequently, the ROIs of lesion compartments and white and gray matter were applied to estimated NODDI parameter maps to compute averaged parameters of intra-cellular volume fraction (FICV), isotropic volume fraction (FISO) and orientation dispersion index (ODI), derived from NODDI Matlab toolbox4. Preprocessing of dMRI includes ‘‘topup-eddy’’ correction, companied with de-scalping (“brain extraction tool”, FDT) [FMRIB Software Library, Oxford, UK]5. We used the TOPUP correction by adding five additional b 0 image with reversed phase encoding blips into the sequence. The conventional diffusion parameters using the diffusion tensor model (“dtifit”, FDT) were applied to create fractional anisotropy (FA).
Statistics: Statistical evaluations were performed by using IBM SPSS Statistics software (IL, USA). Two sample t-tests were employed to compare to pair-wised comparison between different areas with significant criteria of P value less than 0.05.
Results
In the group of HGG, LGG and meningiomas, average FICV in tumor, peritumoral edema, and normal-tissue-like area, average index in the graph.(Figure B, C) To characterize of different lesion compositions of gliomas and meningioma, FISO and FECV were significantly elevated with descended FICV compared to contralateral WM. In addition, two samples t test indicated several regional difference in LGG and HGG.(Figure D) To differentiate the peritumoral edema of high grade and low grade gliomas, it showed the peritumoral areas of HGG showed significant increase of FECV when FA significantly descended compared with peritumoral area of LGG.(Figure E)Conclusion
We defined contrast-enhancing lesions where the brain–blood barrier has been compromised on the T1-contrast images as tumor area, and hyperintensity of T2 weighted images by the rest of T1-contrast enhanced region were assumed as edema in HGG. Low FICV, companied with high FECV, presented in peritumoral edema of gliomas. The decreased FICV in tumor and edema, as compared with normal-tissue-like area, may reflect the area of invading tumor cells. When interpreting NODDI results in tumor, FICV can no longer be interpreted as “neuron density”, also not the “cellularity” of the tumor.This model was not directly built on tumor and some parameters were prefixed based on values in normal brain such as the intrinsic free diffusivity in FICV 6. All the ROIs of tumor or peritumoral edema in gliomas showed low FICV and high FECV, which was consistent with increased extracellular space of tumor modal7. Invading tumor cells along fiber tracts and extracellular matrix was assumed to be categorized as FECV in the edema of high gliomas as expected8. (Figure D)Acknowledgements
No acknowledgement found.References
[1] Zhang H. et al, NODDI: practical in vivo neurite orientation dispersion and density imaging of the human brain. Neuroimage. NeuroImage 2012;61:1000-1012
[2]Stummer, W., Mechanisms of tumor-related brain edema. Neurosurg Focus. 2007 May 15;22(5):E8.
[3] Louis, DN. et al, The 2016 World Health Organization Classification of Tumors of the Central Nervous System: a summary. Acta Neuropathol.2016 Jun;131(6):803-20
[4]http://www.nitrc.org/projects/noddi_toolbox/
[5] http://www.fmrib.ox.ac.uk/fsl
[6] Wen Q et al, Clinically feasible NODDI characterization of glioma using multiband EPI at 7 T. Neuroimage Clin. 2015 Sep 3;9:291-9
[7]Zhang H. et al, Microfiberoptic measurement of extracellular space volume in brain and tumor slices based on fluorescent dye partitioning. Biophys J. 2010 Aug 9;99(4):1284-91
[8]Engelhorn T. et al, Cellular characterization of the peritumoral edema zone in malignant brain tumors. Cancer Sci. 2009 Oct;100(10):1856-62
Figures
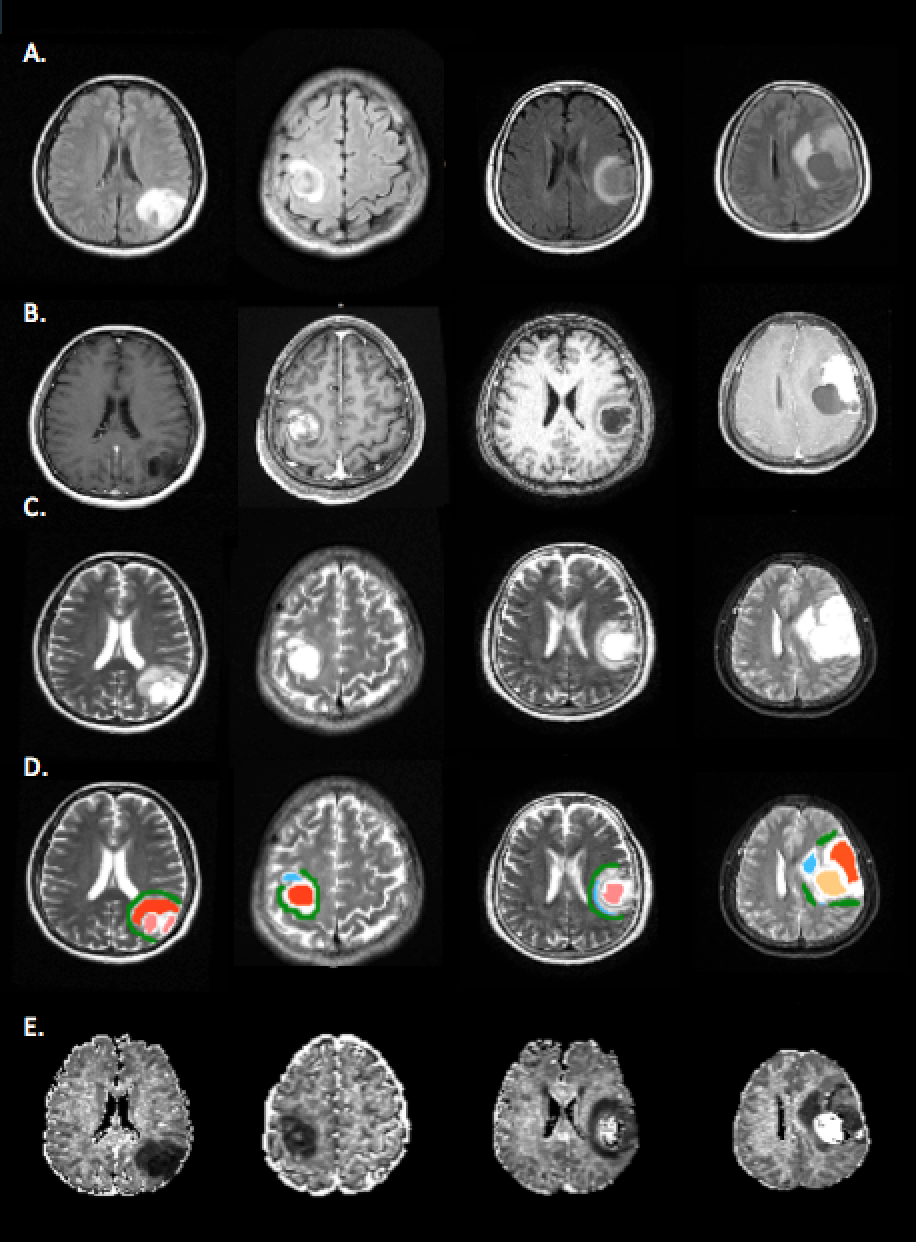
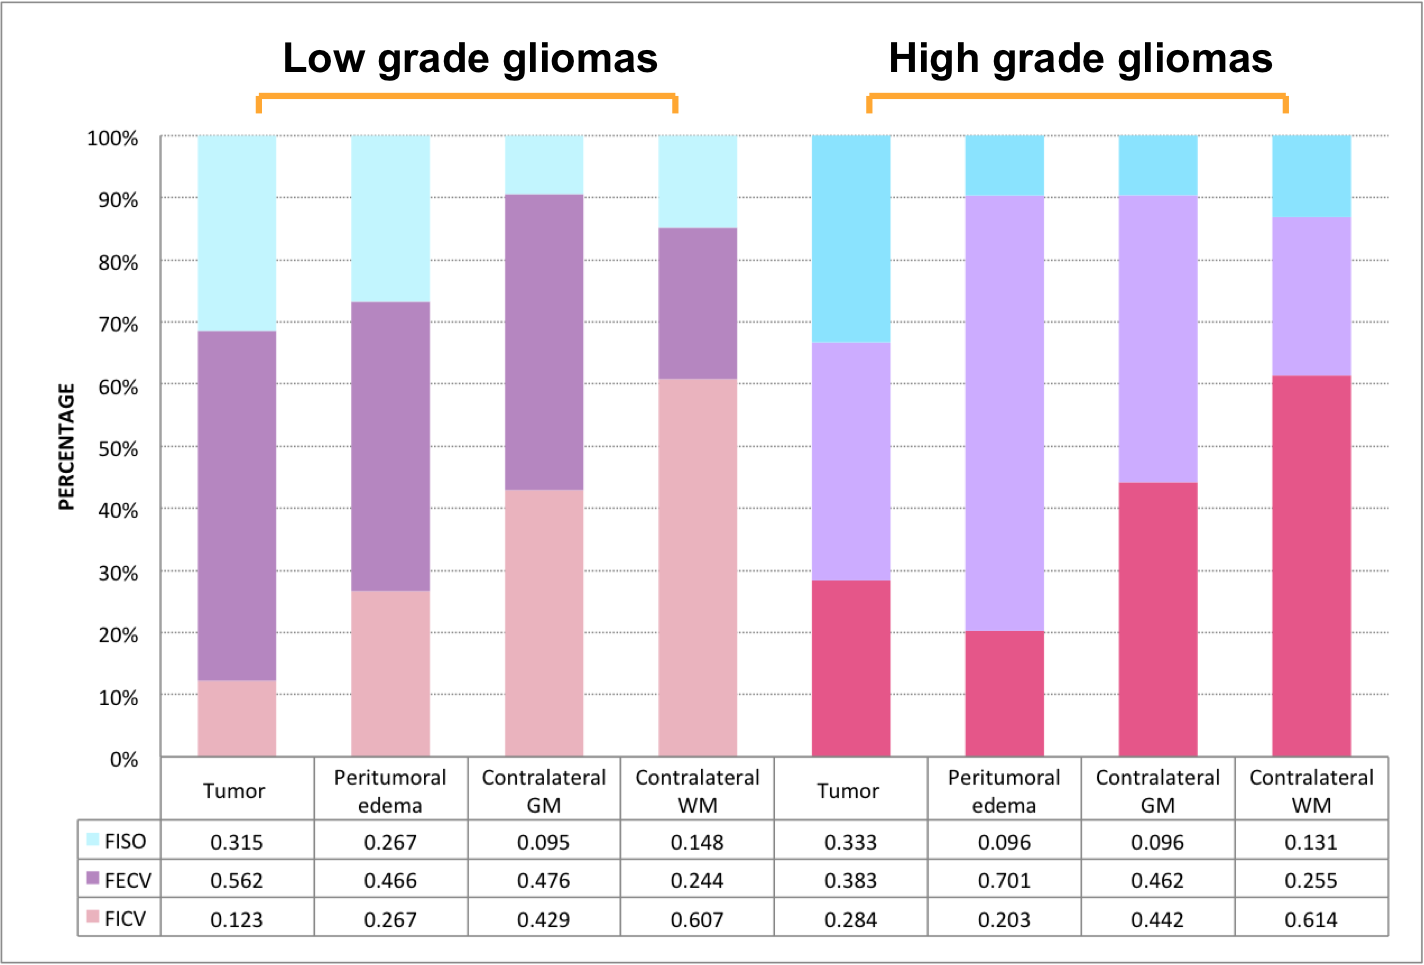
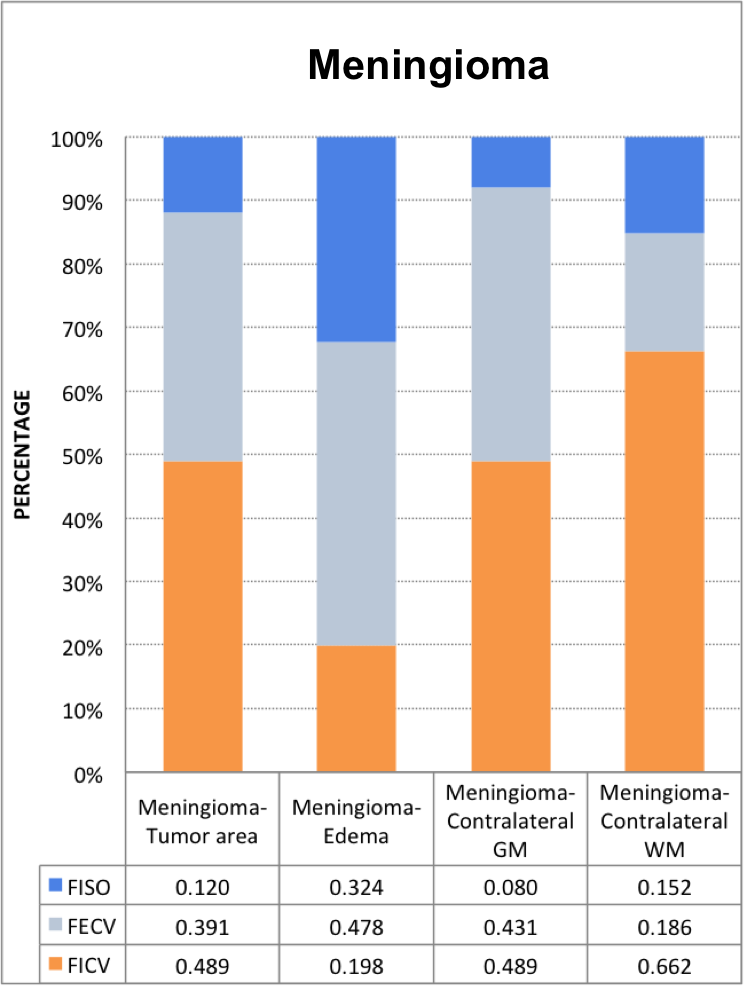
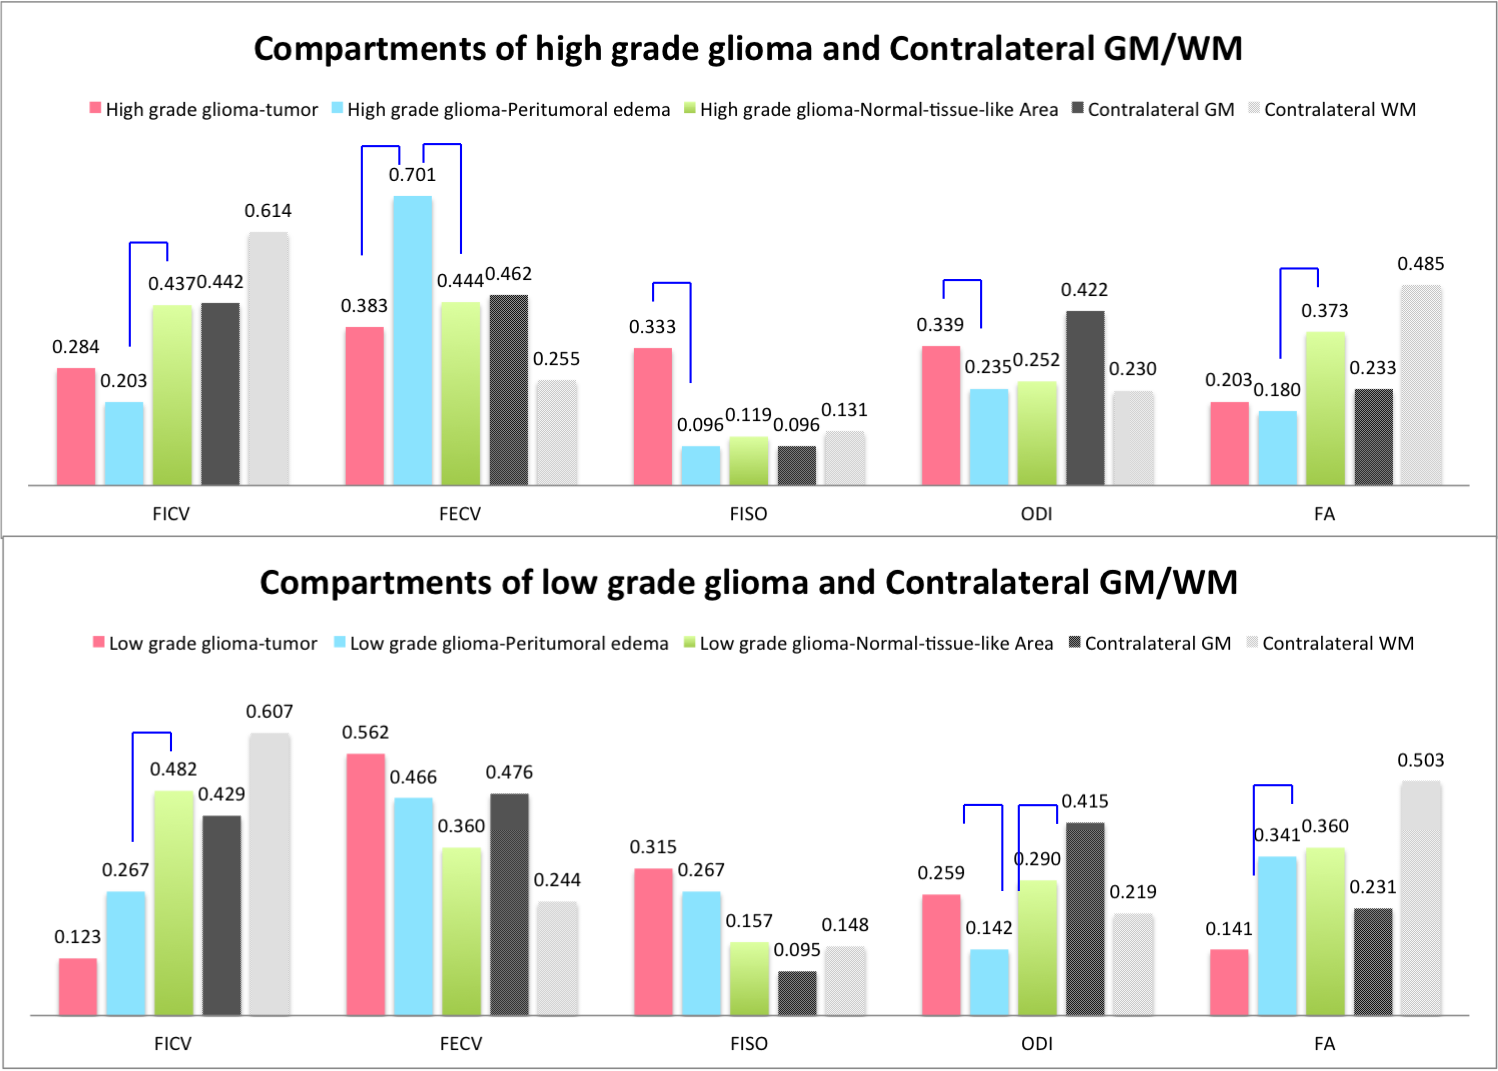
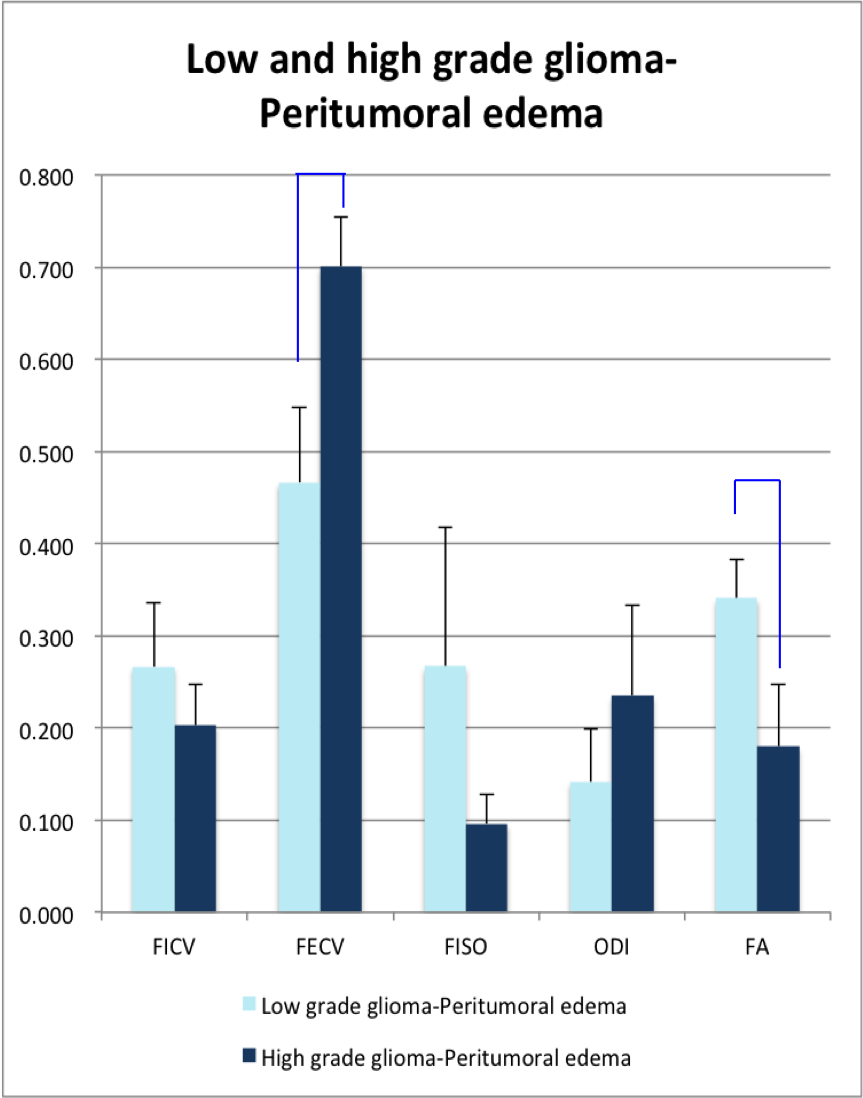
Figure E. The mean and standard deviation (error bars) of FICV, FECV, FISO, ODI and FA in peritumoral edema of low and high grade gliomas.
Compared with high grade and low grade gliomas, blue bars indicates significant difference by two sample t test.