3372
Impact of denoising in diffusion-weighted data on spherical deconvolution modelling1Dept. of Neuroimaging, King's College London, London, United Kingdom, 2Dept. of Forensic and Neurodevelopmental Science, King's College London, London, United Kingdom
Synopsis
A well-known dilemma in DW-MRI acquisitions is to determine the extent to which signal-to-noise ratio (SNR) can be can be sacrificed in favour of higher spatial resolution on one hand, and in favour of shorter acquisition time on the other. In this study we quantify the reproducibility of spherical deconvolution results at 3 spatial resolutions with and without denoising, as it is still unclear how denoising methods6 affect the uncertainty in subsequent diffusion model fitting and whether it introduces or improves bias in modelled fibre direction.
PURPOSE
A well-known dilemma in diffusion-weighted magnetic resonance imaging (DW-MRI) acquisitions is to determine the extent to which signal-to-noise ratio (SNR) can be can be sacrificed in favour of higher spatial resolution on one hand, and in favour of shorter acquisition time on the other. Accelerated acquisition methods have been introduced to reduce imaging time at a small expense of SNR and various denoising methods in the pre-processing stage have been also recently suggested. While several studies have evaluated the effects on signal-to-noise ratio (SNR) of multiband MRI acquisition for different MRI modalities1–3, fewer studies have focused on the resulting uncertainty of measures based on DW-MRI data4,5. In addition, assessing the uncertainty at different spatial resolutions has received very little attention. In this study we quantify the reproducibility of spherical deconvolution results at 3 spatial resolutions with and without denoising, as it is still unclear how denoising methods6 affect the uncertainty in subsequent diffusion model fitting and whether it introduces or improves bias in modelled fibre direction.METHODS
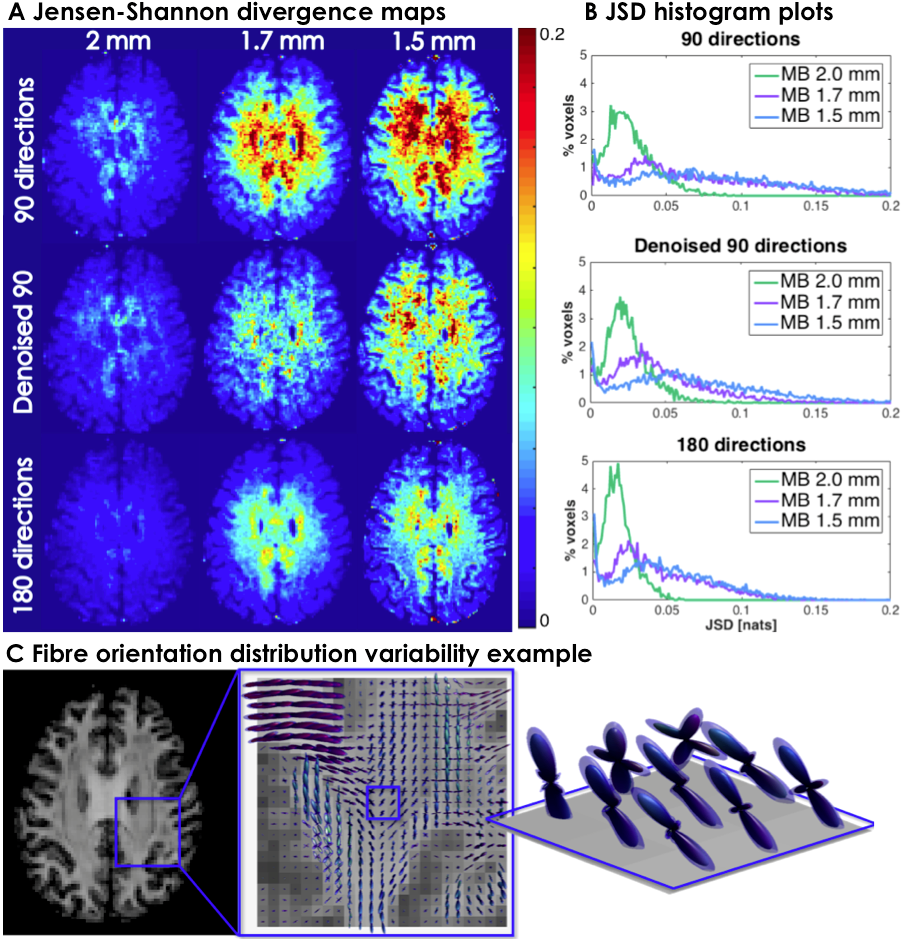
Two datasets were acquired with multi-band DW-MRI (MB=3) on a 3T MR750 GE scanner: dataset A contains 360(4x90) diffusion-weighted volumes and dataset B contains 180(2x90), acquired at an isotropic resolution of 2mm, TE=72.0ms and b=2000s/mm2. Dataset B was also acquired at 1.7mm and 1.5mm isotropic resolutions, with TE=73.9ms and TE=88.8ms, respectively. Data was pre-processed using eddy and topup (FSL software7), with and without MPPCA denoising6 performed prior to pre-processing. Residual bootstrap8 was used to obtain 600 synthetic signal realizations (500 considered the lower limit for robust uncertainty estimation9). Fibre orientation distribution (FOD) was estimated based on damped Richardson-Lucy spherical deconvolution model10. Generalized Jensen-Shannon divergence (JSD)11 was calculated on 600 bootstrap FODs as a measure of FOD shape reproducibility. Angular confidence interval of the 1st and 2nd highest peak direction in each voxel was calculated for CI maps. The angular bias maps were obtained by finding the angular difference between the highest peak of FOD estimated on 360 DW volumes compared to 90 directions and denoised 90 directions.RESULTS & DISCUSSION
JSD in Figure 1 is an index of uncertainty of the overall FOD profile and it shows that higher spatial resolution noticeably affects uncertainty of FODs in the 90 directions dataset where higher JSD indicates lower reproducibility. JSD maps exhibit spatial patterns similar to well known SNR maps9 of accelerated acquisition sequences, since the variation in each FOD component is highly sensitive to noise, which is amplified towards the centre of the brain, i.e. further away from the receive coil. JSD maps show the reproducibility is efficiently recovered by denoising the 90 DW directions data (row 2) and is comparable to 180 DW volumes (row 3). This is confirmed by JSD histogram distribution plots (Figure 1), where the proportion of voxels in lower JSD ranges is higher in denoised data, with most evident effect of denoising in 1.7mm spatial resolution.
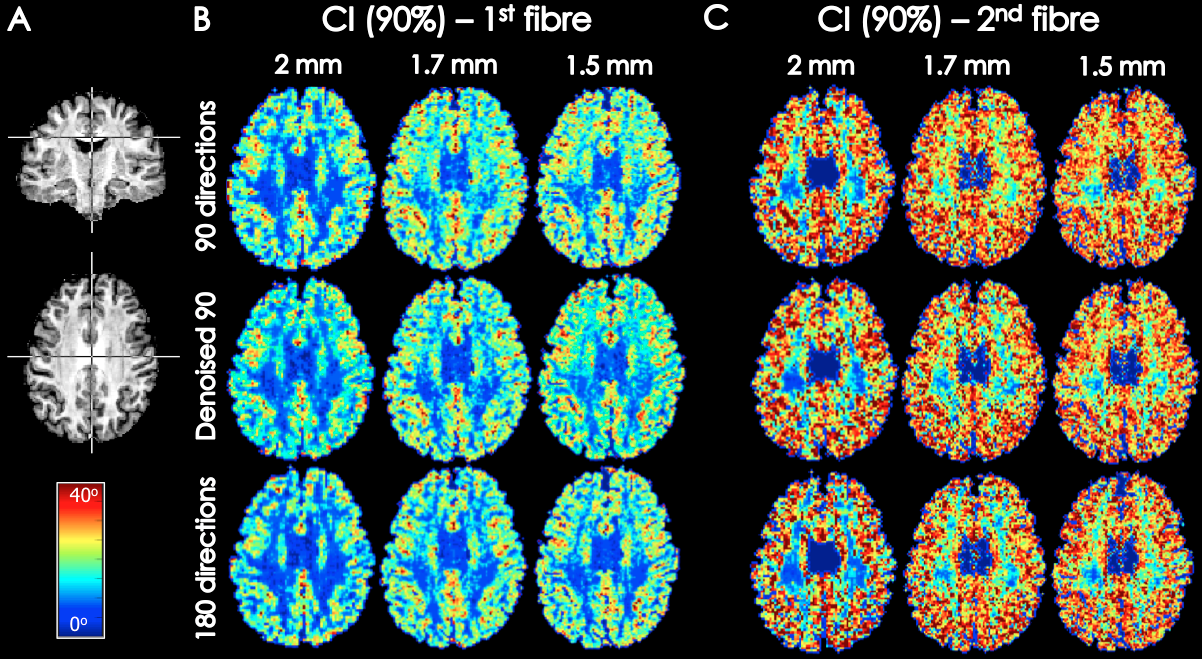
In Figure 2, CI maps show increased angular uncertainty with higher spatial resolution. This effect is more prominent for 90 directions compared to 180. Denoising 90 directions dataset results moderately improves angular confidence interval of the 1st and 2nd peak. Unlike JSD maps, CI maps appear to follow the pattern of white matter anisotropy suggesting the peak orientation angular error is affected by noise as well as anatomical complexity. This could explain why the effects of denoising are more prominent in reducing the shape uncertainty, and less obvious in peak direction angular uncertainty.
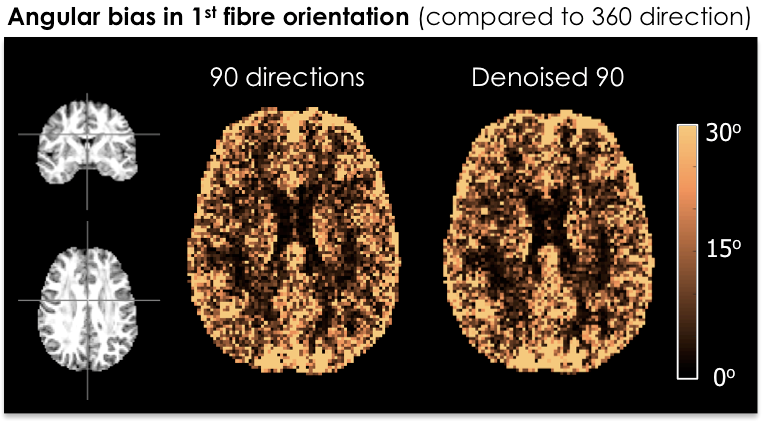
Both, JSD and CI, show the uncertainty of 90 DW-volumes dataset is brought closer to the 180-directions dataset by MPPCA denoising method. Finally Figure 3 shows the angular bias of 90 directions compared to reference dataset of 360 directions (i.e. more reliable) remains unchanged before and after denoising. Tying these results together suggests the uncertainty in diffusion model fitting is efficiently reduced with results comparable to doubling the number of data, without systematically affecting the angular bias.
CONCLUSION
This study investigates how increased resolution and denoising can affect uncertainty and modelled fibre direction, which is an important consideration in both deterministic and probabilistic tractography methods. The results suggest denoising does not introduce any additional bias in the angle of modelled fibre orientation. Given the reduced uncertainty results, if one wants to spend imaging time in favour of higher spatial resolution, denoising is an efficient solution and almost necessary.Acknowledgements
No acknowledgement found.References
1. Moeller, S. et al. Multiband multislice GE-EPI at 7 tesla, with 16-fold acceleration using partial parallel imaging with application to high spatial and temporal whole-brain fMRI. Magn. Reson. Med. 63, 1144–1153 (2010). 2. Xu, J. et al. Evaluation of slice accelerations using multiband echo planar imaging at 3T. Neuroimage 83, 991–1001 (2013). 3. Chen, L. et al. Evaluation of highly accelerated simultaneous multi-slice EPI for fMRI. NeuroImage 104, (2015). 4. Setsompop, K. et al. Improving diffusion MRI using simultaneous multi-slice echo planar imaging. Neuroimage 63, 569–580 (2012). 5. Sotiropoulos, S. N. et al. Advances in diffusion MRI acquisition and processing in the Human Connectome Project. Neuroimage 80, 125–143 (2013). 6. Veraart, J. et al. Denoising of diffusion MRI using random matrix theory. Neuroimage 142, 1–28 (2016). 7. Andersson, J. L. R. & Sotiropoulos, S. N. An integrated approach to correction for off-resonance effects and subject movement in diffusion MR imaging. Neuroimage 125, 1063–1078 (2015). 8. Jeurissen, B., Leemans, A., Jones, D. K., Tournier, J. D. & Sijbers, J. Probabilistic fiber tracking using the residual bootstrap with constrained spherical deconvolution. Hum. Brain Mapp. 32, 461–479 (2011). 9. Cohen-Adad, J., Descoteaux, M. & Wald, L. L. Quality Assessment of High Angular Resolution Diffusion Imaging Data Using Bootstrap on Q-Ball Reconstruction. J. Magn. Reson. Imaging 33, 1194–1208 (2011). 10. Dell’Acqua, F. et al. A modified damped Richardson-Lucy algorithm to reduce isotropic background effects in spherical deconvolution. Neuroimage 49, 1446–1458 (2010). 11. Lin, J. Divergence Measures Based on the Shannon Entropy. IEEE Trans. Inf. Theory 37, 145–151 (1991).Figures