3370
Shall we use denoising in the preprocessing of diffusion weighted imaging?1Department of psychological and brain sciences, Indiana University, Bloomington, IN, United States
Synopsis
Many denoising techniques have been proposed in an attempt to remedy the low signal-to-noise ratio (SNR) of diffusion weighted images (DWI) [1-3], especially with high b values. It was shown that denoising might benefit DWI data processing such as fiber tracking [4]. However, denoising is not widely accepted as a mandatory step in the preprocessing of DWI data due to little well documented study about the effect of denoising. In this work, we tested if denoising can overcome the low SNR in tensor based diffusion analysis and fiber tracking.
Introduction
Many denoising techniques have been proposed in an attempt to remedy the low signal-to-noise ratio (SNR) of diffusion weighted images (DWI) [1-3], especially with high b values. It was shown that denoising might benefit DWI data processing such as fiber tracking [4]. However, denoising is not widely accepted as a mandatory step in the preprocessing of DWI data due to little well documented study about the effect of denoising. In this work, we tested if denoising can overcome the low SNR in tensor based diffusion analysis and fiber tracking.Methods
The DWI data were acquired for one human subject on a 3 T Prisma scanner (Siemens Healthcare, Erlangen Germany) using the HCP Lifespan protocol with a 64-ch head coil (1.5 mm isotropic voxel size, 80 directions, b = 1000 and 2500 s/mm2, TR = 5000 ms, multiband acceleration factor = 4.). Three DWI datasets were acquired by changing the echo time (TE) to obtain images with different SNR. The TE was 85 ms, 120 ms, and 150 ms respectively. For tractograpy study, a phantom of 26 white matter bundles provided by Tractometer was used as ground truth. The diffusion MRI signal was simulated using Fiberfox tool implemented in the diffusion module of MITK (http://mitk.org) b = 1000 s/mm2, signal-to-noise ratio (SNR) of 22, 32, and 44. Each diffusion dataset contains 128 gradient directions and three b0 images. Denoising was performed with the Matlab toolbox using the LPCA option [4]. For human data, denoised and undenoised images were processed in FSL for eddy current correction and tensor fitting. The fiber tracking was performed using ExploreDTI [5] with the constrained spherical deconvolution (CSD) algorithm [6]. The cortical region of the brain was parcellated into 278 ROIs. Number of fibers between any pair of ROIs were computed to form a connectome matrix. The connectome was binarized and compared against the ground truth binarized connectome. The binarization entailed thresholding the connectome by removing connections if the number of fibers is smaller than a certain number. The false positive rate (FPR, ratio of spurious connections to the total number of true connections) and the false negative rate (FNR, ratio of missing connections to the total number of true connections) were computed respectively.Results
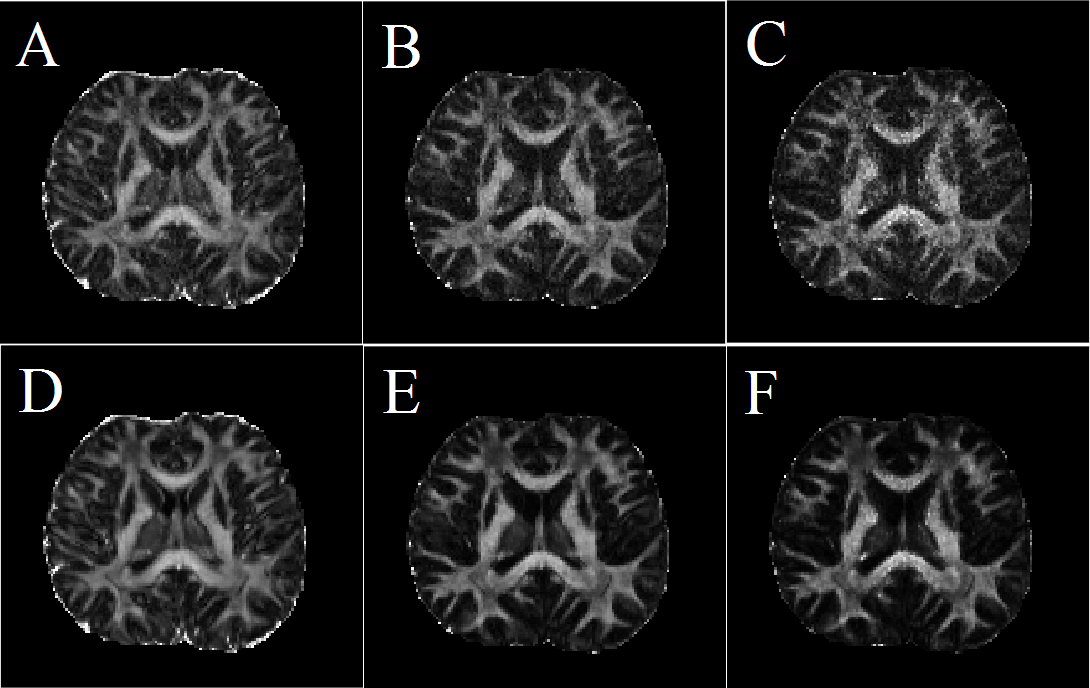
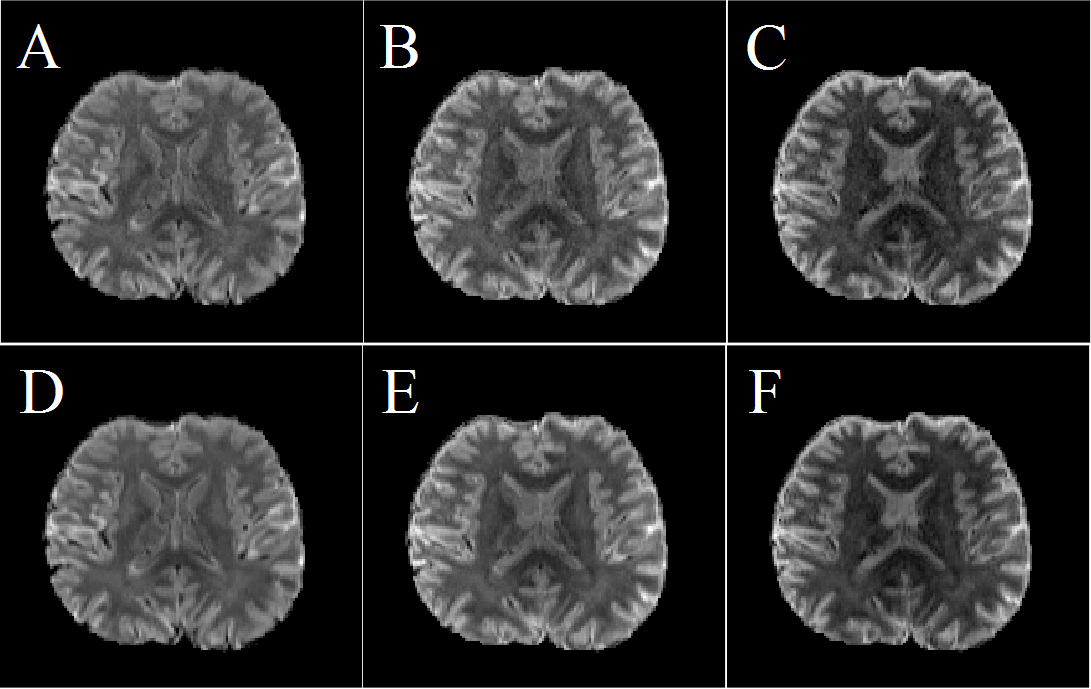
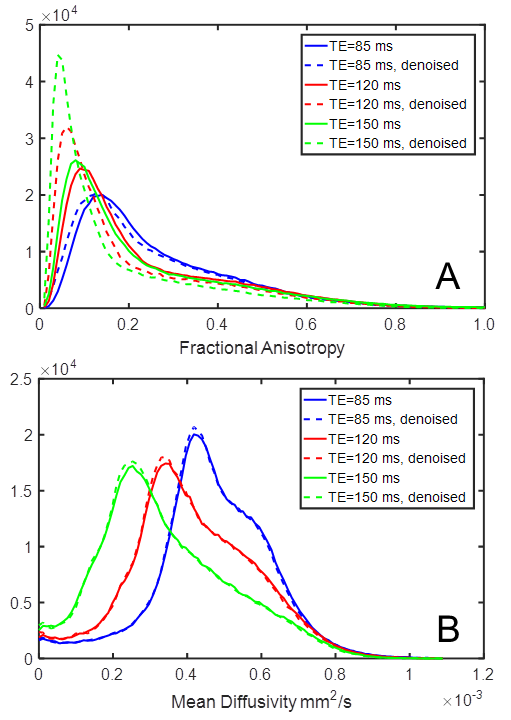
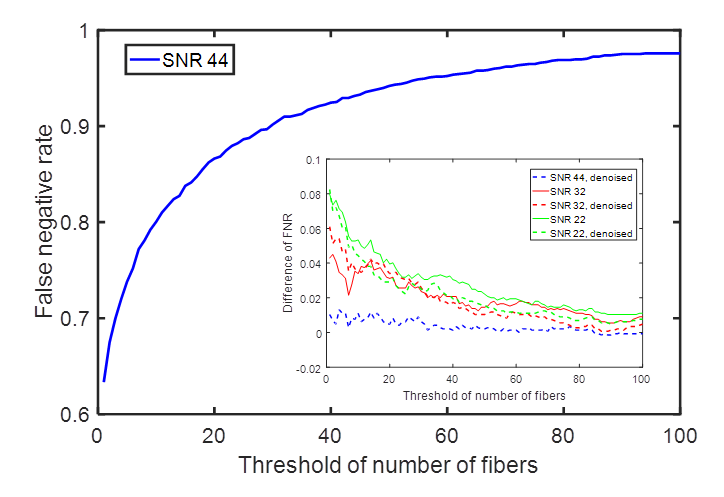
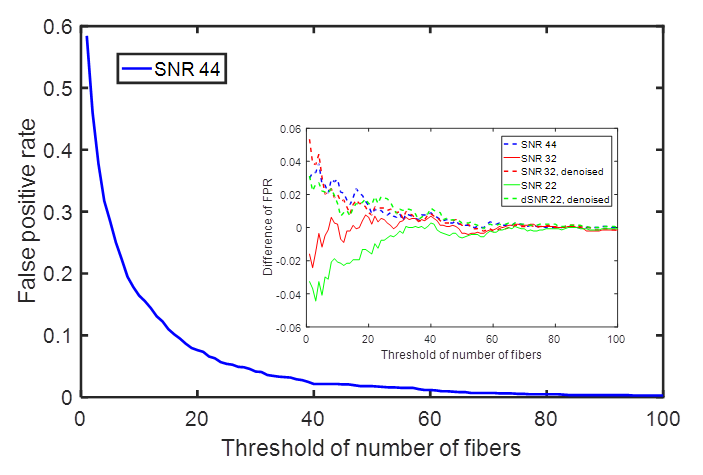
The FA maps of an exemplary slice are shown in Fig. 1 for three datasets with different SNR. The FA maps derived from the data with the same SNR look similar, despite that the denoised data yielded smoother maps. Distinctive difference can be noticed between TE 85 ms and higher TEs such as in the cortical region and the thalamus. The mean diffusivity maps of the same slice are shown in Fig. 2 for all conditions. Again, there is little difference between denoised and un-denoised data, but a dramatic difference between images with different TEs. These differences can be examined at a different angle with the histogram of the whole brain (Fig. 3). Fig 3A shows the histogram of FA for all conditions. The difference between denoised and un-denoised is smaller than the difference between TEs. The peaks shift to lower end as the SNR goes lower. If taking the lowest TE as the gold standard, denoising caused more bias in addition to the effect of SNR. For the MD map, the main difference is caused by SNR while the denoising has little effect. For tractography, the effect of denoising on the FNR is shown in Fig. 4. As expected, the FNR goes up as the threshold of number of fibers increases, and higher FNR is associated with lower SNR. Mixed effects of denoising on the FNR were found. For SNR = 44, denoising resulted in slightly higher FNR, but for SNR = 22, denoising achieved lower FNR than un-denoised data. The effect of denoising on the FNR is shown in Fig. 5, the FPR goes down as the threshold of number of fibers increases, and lower FPR is associated with lower SNR. It should be noted that here the denoising caused more FPR in all circumstances, indicating that denoising leads to more spurious fibers.Discussion
Our results with LPCA show that the primary benefit of denoising in tensor based diffusion analysis is improving SNR in the tensor parameters. In fiber tracking, denoising might help reducing the false negative rate at low SNR but at the expense of increasing the false positive rate. It is critical to acquire high SNR images in the first place. These findings are based on LPCA denoising but a systematic examination of other denoising methods will be conducted.Acknowledgements
We thank Center for Magnetic Resonance Research at University of Minnesota for the multi-band diffusion pulse sequence.References
1- Jones DK, et al. (2004) Squashing peanuts and smashing pumpkins: how noise distorts diffusion-weighted MR data. Magnetic Resonance in Medicine 52, 979–993.
2- Descoteaux M, et al. (2008) Impact of Rician adapted non-local means filtering on HARDI. MICCAI 2008; 11: 122–130.
3- McGraw, Tim, et al. "Variational denoising of diffusion weighted MRI." Inverse Problems and Imaging 35.4 (2009): 625.
4- J. V. Manjon, et al. Diffusion Weighted Image Denoising using overcomplete Local PCA. PLoS ONE 8(9): e73021. doi:10.1371/journal.pone.0073021
5- Leemans, A., et al. "ExploreDTI: a graphical toolbox for processing, analyzing, and visualizing diffusion MR data." 17th Annual Meeting of Intl Soc Mag Reson Med. Vol. 209. 2009.
6- Jeurissen, Ben, et al. "Probabilistic fiber tracking using the residual bootstrap with constrained spherical deconvolution." Human brain mapping32.3 (2011): 461-479.
Figures