3369
Exploring Local White Matter Geometric Structure in diffusion MRI Using Director Field Analysis1National Institutes of Health, Bethesda, MD, United States
Synopsis
In this abstract, inspired by microscopic theoretical treatment of phases in liquid crystals1, we introduce a novel mathematical framework, called Director Field Analysis (DFA), to study local geometric structural information of white matter. DFA extracts some meaningful scalar indices related with the degree of orientational alignment, dispersion, and orientational distortion, from the Orientation Distribution Function (ODF) field reconstructed by Diffusion Tensor Imaging (DTI) or High Angular Resolution Diffusion Imaging (HARDI).
Motivations
1) Orientational dispersion has been defined based on Watson distribution modeling of ODFs in NODDI2, which however cannot be applied for general ODFs.
2) Some previous works have focused on extracting local geometric information by considering spatial gradients of tensor field3,4. To our knowledge, there is currently no work making connections between general spherical function fields from HARDI data and local geometry of white matter.
Method
Orientational order and dispersion. For a general spherical function (e.g. an ODF) $$$f(\mathbf{u})$$$, $$$ \mathbf{u}\in\mathbb{S}^2$$$, we propose the orientational order index (OO) from the theory of liquid crystals3 to describe the degree of orientation or dispersion of $$$f(\mathbf{u})$$$ along a given axis $$$\mathbf{n}$$$:
$$\text{OO}(\mathbf{n}) = \int_{\mathbf{u}\in\mathbb{S}^2} P_2(\mathbf{u}^T\mathbf{n}) f(\mathbf{u}) d S = \int_{\mathbb{S}^2} \frac{3(\mathbf{u}^T \mathbf{n})^2 -1}{2} f(\mathbf{u}) d S$$
where $$$P_2$$$ is the second-order Legendre polynomial. Although $$$\text{OO}(\mathbf{n})$$$ is a spherical function, it is a scalar index when $$$\mathbf{n}$$$ is chosen as a physically meaningful axis, e.g., $$$f(\mathbf{u})$$$ takes its maximal value at $$$\mathbf{n}$$$. Let $$$\theta$$$ be the angle between $$$\mathbf{u}$$$ and $$$\mathbf{n}$$$, then $$$P_2(\mathbf{u}^T\mathbf{n})=\frac{3\cos^2\theta-1}{2}$$$. Thus if $$$f(\mathbf{u})$$$ is a Probability Density Function (PDF) in sphere, then OO is $$$\langle \frac{3\cos^2\theta -1}{2} \rangle \in [-0.5,1]$$$, where $$$\langle \cdot \rangle$$$ signifies the expectation operation. We define the orientational dispersion (OD), $$$\text{OD}=1-\text{OO}$$$. Then $$$\text{OD}\in [0,1.5]$$$.
Director and Local Orthogonal Frame. The orientations where an ODF takes its local peaks are normally considered as local fiber directions in a voxel. Considering the ODF is normally antipodal symmetric, the extracted peaks are equivalent to their negative orientations. We define a director as a vector which is equivalent with its negative. Thus, each peak is a director. We propose extracting a local orthogonal frame in each voxel with an anisotropic ODF from the detected peak field. The orthogonal frame has three orthogonal orientations. The first orientation is the principal direction where the ODF takes its global maximum. The other two orientations are in the orthogonal plane of the principal direction. After projecting all peaks in a local spatial neighborhood onto the orthogonal plane, we set the second orientation as the largest eigenvector of the covariance matrix of the projected peaks, and the third orientation as the cross product of the first two orientations.
Local Distortion Indices: Splay, Bend, and Twist. Based on the liquid crystal analogy, there are three types of distortions as demonstrated in Fig.1. 1) splay: bending occurs perpendicular to the director. 2) bend: the distortion is parallel to the director and molecular axis. 3) twist: neighboring directors are rotated with respect to one another, rather than aligned. With the local orthogonal frame $$$\{\mathbf{u}_1(\mathbf{x}),\mathbf{u}_2(\mathbf{x}),\mathbf{u}_3(\mathbf{x})\}$$$ at each voxel $$$\mathbf{x}$$$ obtained above, we propose three scalar indices to describe the three types of local distortions, and a total distortion index:
$$\begin{align} \text{Splay index:} \quad s &= \sqrt{ (\mathbf{u}_2^T\frac{\partial \mathbf{u}_1}{\partial \mathbf{u}_2} )^2 + (\mathbf{u}_3^T\frac{\partial \mathbf{u}_1}{\partial \mathbf{u}_3} )^2} \\ \text{Bend index:} \quad b &= \sqrt{ (\mathbf{u}_2^T\frac{\partial \mathbf{u}_1}{\partial \mathbf{u}_1} )^2 + (\mathbf{u}_3^T\frac{\partial \mathbf{u}_1}{\partial \mathbf{u}_1} )^2} \\ \text{Twist index:} \quad t &= \sqrt{ (\mathbf{u}_2^T\frac{\partial \mathbf{u}_1}{\partial \mathbf{u}_3} )^2 + (\mathbf{u}_3^T\frac{\partial \mathbf{u}_1}{\partial \mathbf{u}_2} )^2} \\ \text{Total distortion index:} \quad d &= \sqrt{s^2+b^2+t^2}\end{align}$$
where $$$\frac{\partial \mathbf{u}_1}{\partial \mathbf{u}_i}$$$, $$$i=1,2,3$$$, is the spatial directional derivative of director field $$$\mathbf{u}_1(\mathbf{x})$$$ along $$$\mathbf{u}_i$$$, i.e.,
$$\frac{\partial \mathbf{u}_1}{\partial \mathbf{u}_i}= \lim_{k\to 0} \frac{ \mathbf{u}_1(\mathbf{x}+ k \mathbf{u}_i) - \mathbf{u}_1(\mathbf{x}- k \mathbf{u}_i)}{ 2 k}$$
We first calculates three rotation matrices respectively along $$$x$$$, $$$y$$$, $$$z$$$ axes. Then $$$\frac{\partial \mathbf{u}_1}{\partial \mathbf{u}_i}$$$ is numerically approximated by $$$\mathbf{u}_1(\mathbf{x}+ \mathbf{u}_i) - \mathbf{u}_1(\mathbf{x}- \mathbf{u}_i)$$$, where $$$\mathbf{u}_1(\mathbf{x}+ \mathbf{u}_i)$$$ and $$$ \mathbf{u}_1(\mathbf{x}- \mathbf{u}_i)$$$ are approximated by the weighted mean of three rotated vectors along three axes.
Experiments
Fig. 2 demonstrated these distortion indices calculated from idealized tensor fields. It shows that 1) the four indices only depend on the orientations, not on the tensor or ODF shape; 2) splay, bend, twist indices provide complementary information about the orientational change, which demonstrate different types of orientational distortions.
We reconstruct fiber ODFs using NNSD5 from a single subject from Human Connectome Project ( 3 shells, 90 directions per shell, and $$$b=1000,2000,3000\,\text{s}/\text{mm}^2$$$). OO and OD were calculated from fODFs along their principal peaks. Fig. 3 demonstrated the fiber tracts cross a given ball ROI. The tracks were colored by using the proposed six scalar indices.
Conclusion
We proposed a unified framework called Director Field Analysis (DFA) to analyze a spherical function field and its extracted peaks. OO and OD are useful to describe the degree of alignment and dispersion of general spherical functions. The distortion indices demonstrated good sensitivity for the three different types of directional distortion in Fig.1, and have large values in areas with fiber curving and crossing.Acknowledgements
No acknowledgement found.References
1. Andrienko, D., 2006. Introduction to liquid crystals. IMPRS school, BadMarienberg
2. Zhang, H., Schneider, T., Wheeler-Kingshott, C.A., Alexander, D.C., 2012.NODDI: practical in vivo neurite orientation dispersion and density imag-ing of the human brain. Neuroimage 61, 1000–1016.
3. Savadjiev, P., Kindlmann, G., Bouix, S., Shenton, M., Westin, C.F., 2010.Local white matter geometry from diffusion tensor gradients. NeuroImage49(4), 3175–3186.
4. Pajevic, S., Aldroubi, A., Basser, P.J., 2002. A continuous tensor fieldapproximation of discrete dt-mri data for extracting microstructural andarchitectural features of tissue. Journal of magnetic resonance 154, 85–100.
5. Cheng, J., Deriche, R., Jiang, T., Shen, D., Yap, P.T., 2014. Non-NegativeSpherical Deconvolution (NNSD) for estimation of fiber Orientation Dis-tribution Function in single-/multi-shell diffusion MRI. NeuroImage 101,750–764.
Figures
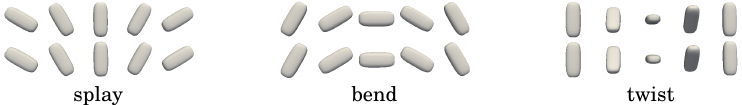
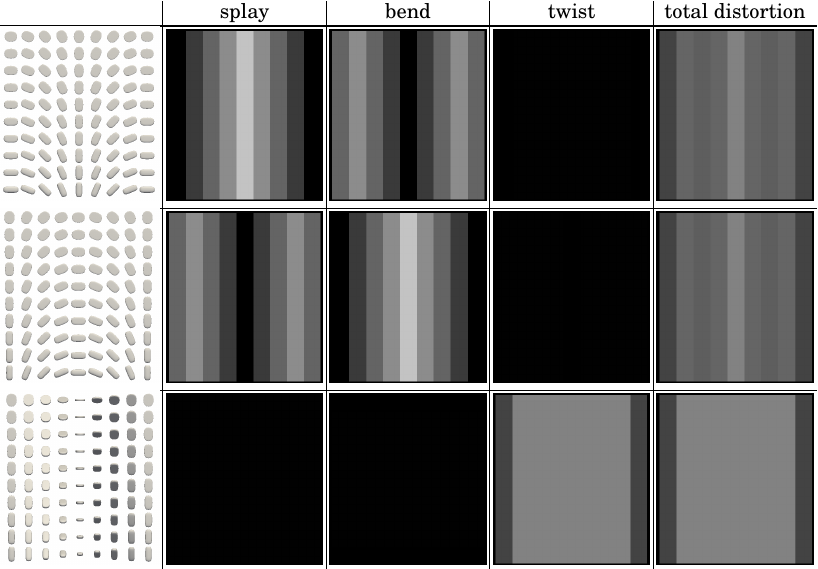
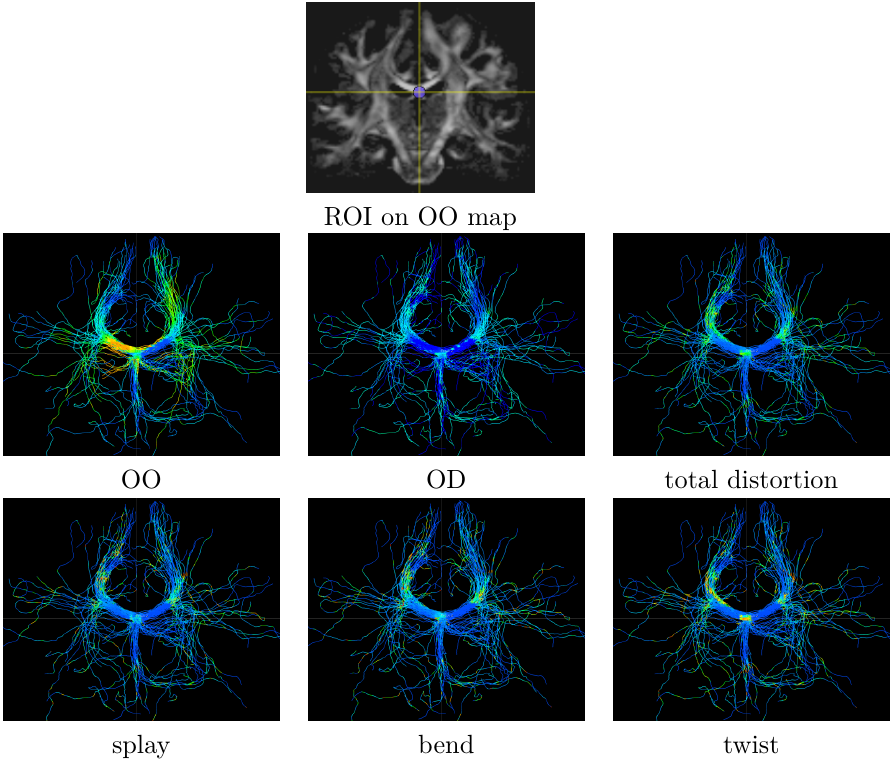
Figure 3. Fiber tracts cross a ROI colored by the six indices.The ROI is a crossing area of Corpus Callosum and Fornix, where all distortion indices have high values, especially for twist and total distortion indices.