3363
Revealing the nature of microstructural correlations along axons in human brain white matter with time-dependent diffusion1Center for Biomedical Imaging, New York University, New York, NY, United States
Synopsis
We explore axial diffusivity dependence on both diffusion time and gradient pulse width in major white matter tracts. This allows us to differentiate between two possible arrangements of restrictions (e.g. beads) along fibers: (1) short-range disorder, or (2) “hyperuniform” disorder (arrangement qualitatively closer to periodic). Unexpectedly, model prediction for hyperuniform disorder is more consistent with our data than for short-range disorder. If conformed histologically in human or animal studies, this would mean that restrictions along axons are not “purely” randomly distributed but rather spatially correlated − perhaps, for optimizing physiological constraints.
Introduction
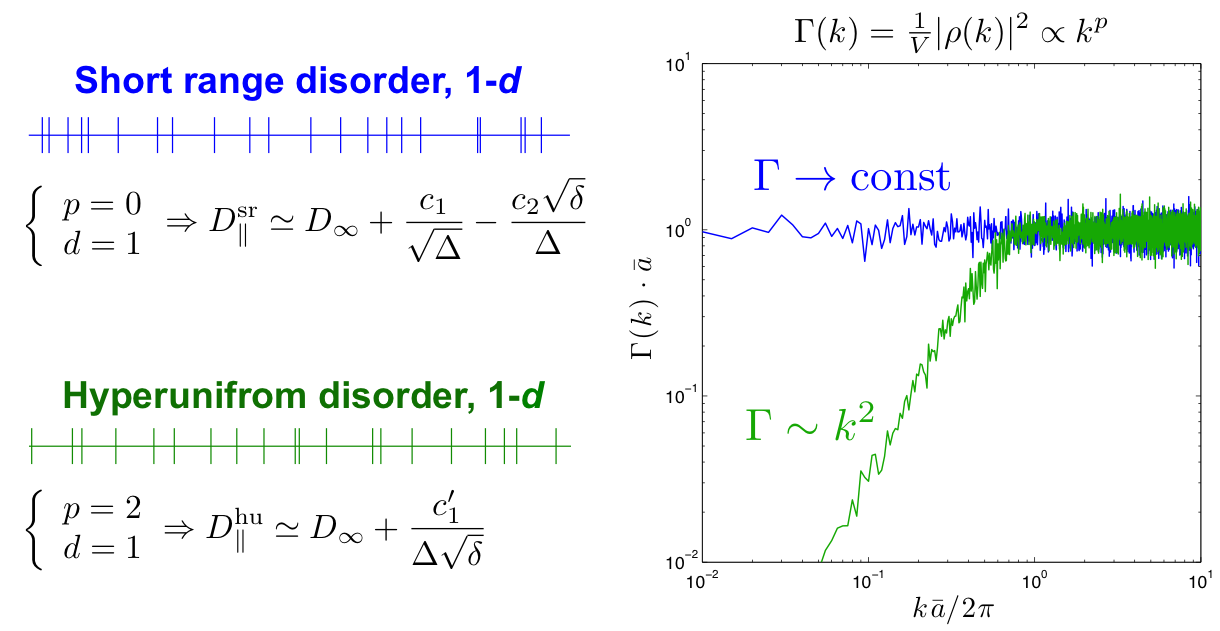
In brain white matter (WM), the diffusion coefficient $$$D_\parallel$$$ along axons exhibits significant dependence on diffusion time $$$\Delta$$$ and gradient pulse width $$$\delta$$$ [1,2]. This implies non-Gaussian diffusion at finite $$$\Delta$$$, e.g. due to beads or other restrictions along axons. Here we explore the dependence on both $$$\Delta$$$ and $$$\delta$$$ to differentiate between two possible disorder arrangements in the placement of restrictions, Fig. 1: (1) short-range disorder as in gray matter (GM) [3-5], or (2) “hyperuniform” disorder [3,6].Theory
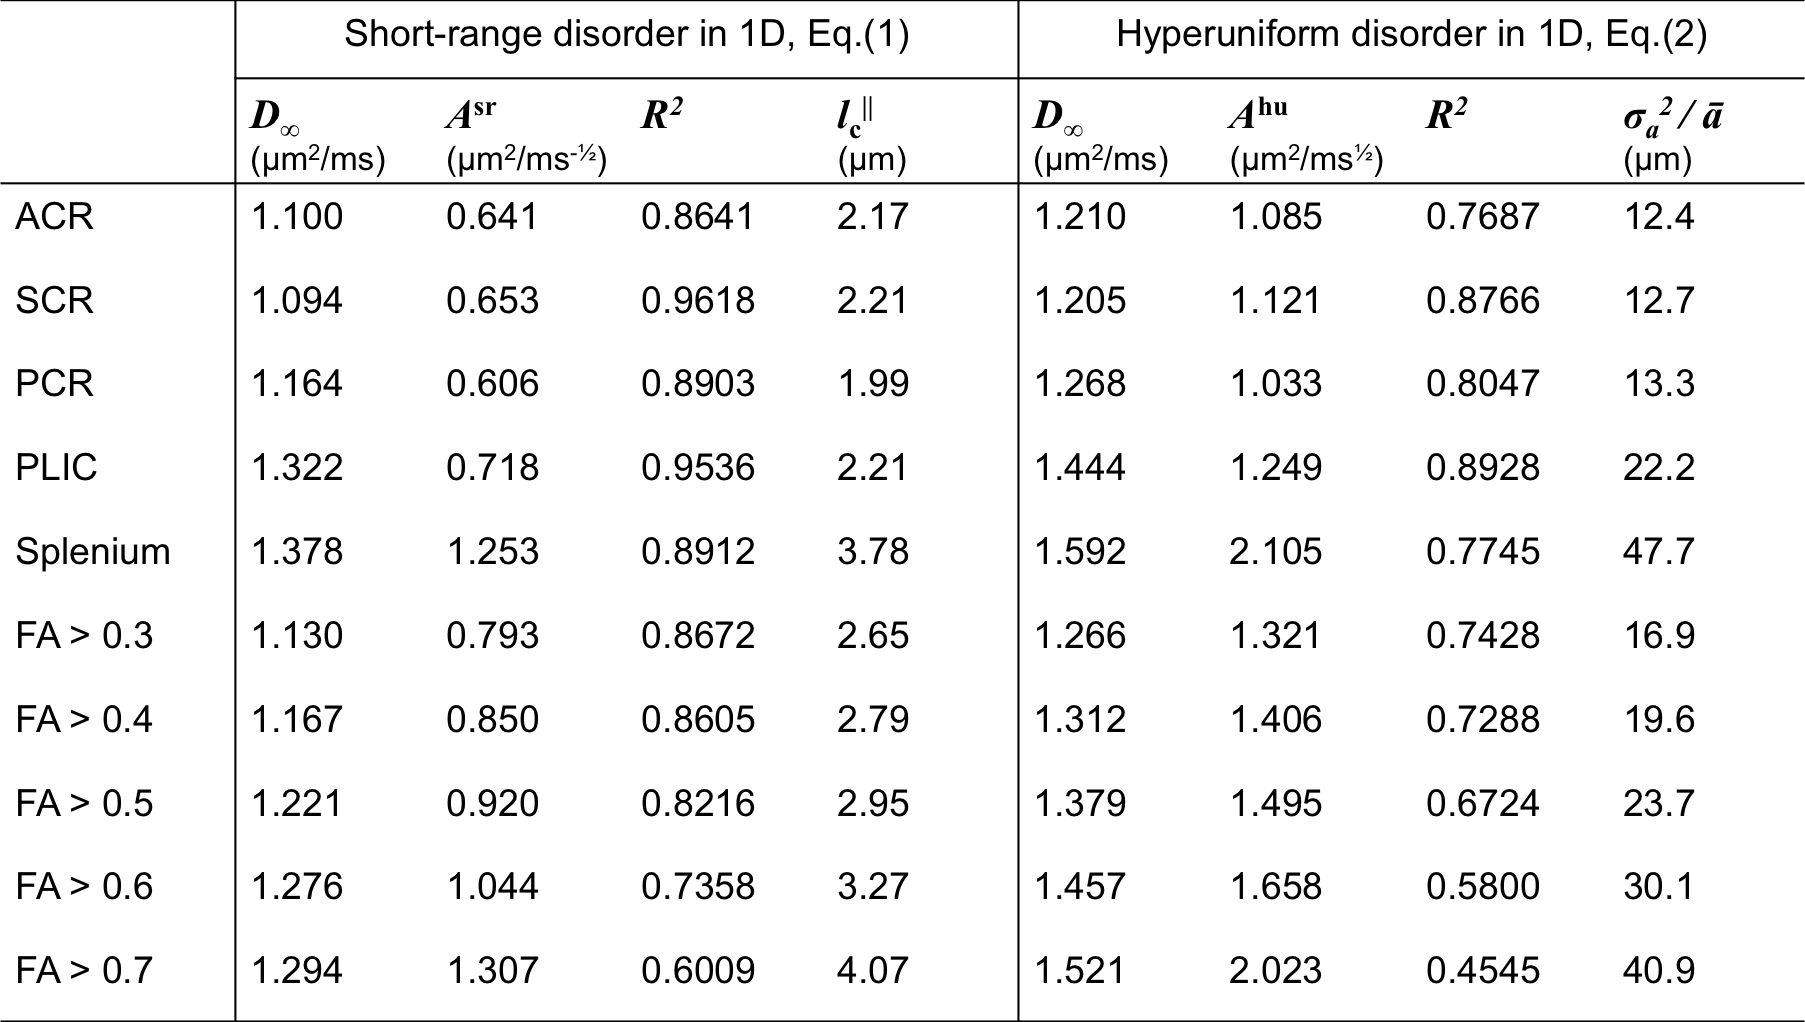
Short-range disorder is characterized by a finite correlation length $$$l_c$$$, beyond which the statistics of restrictions is Poissonian (uncorrelated) (Fig.1, blue). Irrespective of the microscopic nature of restrictions (e.g. beads), short-range disorder in their placement yields the following functional form for the transverse or axial diffusivity [2,3]: $$D_\parallel^{\rm sr}\simeq\,D_\infty+\frac{A^{\rm sr}}{\Delta-\delta/3}\cdot\left[2\sqrt{\Delta}-\frac{16}{15}\sqrt{\delta}\right],\quad(1)$$ where $$$D_\infty$$$ is the bulk diffusivity at $$$\Delta\to\infty$$$, and $$$A^{\rm sr}$$$ is the strength of restrictions ($$$\mu$$$m$$$^2$$$/ms$$$^{-1/2}$$$). When $$$\Delta\gg\delta$$$, $$$D_\parallel^{\rm sr}$$$ scales with ~$$$1/\sqrt{\Delta}$$$. The correlation length is estimated by $$$l_c^\parallel\simeq 2A^{\rm sr}\sqrt{\pi/D_\infty}$$$ [1].
The $$$\sim 1/\sqrt{\Delta}$$$ diffusivity scaling, observed in GM with OGSE [3,5], is consistent with short-range disorder in the histological observations [4] of varicosities along neurites in gray matter. In contrast, the varicosity distribution along axons in WM tracts has not been characterized.
Hyperuniform disorder [3,6] implies a much more, though not perfectly, ordered arrangement (Fig.1, green). An example is a “shuffled lattice”, i.e. individual restrictions displaced from their ideal periodic positions by independent random shifts drawn from a distribution with finite variance $$$\sigma_a^2$$$. While local snapshots of disordered configurations look deceptively similar to short-range disorder (Fig.1), the functional form of the axial diffusivity is markedly different [2,3]: $$D_\parallel^{\rm hu}\simeq\,D_\infty+\frac{A^{\rm hu}}{\Delta-\delta/3}\cdot\left[\frac{16}{3}\cdot\frac{1}{\sqrt{\delta}}\right],\quad\quad\,\,\,(2)$$ where $$$A^{\rm hu}$$$ is the strength of restrictions ($$$\mu$$$m$$$^2\cdot$$$ms$$$^{1/2}$$$). When $$$\Delta\gg\delta$$$, $$$D_\parallel^{\rm hu}$$$ scales as $$$\sim 1/(\Delta\sqrt{\delta})$$$, which is qualitatively different from $$$D_\parallel^{\rm sr}$$$ in Eq.(1). In this case, the relevant length scale is the variance-to-mean-spacing ratio $$$\sigma_a^2/\bar{a}= 4\sqrt{\pi}\cdot A^{\rm hu}\cdot D_\infty^{5/2}$$$ [3].
Materials and Methods
Diffusion measurements were performed on five healthy subjects (1 males/ 4 females, 24-44 y/o) using a 3T Siemens Prisma scanner with a 64-channel head coil. We scanned each volunteer twice for about 40 min in total using monopolar pulsed gradient spin echo sequences for different combinations of ($$$\Delta,\delta$$$). Other parameters were three $$$b$$$=0 images and $$$b$$$=500 s/mm$$$^2$$$ images along 30 diffusion gradient directions,TE/TR=150/5000 ms, voxel size of (2.7 mm)$$$^3$$$, and FOV=(221 mm)$$$^2$$$.
In scan 1, we varied $$$\delta$$$=4.7-49 ms and fixed $$$\Delta$$$=55 ms; in scan 2, we fixed $$$\delta$$$=15 ms and varied $$$\Delta$$$=21-100 ms. A series of WM regions-of-interest (ROIs) were created by thresholding the fractional anisotropy (FA) map at 0.3-0.7 (FA thresholded ROI); another series were created based on the JHU DTI WM atlases [7] (anatomical WM ROI). The axial diffusivity $$$D_\parallel$$$ was averaged over each ROI.
Results
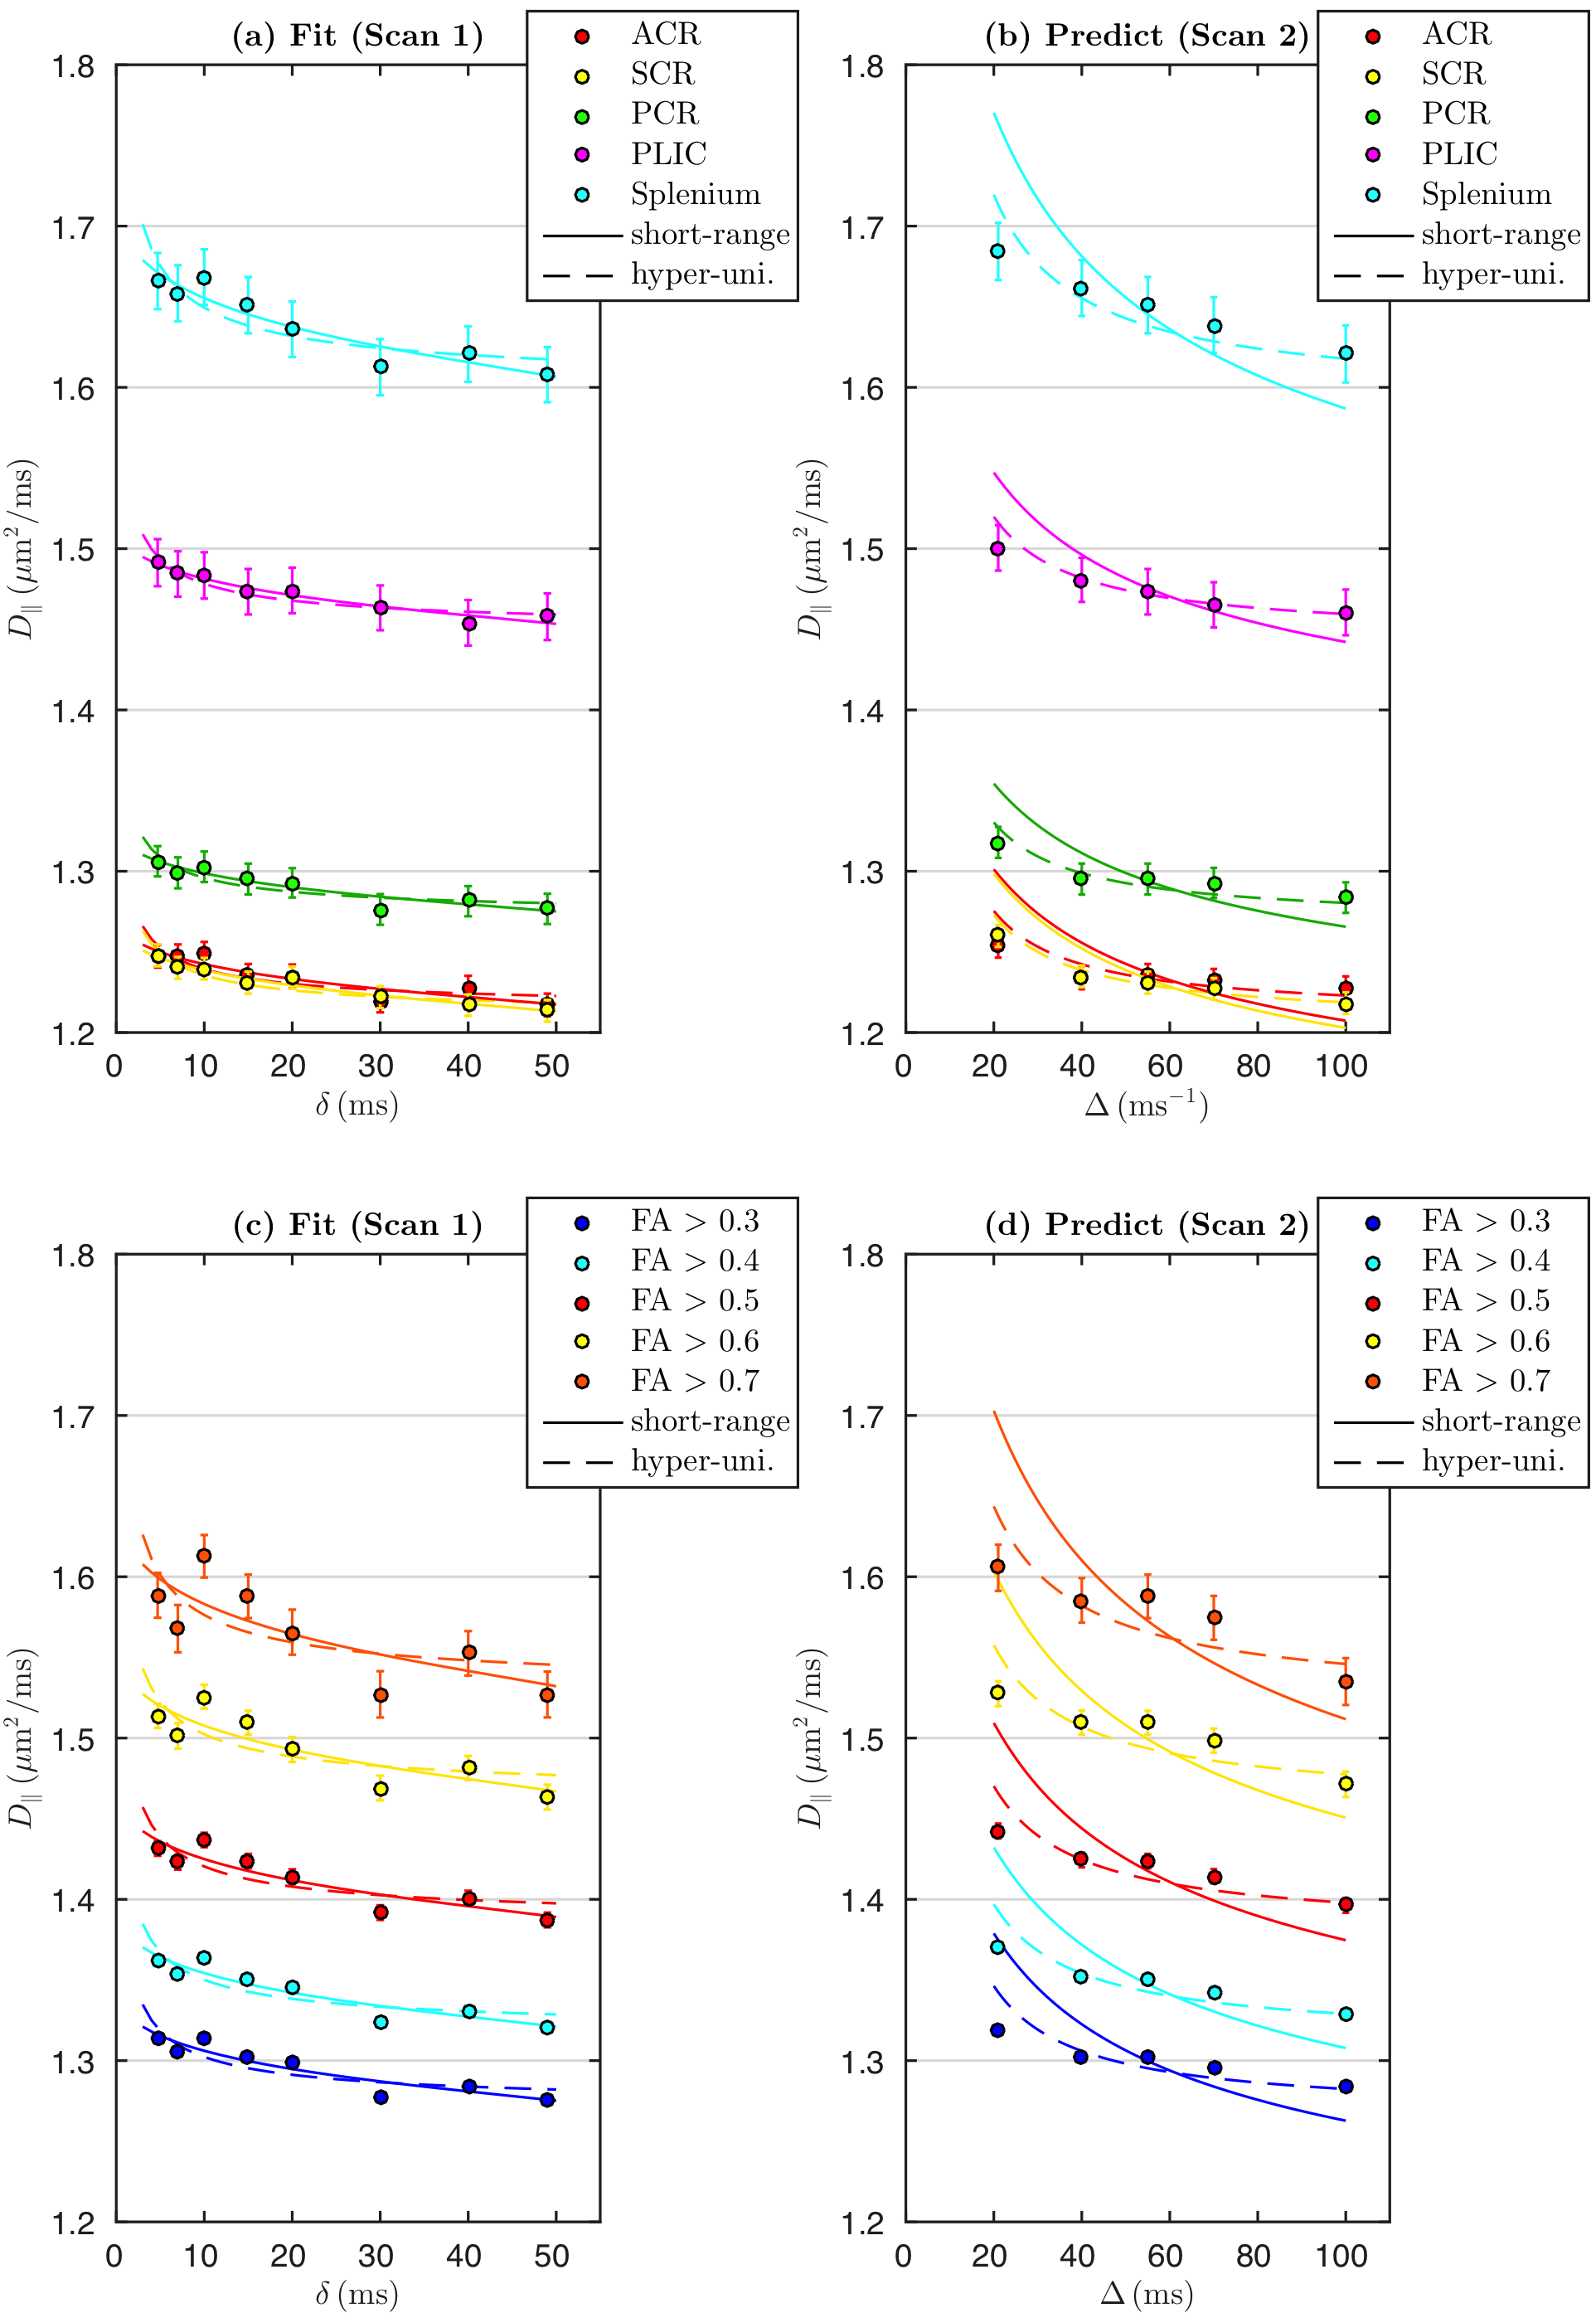
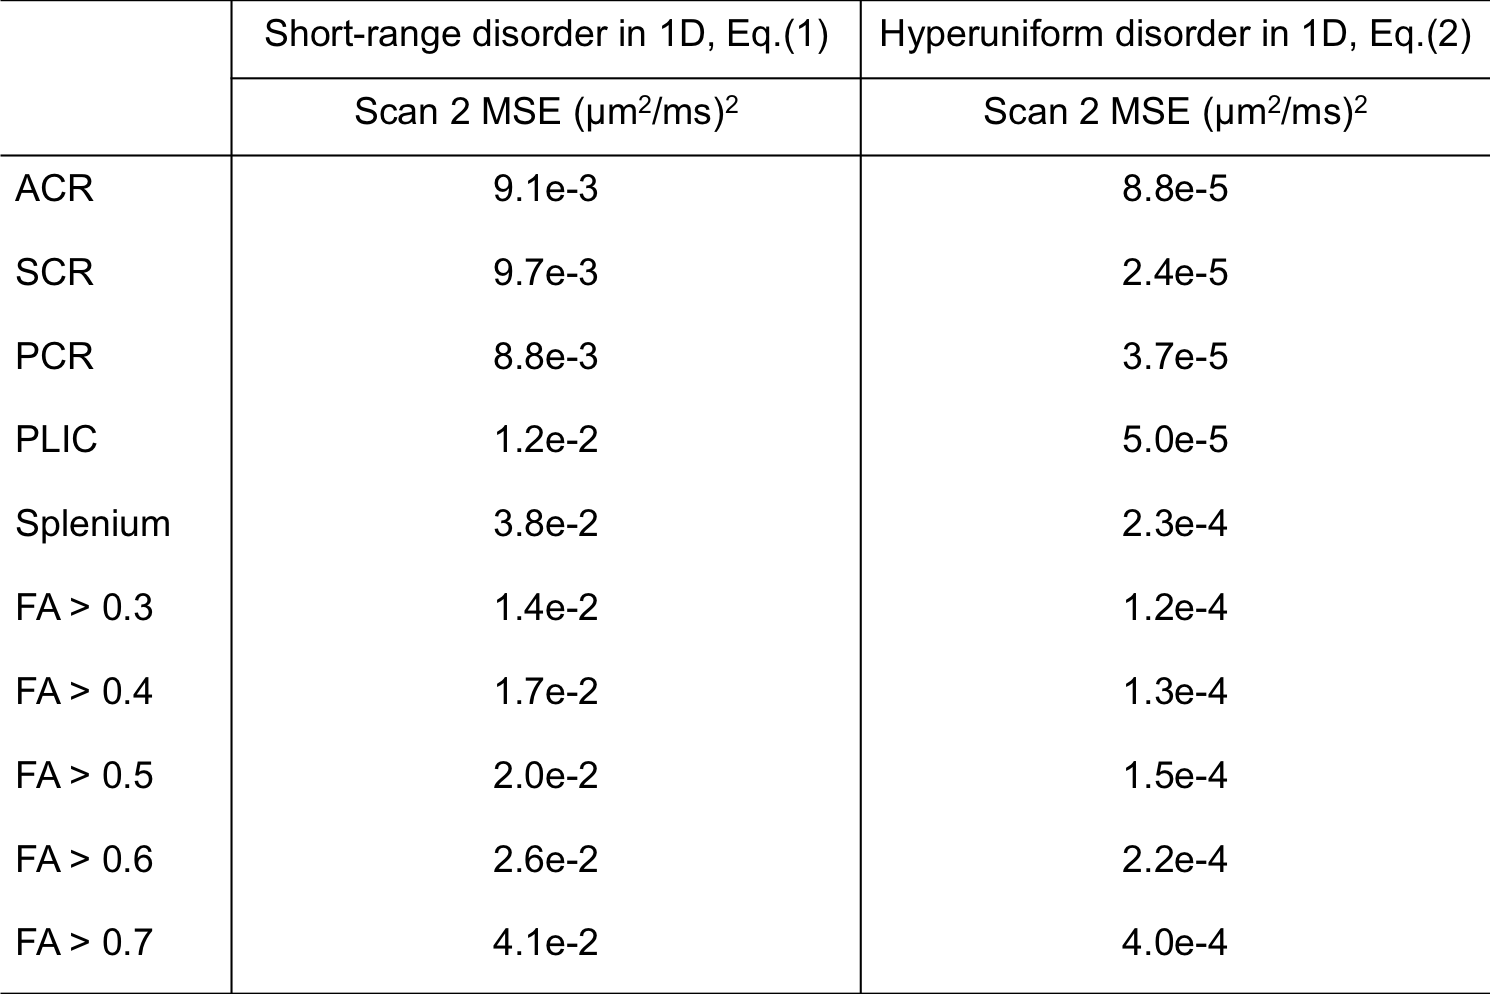
Using scan 1 data displaying $$$\delta$$$-dependence, axial diffusivities $$$D_\parallel^{\rm sr}$$$, Eq.(1), and $$$D_\parallel^{\rm hu}$$$, Eq.(2), both fit measurements well (see fits in Figs. 2a and 2c). The acquired parameters are shown in Table 1. To reveal the micro-geometry, we predicted the $$$\Delta$$$-dependence in scan 2 based on fit parameters in Table 1; the predictions based on Eqs.(1,2) are very different asymptotically, shown in Figs. 2b and 2d, where $$$D_\parallel^{\rm hu}$$$ in Eq.(2) captures the $$$\Delta$$$-dependence in the curves, and $$$D_\parallel^{\rm sr}$$$ in Eq.(1) deviates from experimental results. The goodness of prediction (MSE) is quantified in Table 2. The predictions of scan 2 were done without any adjustable parameters, since tissue properties are captured in scan 1, and $$$\Delta$$$- and $$$\delta$$$- dependence is shown in Eqs.(1,2). Thus, this prediction provides a parameter-free test of the models.Discussion and Conclusion
Figs.2a and 2b (FA thresholded ROI) and Figs.2c and 2d (WM anatomical ROI) both show, unexpectedly, that hyperuniform disorder, Eq.(2), seems to be more consistent with data than short-range disorder. If confirmed histologically in human or animal studies, this would mean that restrictions, e.g., varicosities in WM tracts, are not “purely” randomly distributed (but are not strictly ordered either), and are rather spatially correlated – perhaps, for optimizing physiological constraints.Outlook
Much attention is currently focused on quantifying known microstructure (e.g. water fractions, cell sizes). Our prediction of hyperuniformity, if confirmed histologically, would be the first instance of a macroscopic dMRI measurement revealing a previously unknown nontrivial feature of tissue organization at the cellular level.Acknowledgements
We would like to thank Thorsten Feiweier for developing advanced diffusion WIP sequence and Jelle Veraart for assistance in processing. Research was supported by the National Institute of Neurological Disorders and Stroke of the National Institutes of Health under award number R01NS088040.References
[1] Fieremans, E., et al. NI 129,414-427 (2016).
[2] Lee, H.H., et al. Proc ISMRM 23, 2777 (2015).
[3] Novikov, D.S., et al. PNAS 111,5088-5093 (2014).
[4] Shepherd, G.M.G., et al. PNAS 99,6340-6345 (2002).
[5] Does, M.D., et al. MRM, 49(2),206-215 (2003).
[6] Torquato, S. & Stillinger, F.H., PR E 68,041113 (2003).
[7] Mori, S., et al. MRI atlas of human white matter. Elsevier (2005).
Figures