3360
Characterization of B0 Shim-Induced Bias in Diffusion Weighting Gradients1Department of Radiology, University of Michigan, Ann Arbor, MI, United States, 2Department of Radiology and Radiological Science, The Johns Hopkins University School of Medicine, Baltimore, MD, United States, 3Department of Radiology and Biomedical Imaging, University of California San Francisco, San Francisco, CA, United States
Synopsis
To eliminate technical variability in quantitative diffusion imaging applications, the systematic bias in diffusion weighting gradients should be corrected. The major source of this bias is the system-specific spatial gradient non-linearity (GNL) that can be rectified using gradient design information independent of the scanned object. This study characterizes the residual sources of nonuniform diffusion weighting introduced by imperfect object-dependent B0 shimming. Using controlled de-shim gradients, we show that an imperfect shim leads to systematic offsets of the otherwise symmetric GNL profile relative to the isocenter. The empiric strategies are proposed to mitigate the shim-induced errors in ADC measurements.
Introduction
Spatially nonuniform diffusion weighting leads to predictable bias in the derived apparent diffusion coefficients (ADC)1,2. The major source of this bias is the system-specific gradient non-linearity (GNL) that can be corrected independent of the scanned object2. In a recent multi-site quantitative diffusion study, minor non-GNL ADC errors were detected that were attributed to the residual object-specific B0 shim gradients3. In the present work, well-controlled incremental shim gradients were introduced on a system with a known GNL profile for DWI scans of an ice-water phantom to study the relative effects of shim gradients on ADC measurements.Methods
Sagittal B0 map profiles of an ice-water phantom2 (Figure 1) were generated from multi-echo GRE scans on a 3.0T Philips Ingenia, a 1.5T GE Signa and a 1.5T Siemens Espree MRI scanner. The 1st order volume shim was used for 1.5T systems. On the 3T system, B0 shim was initially optimized via a 2nd order “pencil-beam volume” shim routine, and data were subsequently acquired with an incremental constant (de-)shim gradient along Z-channel set to 0, ±0.05, ±0.075 and ±0.1 mT/m (SW R5.1.7 “shimtool” patch). The incremental “0 mT/m” condition served as the “zero-shim” bias reference. Shim-gradients were calculated as spatial derivatives of B0 maps. B0 shim-gradient profiles along the Z-direction were obtained by averaging map pixel ROI values along the middle-slice phantom-tube. The single spin-echo (SSE) DWI sagittal scans were performed on all systems, using three b-values (b = 0, 750, 1500 s/mm2), with three diffusion gradient directions along primary magnet axes. An additional double spin-echo (DSE) DWI sequence variant was used on one system. Both b-value and diffusion direction were extracted from DICOM header. ADC maps were obtained from a linear log-signal DWI fit for (b = 0, b > 0) pairs. For DWI along Z-direction, the mean ADC was measured from 1cm (60 pixel) circular ROIs placed along the phantom tube between -50 and 80 mm. The superior-inferior (SI) dependence of the relative ADC bias, (ADC- ADC0)/ ADC0, with respect to the known ice-water value (ADC0=1.1x10⁻³ mm2/s), was modeled using vendor-provided gradient GNL characteristics. The residual non-GNL induced ADC errors, obtained by subtraction of the model GNL profile, were fitted to a linear function: C0+C1*z. The correlations of the fitted C0 and C1 with the controlled shim gradients were estimated using Pearson R-coefficient with t-test statistics. All data analysis was performed in Matlab (R2014b).Results and Discussions
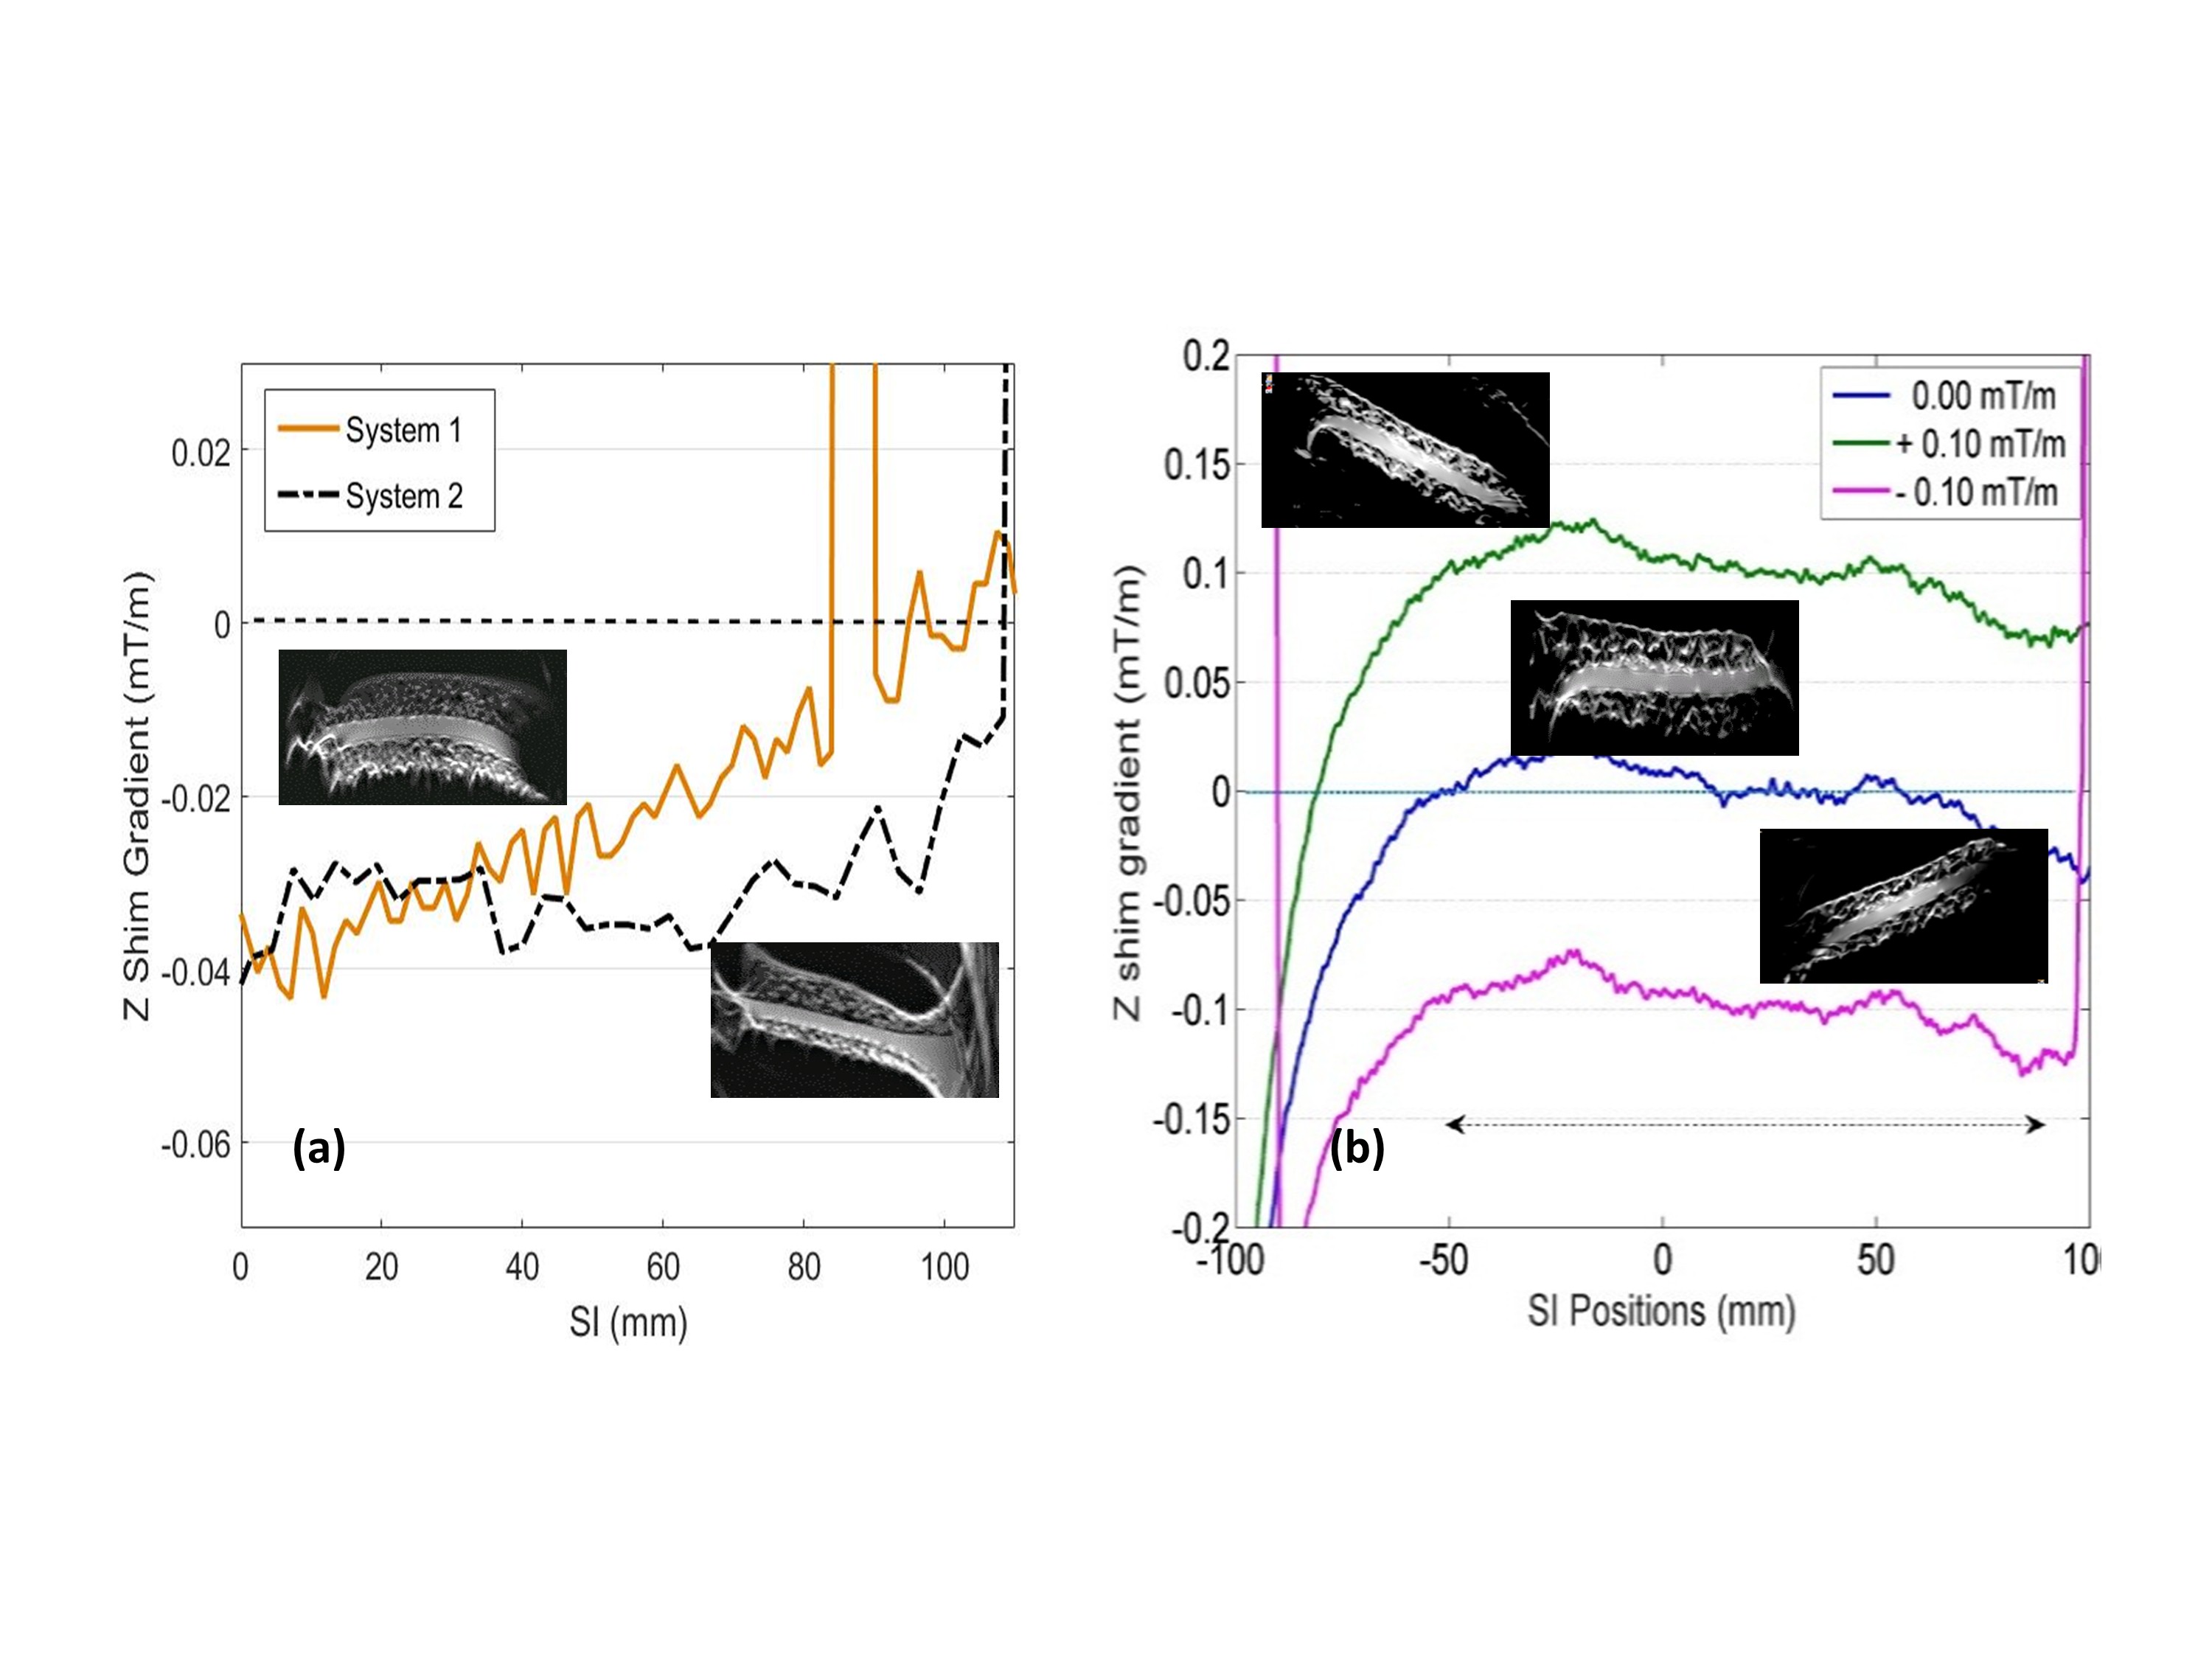
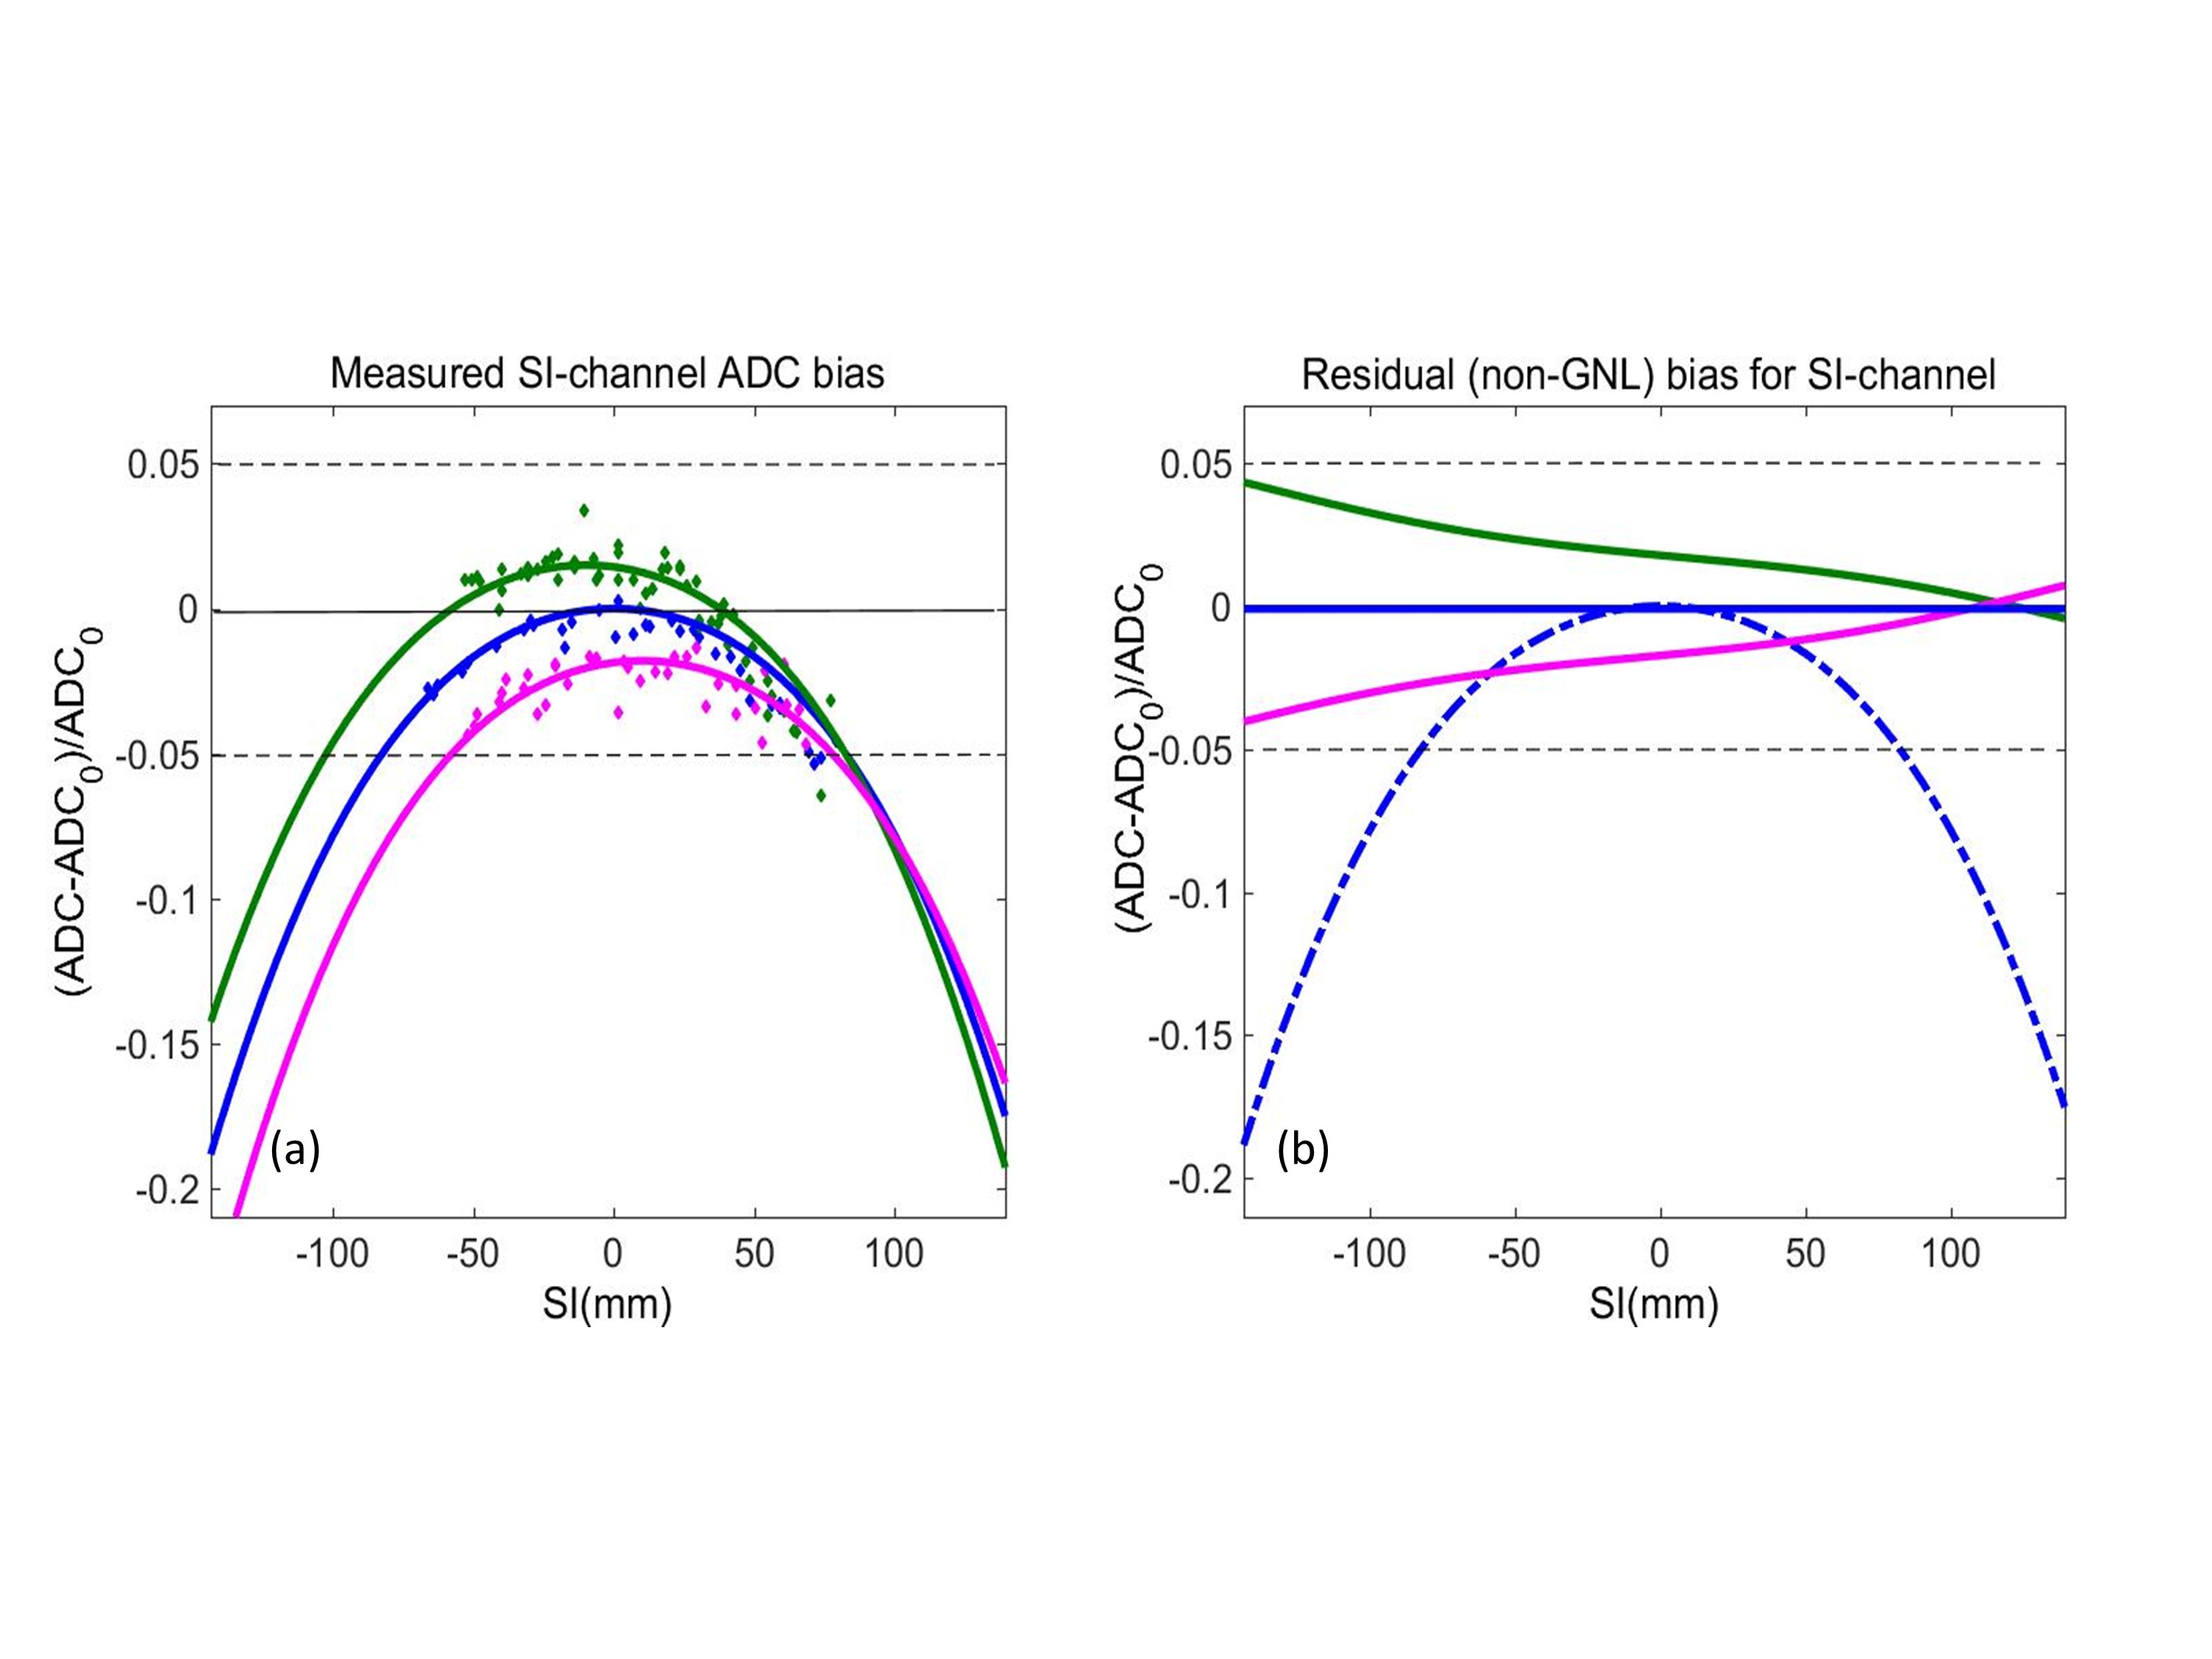
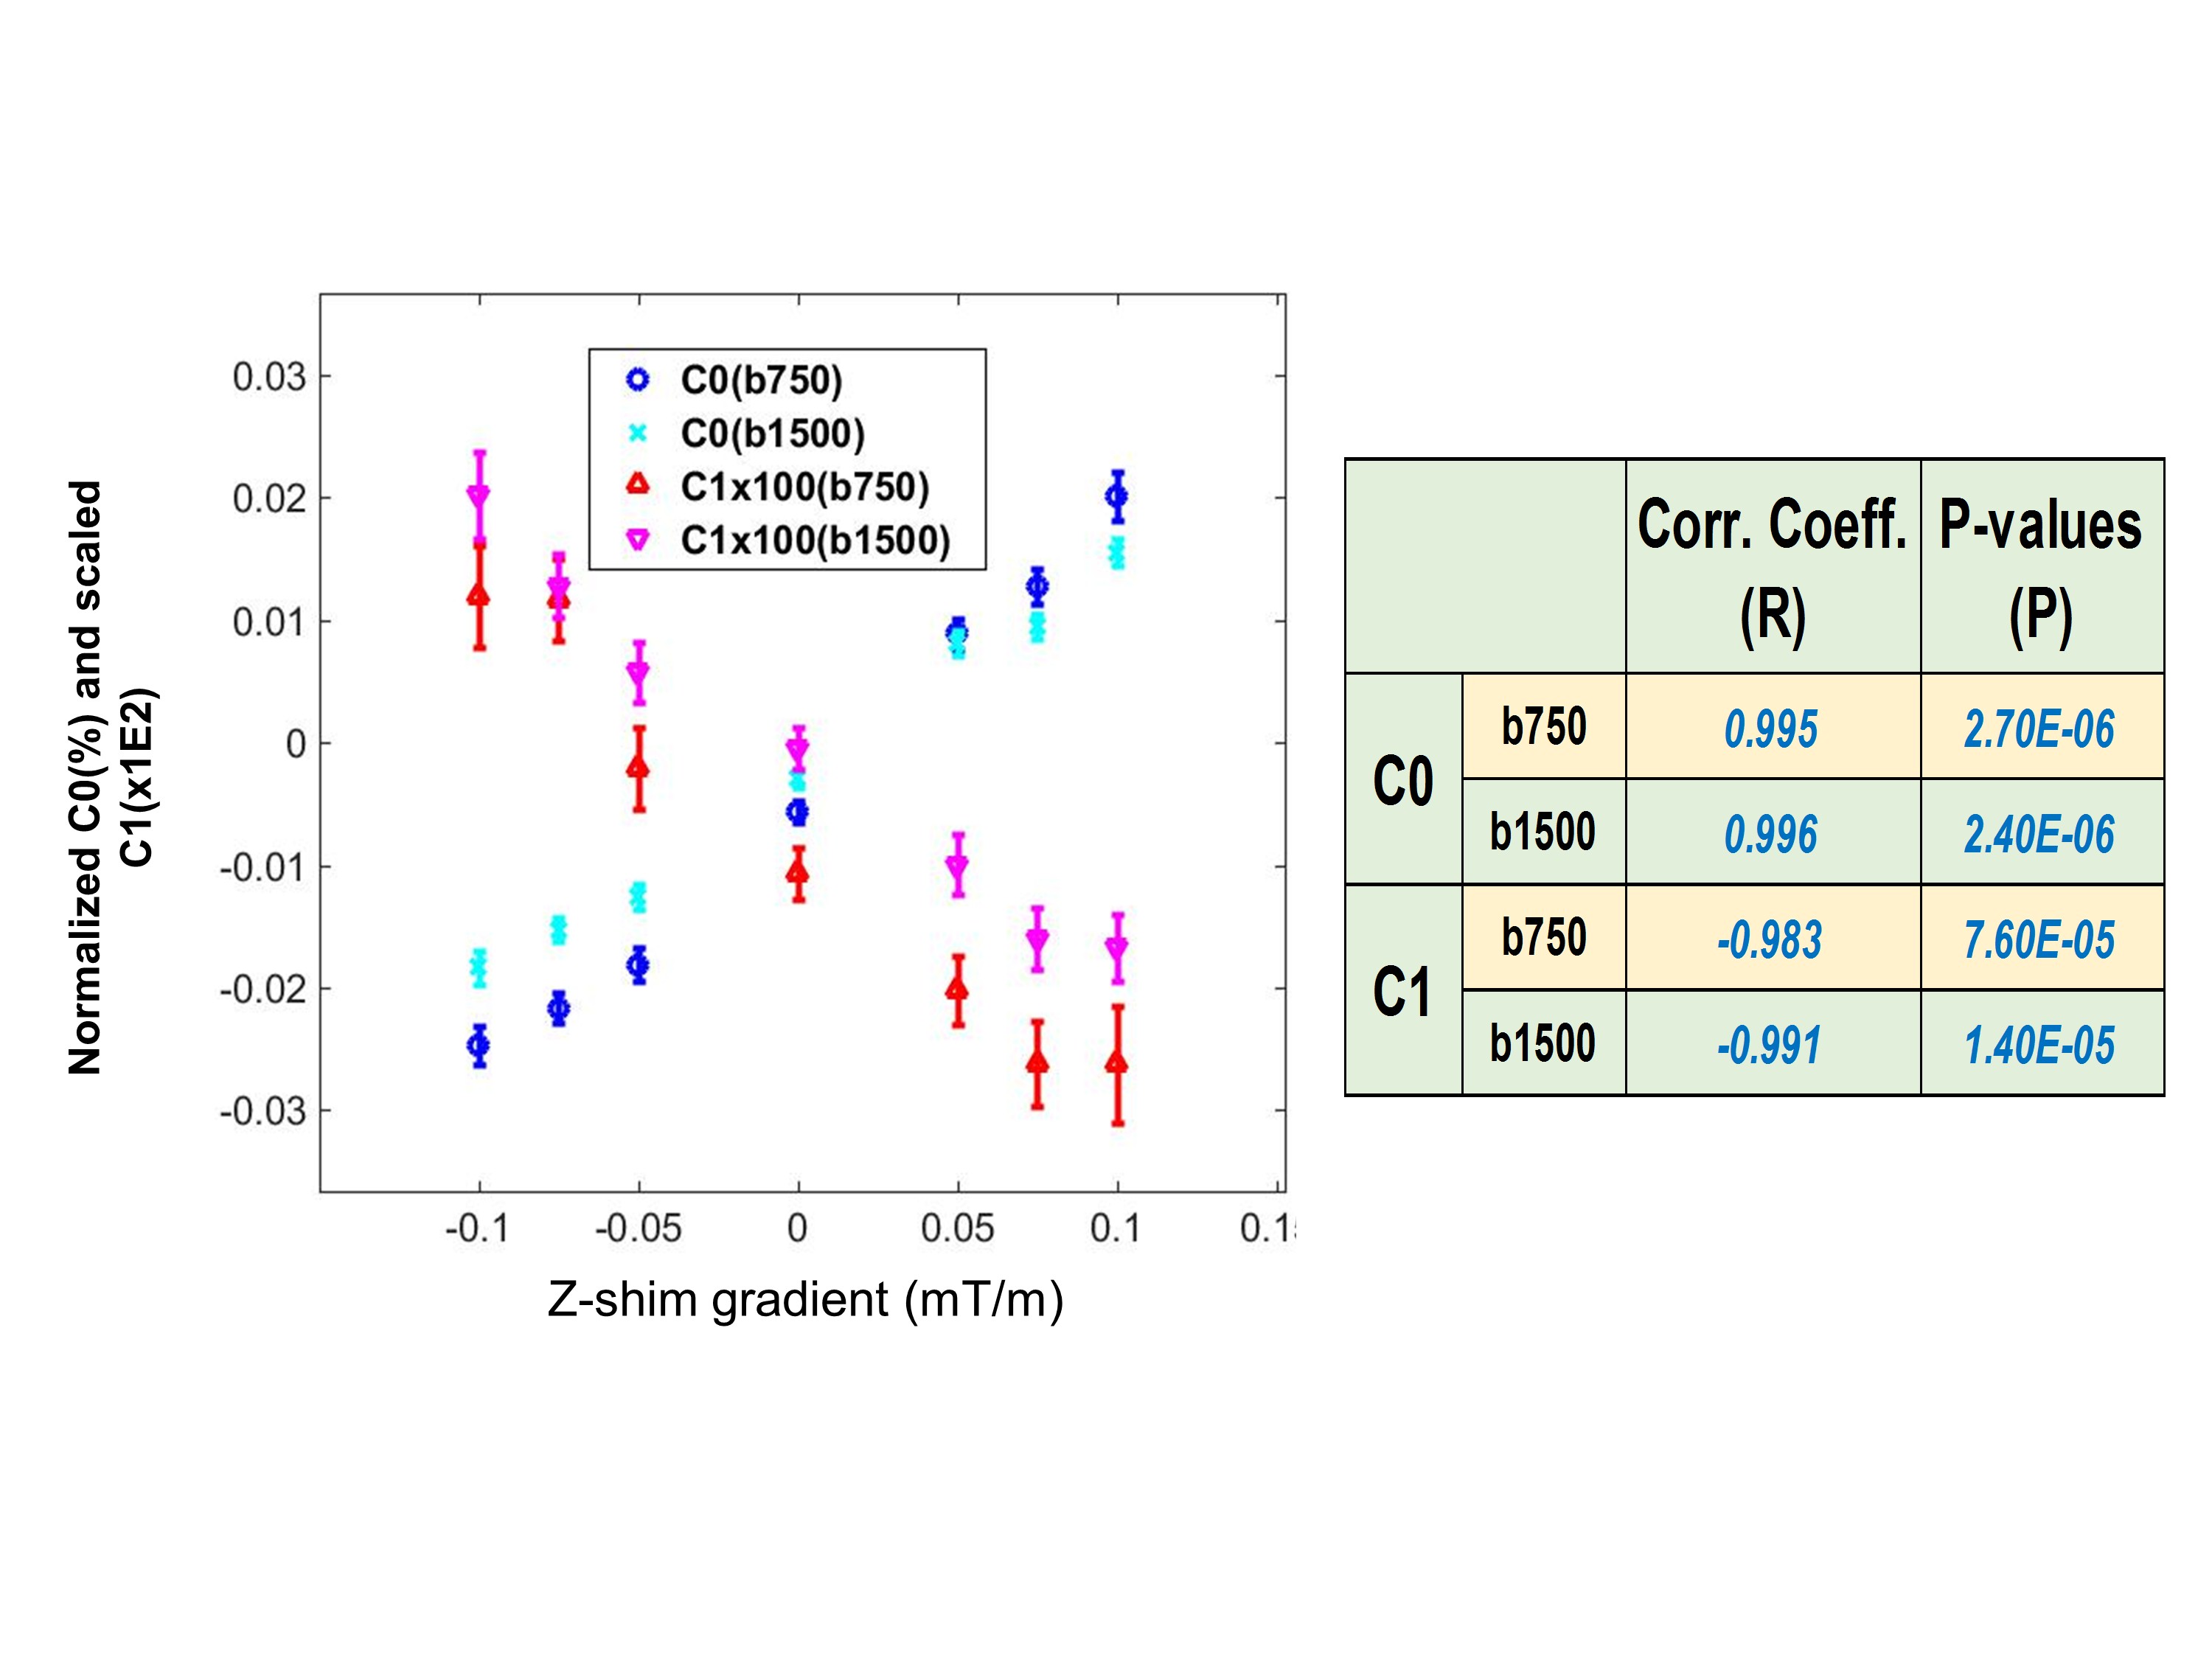
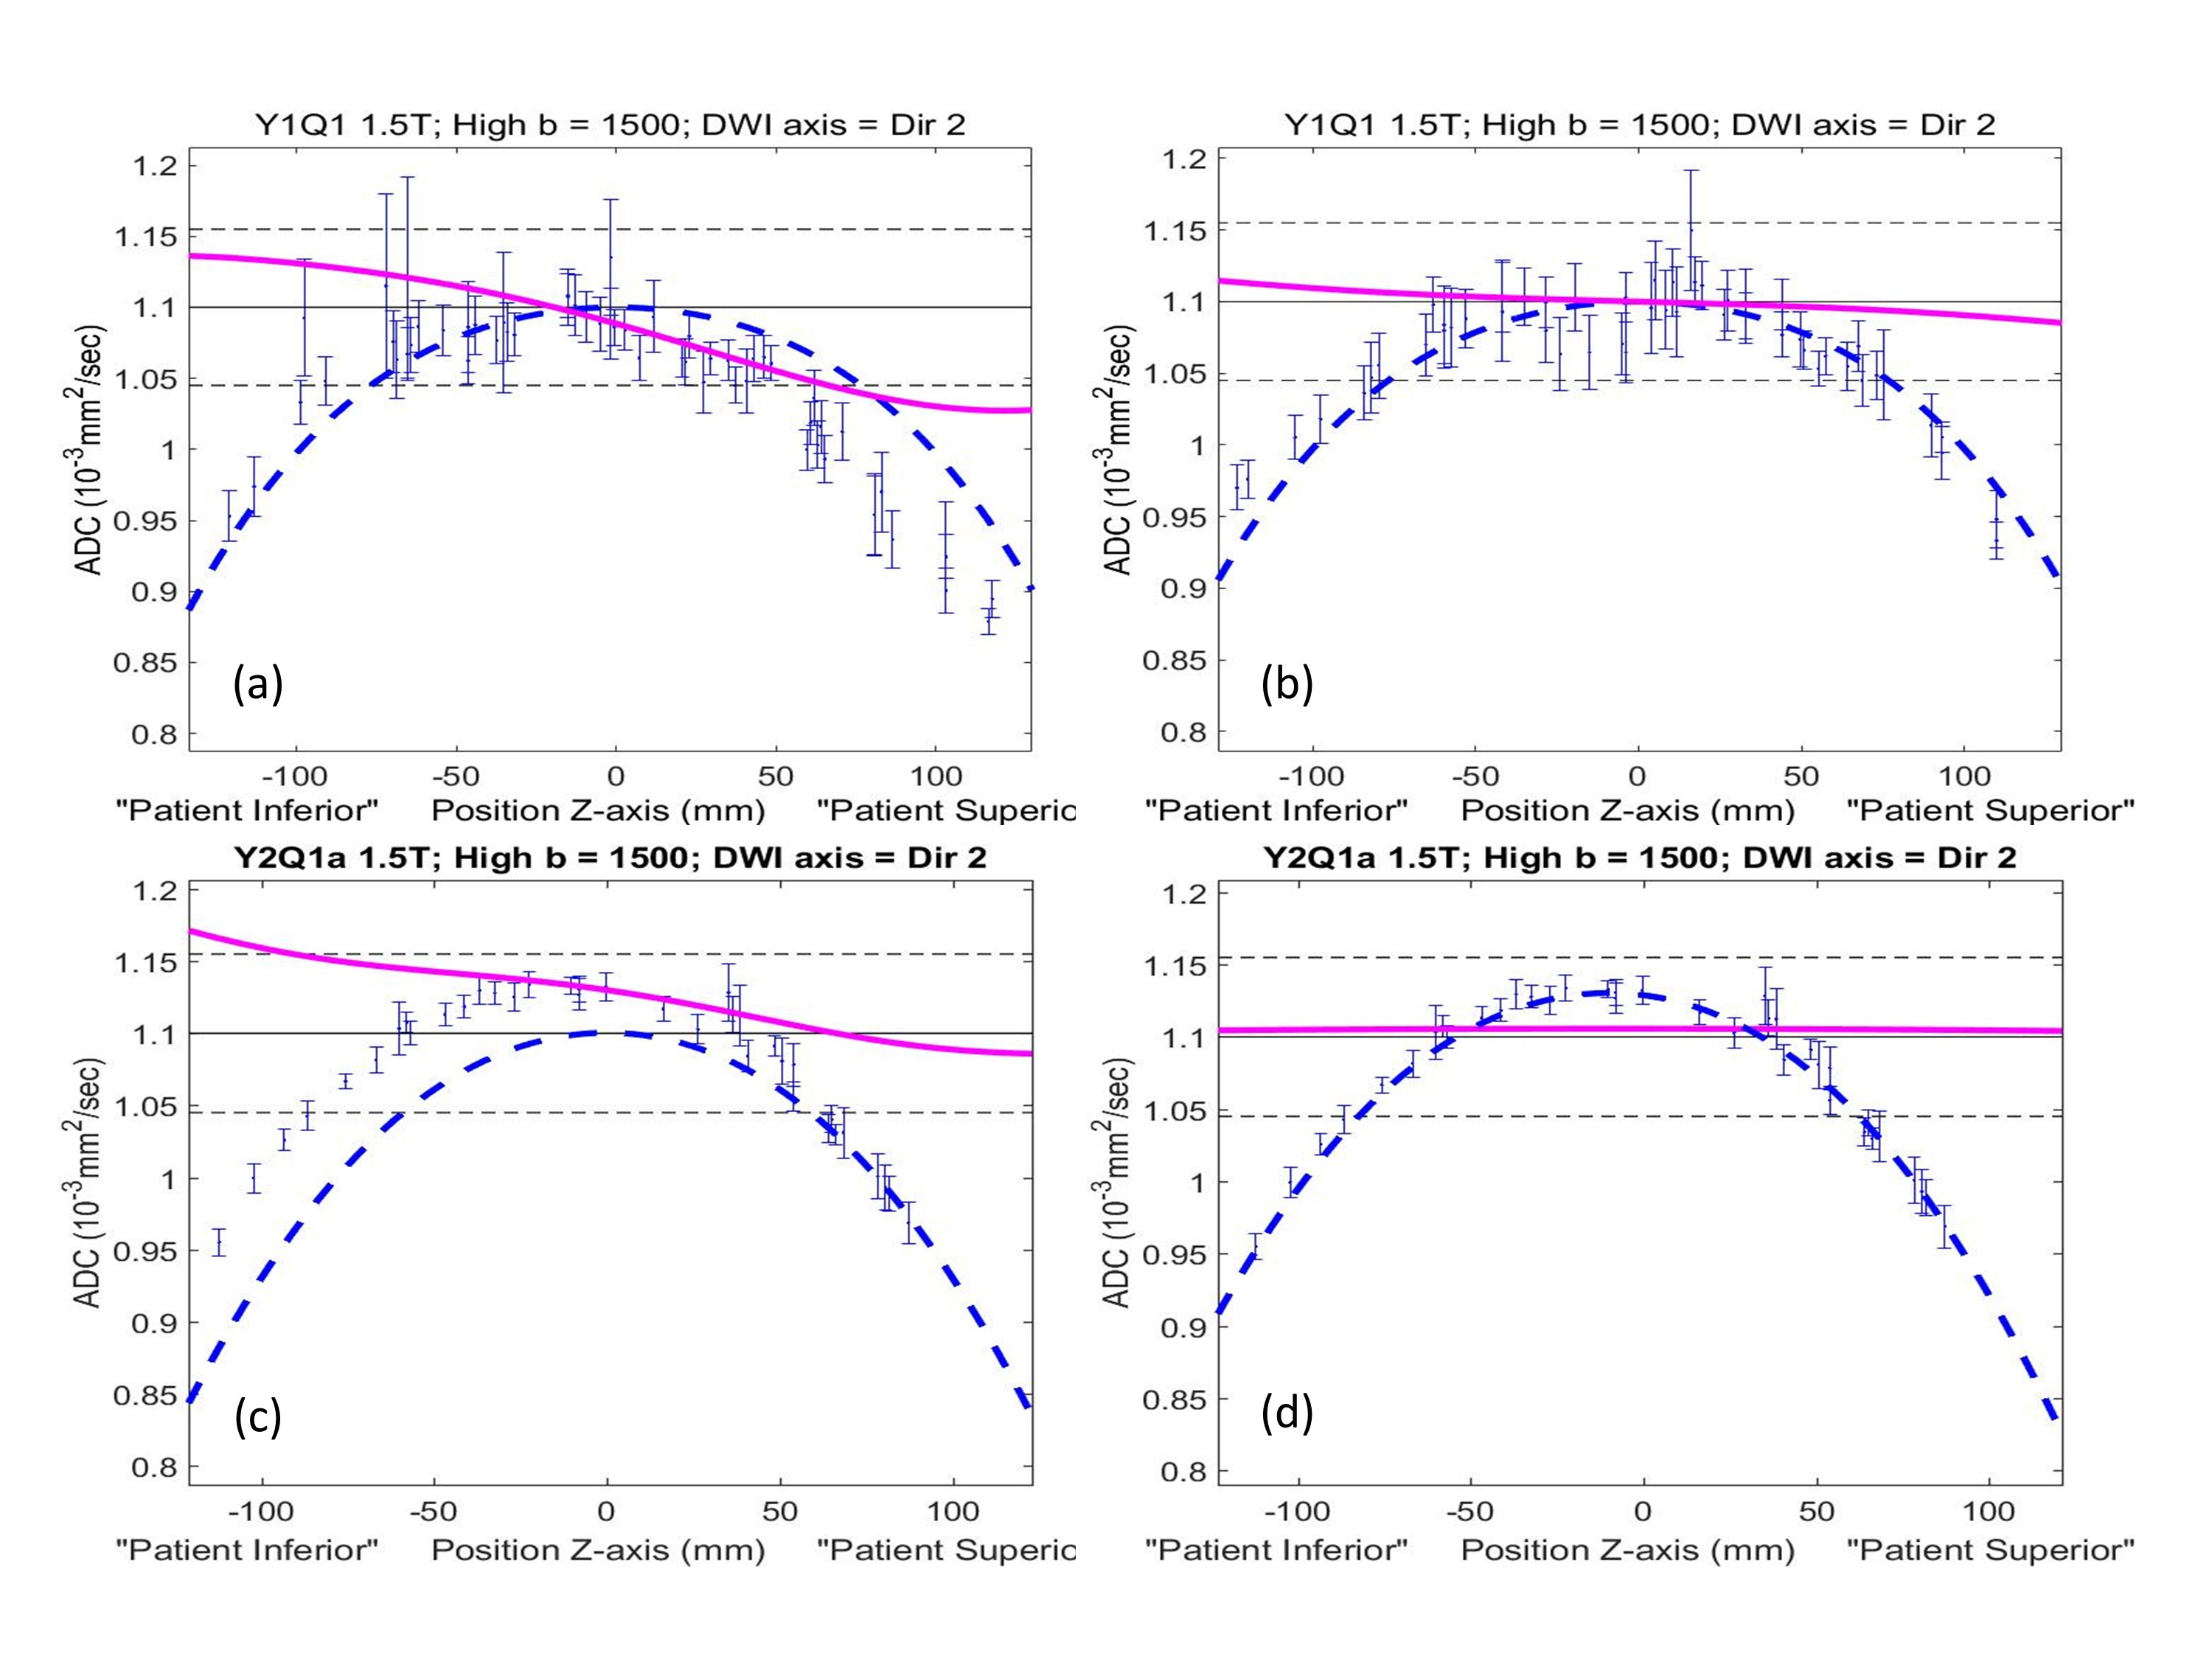
Figure 1 demonstrates B0 gradient profiles measured for the three studied MRI systems. The “sloped” and “offset” shim gradients observed for the System 1 and 2 lead to the characteristic 2nd and 1st order geometric distortions in the corresponding DWI images (Figure 1a, image inserts). Similar distortions are reproduced by introduction of de-shim gradients (±0.1mT/m) on System 3 (Fig. 1b). Figure 2 illustrates the effect of the controlled de-shimming on ADC bias. The reference symmetric GNL bias profile (Fig. 2a, blue) is noticeably shifted (~2%) both horizontally and vertically according to the direction of the applied shim gradients. The residual “sloped” (non-GNL) bias is shown in Figure 2b (green and magenta) and quantified by the constant, C0, and linear, C1, least-squares fit coefficients, respectively. Both coefficients are significantly (P < 10-4) correlated with the input shim gradient strengths, where correlation, R>0, is positive for C0 and negative, R<0, for C1, as shown in Figure 3. The constant bias offsets, Fig. 3 (circles), are marginally higher for lower b-value, while the bias slopes, Fig. 3 (triangles), are systematically lower. DSE DWI acquisition for System 1 or shim-induced offsets of System 2 GNL suppress the residual bias (Figure 4). Our results confirm that a constant residual shim gradient produces a proportional offset of diffusion weighting gradients (and b-value bias), while an additional shim gradient slope leads to the spatial shift of the ADC bias curve along the applied DWI gradient direction. This shift may increase the residual errors for remote locations. When DSE DWI is available, this shim-induced bias could be empirically mitigated3. Otherwise, by measuring B0 map of the object, the presence of the residual shim gradients can be quantified, and factored into an ideal GNL model by proportional spatial shifts and fractional offsets with respect to the isocenter.Conclusion
The residual shim gradients cause systematic offsets of an otherwise symmetric gradient non-linearity profile relative to the isocenter, introducing additional minor (<5%) spatial ADC bias. This residual bias could be mitigated by using a double spin-echo DWI sequence or by adjusting GNL corrections using the offsets obtained from measured B0 gradient profiles.Acknowledgements
Support: National Institutes of Health Grants: R01CA190299, U01-CA166104, U01CA151235, U01CA140204, 5P30CA006973.References
1. Newitt DC, Tan ET, Wilmes LJ, et al, Gradient Nonlinearity Correction to Improve Apparent Diffusion Coefficient Accuracy and Standardization in the American College of Radiology Imaging Network 6698 Breast Cancer Trial, J Magn Reson Imaging. 2015 Oct; 42(4): 908–919.
2. Bammer R, Markl M, Barnett A, et.al. Analysis and generalized correction of the effect of spatial gradient field distortions in diffusion-weighted imaging. Magn Reson Med. 2003;50(3):560-9.
3. Malyarenko DI, Newitt D, Wilmes LJ, et.al. Demonstration of nonlinearity bias in the measurement of the apparent diffusion coefficient in multicenter trials. Magn Reson Med. 2016;75(3):1312-23.
Figures