3359
Comparing the value of MRI ultra-high-b-value DWI and standard DWI in grading cerebral astrocytomas and their association with aquaporin-41The First Hospital of Shanxi Medical University, TaiYuan, People's Republic of China, 2GE Healthcare MR Research China, People's Republic of China
Synopsis
Ultral-High-b-value DWI (UHBV-DWI) was shown to improve the diagnostic performance of DWI in grading gliomas. We compare the value of MRI UHBV-DWI and conventional DWI for grading astrocytomas, and to analyze the correlation of respective parameters with aquaporin (AQP) expression. We found UHBV-ADC (0.810) showed a larger area under the curve (AUC) than that of ADC (0.713) (P < 0.05). The ADC value showed a negative correlation with AQP4 mRNA expression (r = -0.357; P = 0.024). UHBV-ADC value positively correlated with the AQP4 mRNA expression (r = 0.646; P < 0.01). So UHBV-DWI allowed for a more accurate grading of cerebral astrocytoma as compared to DWI. UHBV-ADC may be related with the AQP4 mRNA levels.
INTRODUCTION:
Astrocytomas are the most common primary
cerebral tumors. Accurate pre-treatment grading of astrocytomas is important
for predicting response to treatment and overall prognosis. High-b-value DWI
(HBV-DWI) was shown to improve the diagnostic performance of DWI in the
detection of high grade gliomas and prostate cancer [1]. Ling HY used a
tri-component model with multi b values (0-5000s/mm2) to calculate
ultra-high-b-value ADC (UHBV-ADC) which is generated by five multi-b-values
(2000-5000s/mm2) provides a useful measure of brain damage in patients with
Parkinson’s disease, and that ultra-high ADC may reflect water transportation
by aquaporin (AQP) [2]. The exact reason for this difference is not known. In this
study, we study the UHBV-ADC value generated from five ultra-high b-values in the grading of astrocytomas, and assessed the correlation of UHBV-ADC value with aquaporin (AQP[A1] ) expression.
METHODS:
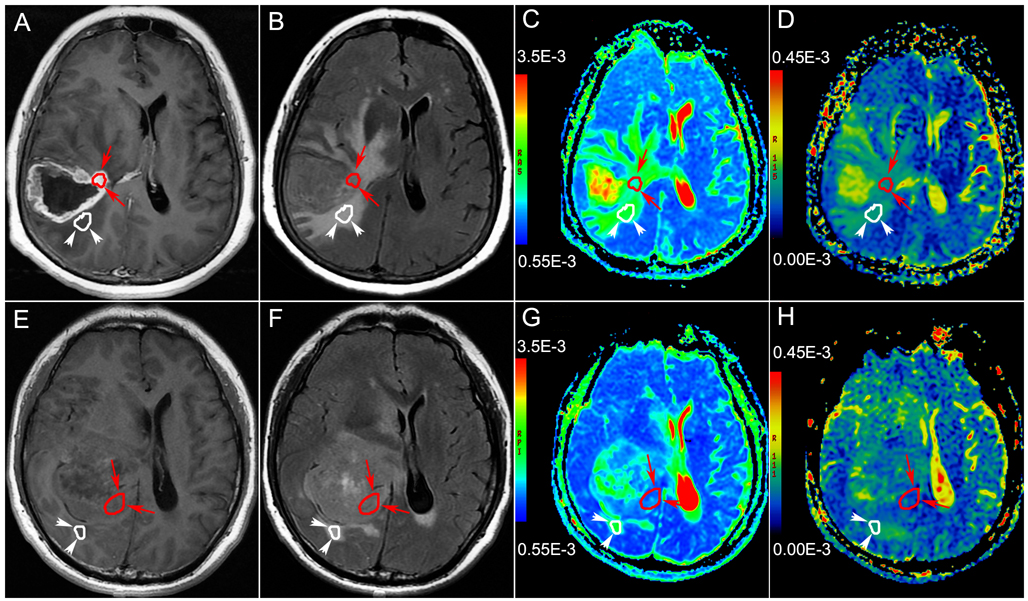
Forty patients with cerebral astrocytoma, including low-grade (LGA, N=15) and high-grade astrocytomas (HGA, N=25) were studied. The UHBV-DWI data acquisition: TR/TE: 3000/115.5 ms; field of view, 240 mm × 240 mm; matrix, 128 × 128; section thickness, 6 mm; slice interval, 1 mm. Apparent diffusion coefficient (ADC) maps were generated from standard b-values (1000s/mm2), while ultra-high-b-value ADC (UHBV-ADC) maps were generated from five ultra-high-b-values ( 1800, 2500, 3000, 3500 and 4000 s/mm2). ADC and UHBV-ADC values for the solid parts of the tumors and for peritumoral edema were compared (Fig.1). Receiver operating characteristic (ROC) curves were used to identify the better parameter for differentiation between high and low grade gliomas. Real time PCR was performed to assess the mRNA expressions of AQP1, AQP4 and AQP9 in the solid parts of the tumors. Spearman correlation analysis was performed to assess the correlation of AQP mRNA level with each parameter.RESULTS:
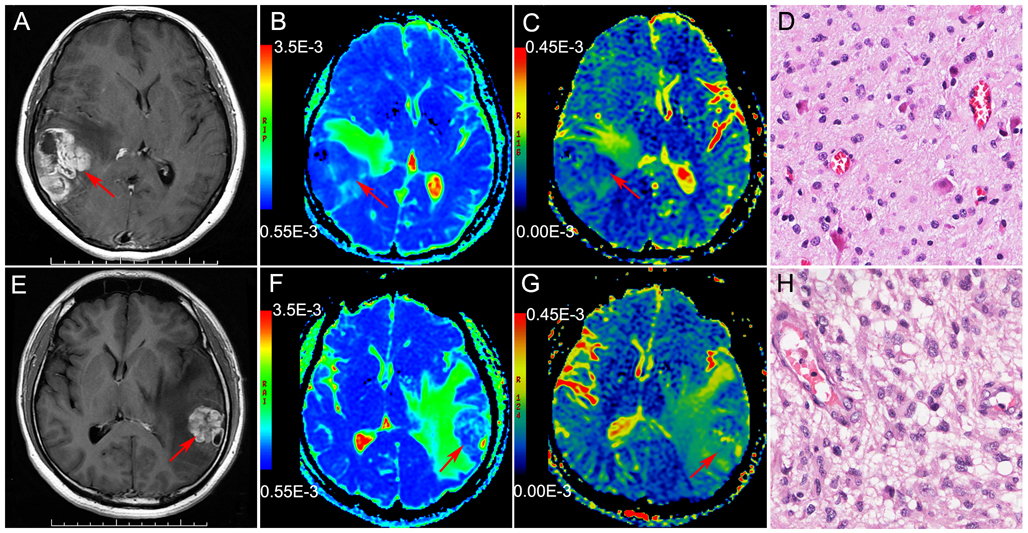
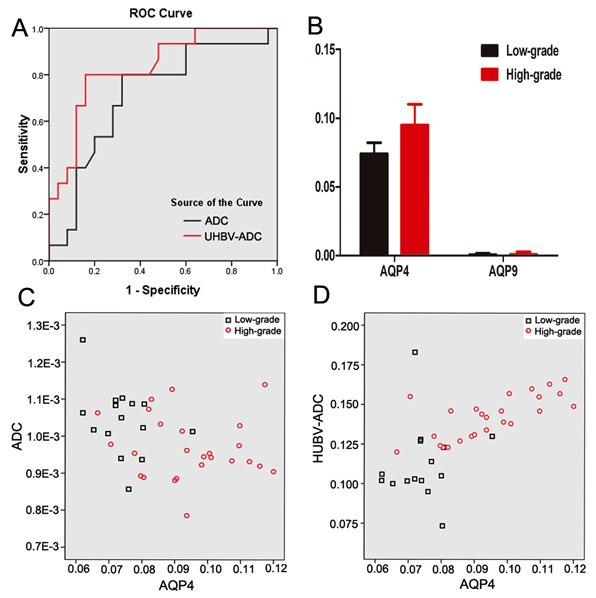
ADC values in the solid parts of HGA were significantly lower than those in the corresponding parts of LGA with both conventional and UHBV DWI. UHBV-ADC values in the solid parts of HGA were significantly higher than those in the corresponding parts of LGA (P < 0.01) (Fig.2 and Fig.3). ROC curve of UHBV-ADC (0.810) showed a larger area under the curve (AUC) than that of ADC (0.713) (P < 0.05) (Fig.3). Optimal thresholds for UHBV-ADC and ADC for differentiating the two groups were 0.869×10⁻³ mm2/s and 0.098×10⁻³ mm2/s, respectively. The level of AQP4 mRNA in the solid parts of the tumors was significantly higher in HGAs as compared to that in LGAs (P < 0.01) (Fig.3); there was less AQP9 mRNA and no AQP1 mRNA in two groups (P>0.05); The ADC value showed a negative correlation with AQP4 mRNA expression (r = -0.357; P = 0.024). UHBV-ADC value positively correlated with the AQP4 mRNA expression (r = 0.646; P < 0.01) (Fig.3).DISCUSSION:
UHBV-ADC values generated by five ultra-high-b-values (1800-4000s/mm2), which eliminates the influence of microvascular perfusion, the signal intensity mainly results from the slow diffusion component. A higher b-value DWI provides better contrast with its reflection of more tissue diffusivity and less T2 shine-through effect [3]. So UHBV-DWI allowed for a more accurate grading of cerebral astrocytoma as compared to DWI. In our reseach ADC value had slight negative correlation with AQP4 expression, while UHBV-ADC showed a positive correlation with AQP4 expression. The exact reason for this difference is not known which need further studying.CONCLUSION:
UHBV-DWI allowed for a more accurate grading of cerebral astrocytoma as compared to DWI. UHBV-ADC may be related with the AQP4 mRNA levels.Acknowledgements
This study was supported by grants from the National Natural Science Foundation (81471652) ; grants from the Science and Technology Innovation Fund of Medical University (01201304); grants from the Scientific and Technological Project of Health Department (201201071); grants from the Youth Innovation Fund in the First Hospital of University (YC1426).
References
[1] Yamasakia F, Kurisua K, Aokib T, et al. Advantages of high b-value diffusion-weighted imaging to diagnose pseudo-responses in patients with recurrent glioma after bevacizumab treatment. Eur J Radiol. 2012;81(10):2805-10.
[2] Ling XY, Zhang ZP, Zhao ZS, et al. Investigation of Apparent Diffusion Coefficient from Ultra-high b-Values in Parkinson’s Disease. Eur Radiol. 2015;25(9):2593-600.
[3] Burdette JH, Durden DD, Elster AD, et al. High b-value diffusion-weighted MRI of normal brain. J Comput Assist Tomogr. 2001;25(4):515-19.
Figures