3358
Stretched-exponential model DWI as a non-invasive biomarker in grading gliomas and predicting of EGFR status1Tongji hospital, Tongji medical college, Huazhong university of science and technology, Wuhan, People's Republic of China
Synopsis
Stretched-exponential diffusion weighted imaging (SEM-DWI) provided a more accurate estimate than conventional DWI in grading gliomas. Moreover, SEM-DWI derived α value could effectively differentiate EGFR negative and positive group and had a significantly negative correlation with EGFR expression . Therefore, it was concluded that SEM-DWI might be applied as an effective imaging biomarker in grading gliomas and predicting of EGFR status and thus in guiding individual treatment and targeted therapy.
Introduction and Purpose
Diffusion-weighted imaging (DWI) derived ADC has shown great potential as a noninvasive imaging biomarker for preoperative tumor grading, and evaluation of tumors response to treatment [1-4]. Conventional modeling of DWI signal decay is most frequently performed using the mono-exponential model (MEM) which is in a Gaussian distribution. In fact, water diffusion behavior in biological tissues is widely observed to be non-monoexponential due to the complicated cellular structures. Stretched-exponential DWI (SEM-DWI) was was one of these approaches employed to the characterization of non-Gaussian diffusion. Epidermal growth factor receptor amplification is a common molecular event in glioblastomas[5]. The purpose of this study was to evaluate the SEM-DWI in grading astrocytoma and predicting of astrocytoma EGFR status.Materials and Methods
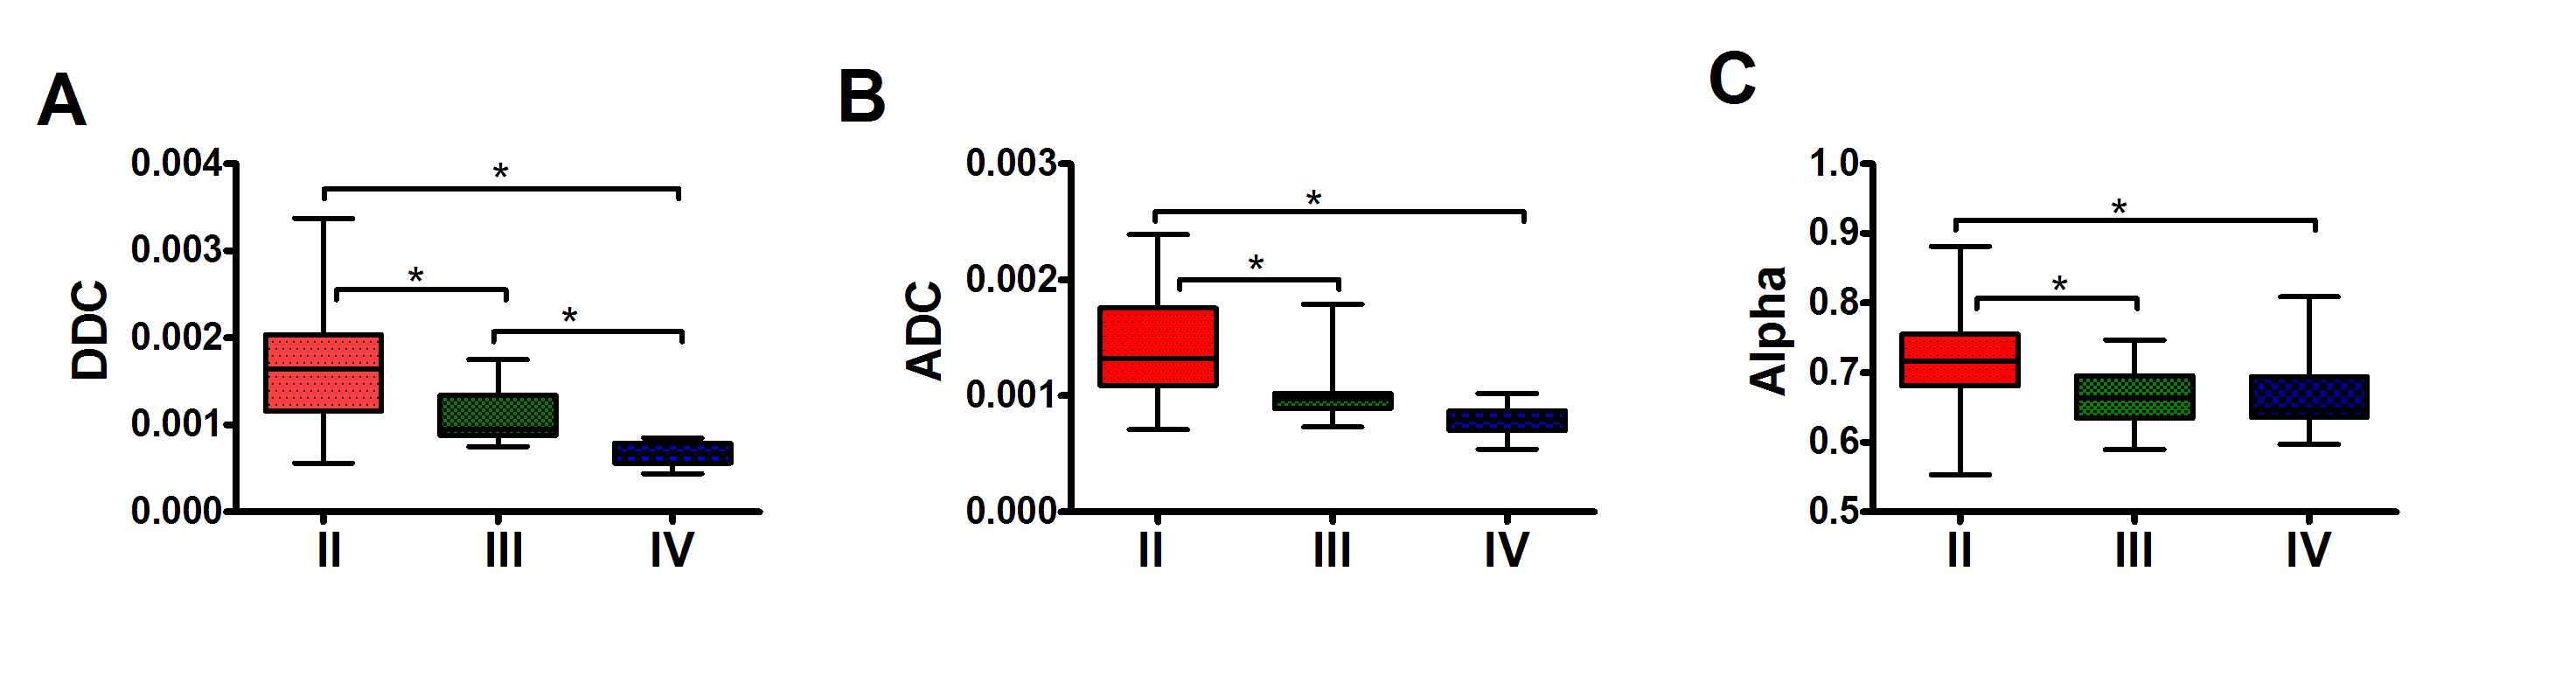
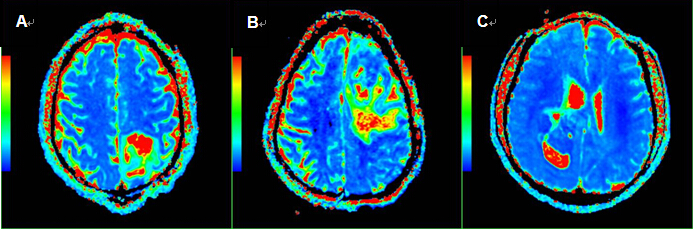
Seventy-two patients with primary cerebral astrocytomas (WHO grades II/III/IV: n= 34/15 /23; female/male = 29/43, mean age: 43 years old)) were scanned for SEM-DWI with b values extending from 0 to 3000 s/mm2 at 3.0 Tesla Signa HDxt GEMR system with an 8-channel phased-array head coil. Based on the SEM, distributed diffusion coefficient (DDC) maps and α maps were calculated. Regions of interest (ROIs) were placed in the solid part of the tumors, repeated three times, and then the mean value of DDC and α were obtained for statistical analysis.Biopsies of 54 astrocytomas (WHO grades II/III/IV: n=25/13/16) were performed for the evaluation of EGFR expression.Results
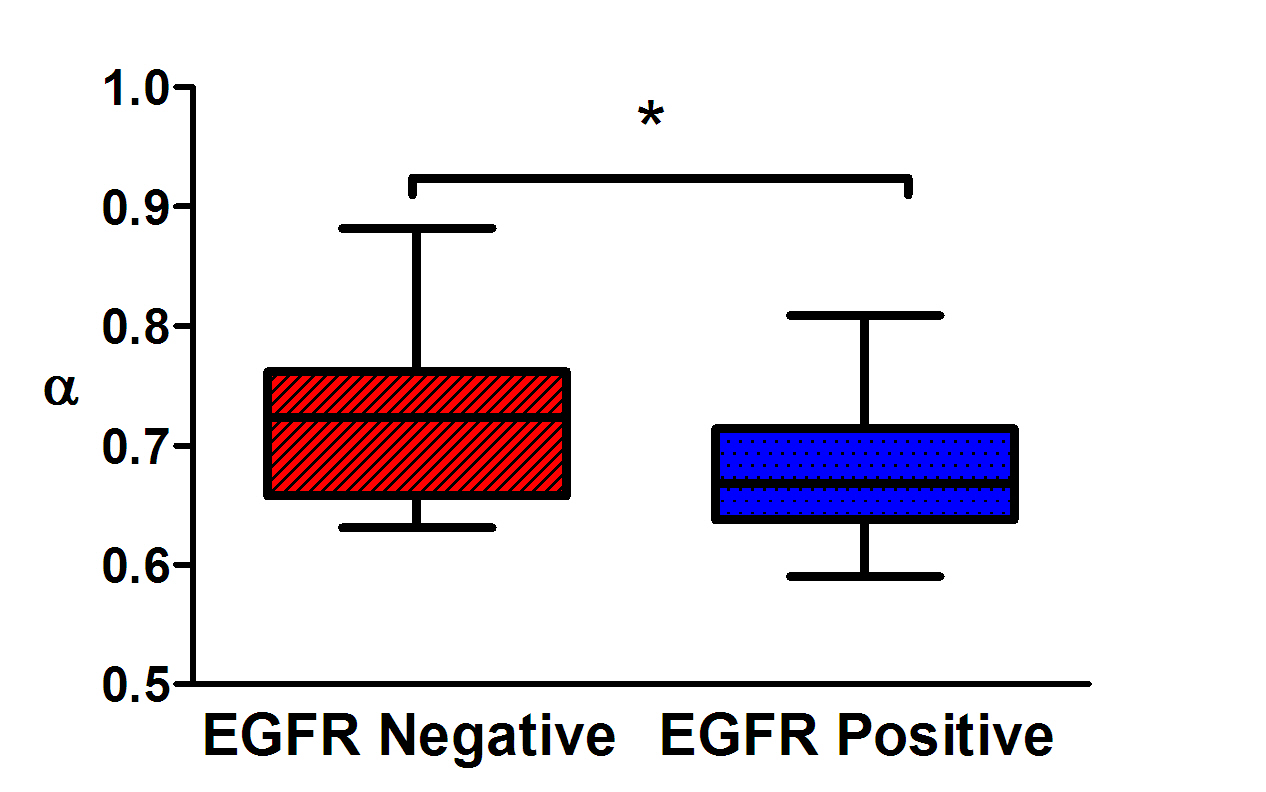
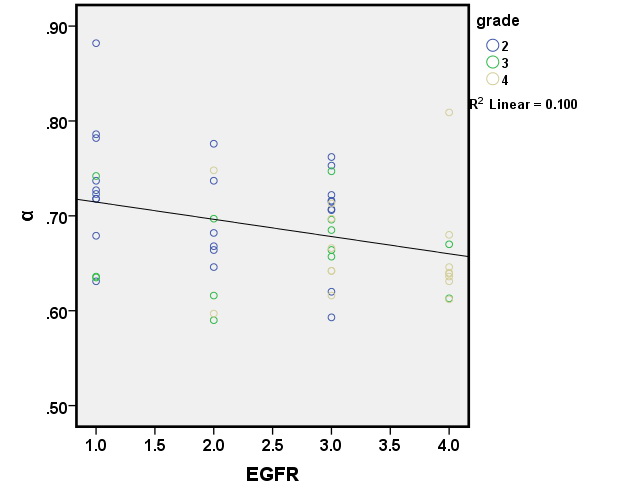
Mean DDC had significant difference between any two groups of grade II, III, and IV astrocytomas(P<0.05), which demonstrated higher values in low-grade astrocytomas (LGA) than that in high-grade (HGA) (P < 0.05) (Figure 1). There were statistically differences of α and ADC values between Ⅱ and III or IV astrocytomas (P < 0.05), but they did not differ significantly between III and IV astrocytomas. 41 out of 54 patients showed positive EGFR expression. Significantly positive correlation was found between EGFR expression and grade (P < 0.05). Significantly negative correlation was noted between EGFR expression and α (P < 0.05). Mean α had significant difference in EGFR negative and EGFR positive group. In discriminating EGFR negative from positive group, the area under the curve(AUC), the cut-off value, sensitivity and specificity of α were respectively 0.701, 0.7170, 69.2% and 80.5%.Conclusions
SEM-DWI provided a more accurate estimate than conventional DWI in grading gliomas. Moreover, α could effectively differentiate EGFR negative and positive group and had a significantly negative correlation with EGFR expression. Therefore, it was concluded that SEM-DWI might be applied as an effective imaging biomarker in grading gliomas and predicting of EGFR status and thus in guiding individual treatment and targeted therapy.Acknowledgements
No acknowledgement found.References
[1] Kang Y, et al. Radiology 2011; 261(3);882-890. [2] Server A, et al. Eur J Radiol 2011; 80(2);462-470. [3] Chu HH, et al. Radiology 2013; 269(3);831-840. [4]Schmainda KM. CNS Oncol 2012; 1(2);169-180. [5] Young RJ, et al. AJNR Am J Neuroradiol 2013; 34(12);2271-2277.
Figures