3357
Assessing local brain morphology changes with diffusion tensor-driven tensor based morphometry (D-TBM): Application to a genetic model of dysgenesis1Quantitative Medical Imaging Section, NIBIB, NIH, Bethesda, MD, United States, 2SQITS/NICHD, NIH, Bethesda, MD, United States, 3Henry M. Jackson Foundation, Bethesda, MD, United States, 4Opthamology, Harvard Medical School, Boston, MA, United States, 5Opthamology, Boston Children's Hospital, Boston, MA, United States, 6Neurology, Boston Children's Hospital, Boston, MA, United States, 7Neurology, Harvard Medical School, Boston, MA, United States, 8Howard Hughes Medical Institute, Chevy Chase, MD, United States
Synopsis
Brain volume registration using diffusion tensor information faithfully matches anatomic features that are not accessible to structural registration algorithms such as white matter tracts. Thus, inspection of the deformation fields from DT-based registration using TBM (D-TBM) is advantageous for revealing local morphometric differences when compared with conventional TBM. In this study, D-TBM was used to evaluate morphometric differences and heterogeneity of abnormalities in a mouse model of dysgenesis.
Purpose
Registration approaches based on full diffusion tensor information produce deformation fields that can be analyzed with diffusion tensor-driven tensor based morphometry (D-TBM) to provide information about tract morphology that is not accessible using conventional TBM methods(1). The purpose of this work was to apply D-TBM by voxelwise analysis of the log of the Jacobian of the deformation field (LogJ analysis)(1,2) from Diffeomorphic Registration for Tensor Accurate alignMent of Anatomical Structures (DRTAMAS)(3) to identify abnormal white matter (WM) and gray matter (GM) neuroanatomy in mouse brains with severe dysgenesis.Methods
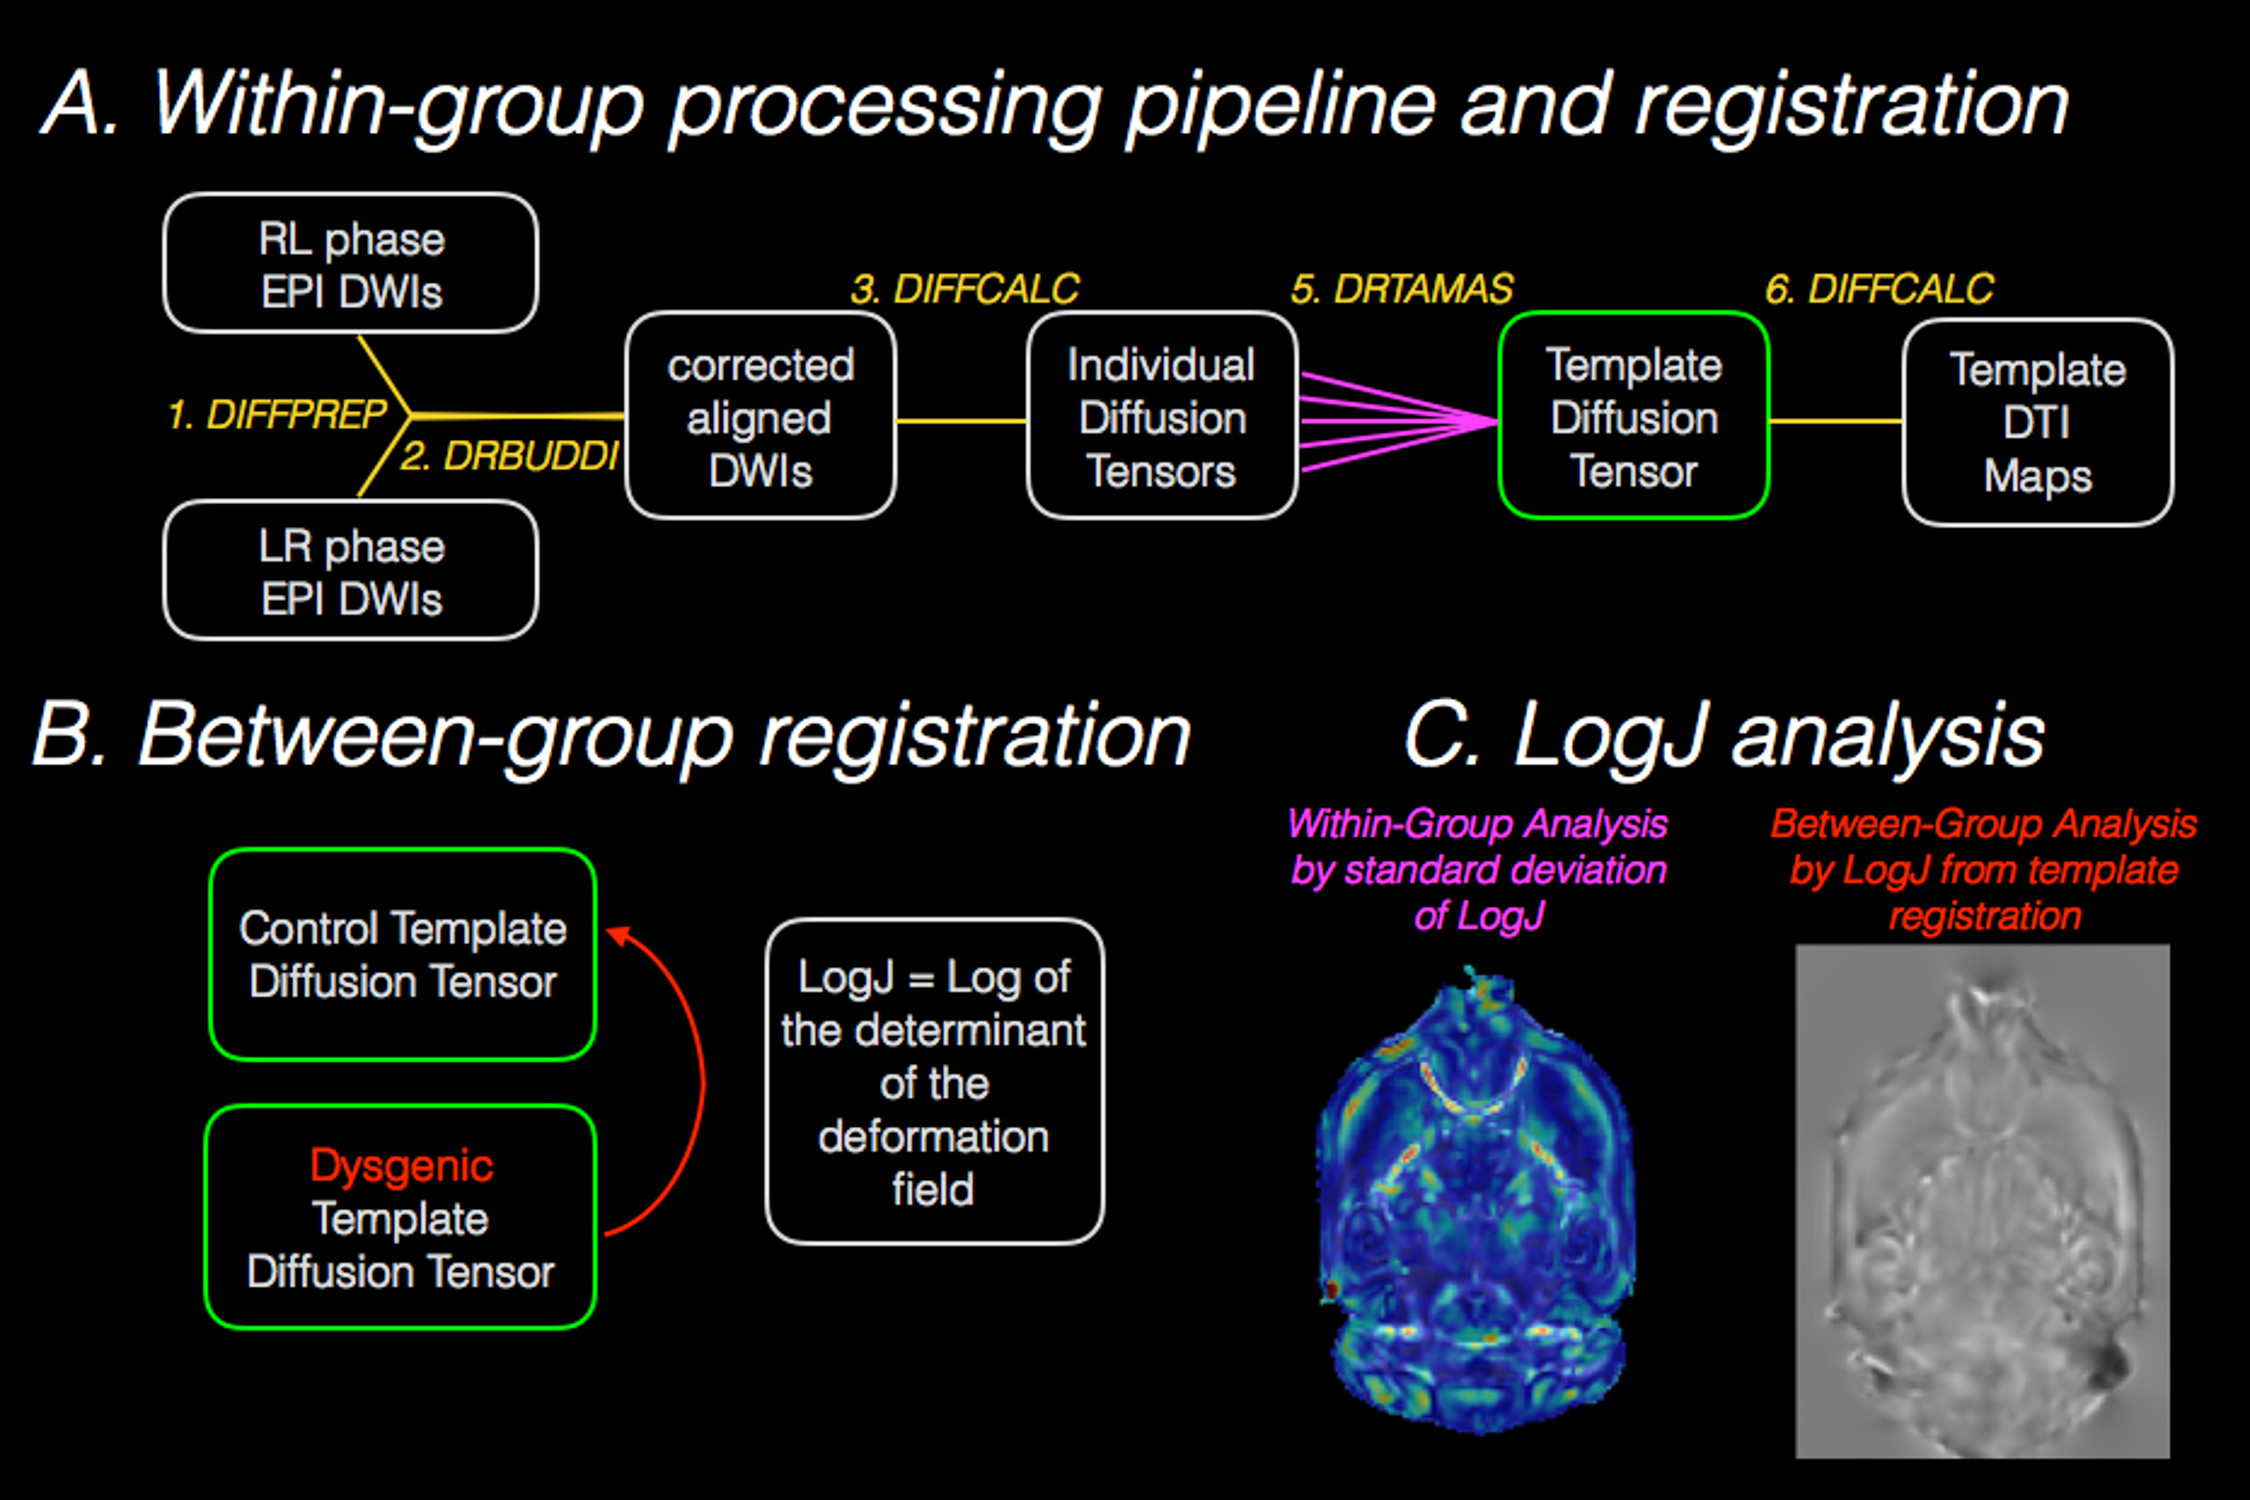
Ex-vivo brain specimens were obtained from normal C57/Bl6 mice (n=7) and from a strain of mice with known dysgenesis of the major WM tracts (n=3). Imaging was performed using a Bruker 14T microimaging MRI system and ParaVision 5.1 software. Diffusion weighted MRIs (DWIs) were acquired with “blip-up-blip-down” repetitions using a 3D EPI pulse sequence with TE/TR=53/750ms, 4 segments, 1 nex and 100 micron isotropic resolution using the following diffusion sampling scheme: b(#dirs): 250(6), 500(6), 1500(32), 3000(32), 4500(56) and 6000(87). DWIs were corrected for apparent motion by registration to a single image and geometric distortions were corrected by Diffeomorphic Registration for Blip-Up blip-Down Diffusion Imaging (DRBUDDI)(4) using the TORTOISE software package (www.tortoisedti.org(5)) and the diffusion tensor was computed in each voxel. Within each group, the diffusion tensors were used to generate a group template using the DRTAMAS template-building tool and the resulting deformation field for each brain was used to generate a log of the Jacobian (LogJ) image. LogJ images display local volumetric changes of brain structures, with positive values indicating enlargement and negative values indicating contraction(6). Each LogJ image was used to calculate a standard deviation map for LogJ values in each group to report within-group morphological variability. Next, the template for each of the genetic model groups was registered to the WT template using DRTAMAS and the LogJ map for each was calculated to report between-group morphological differences. The processing and analysis pipeline is shown in figure 1.Results
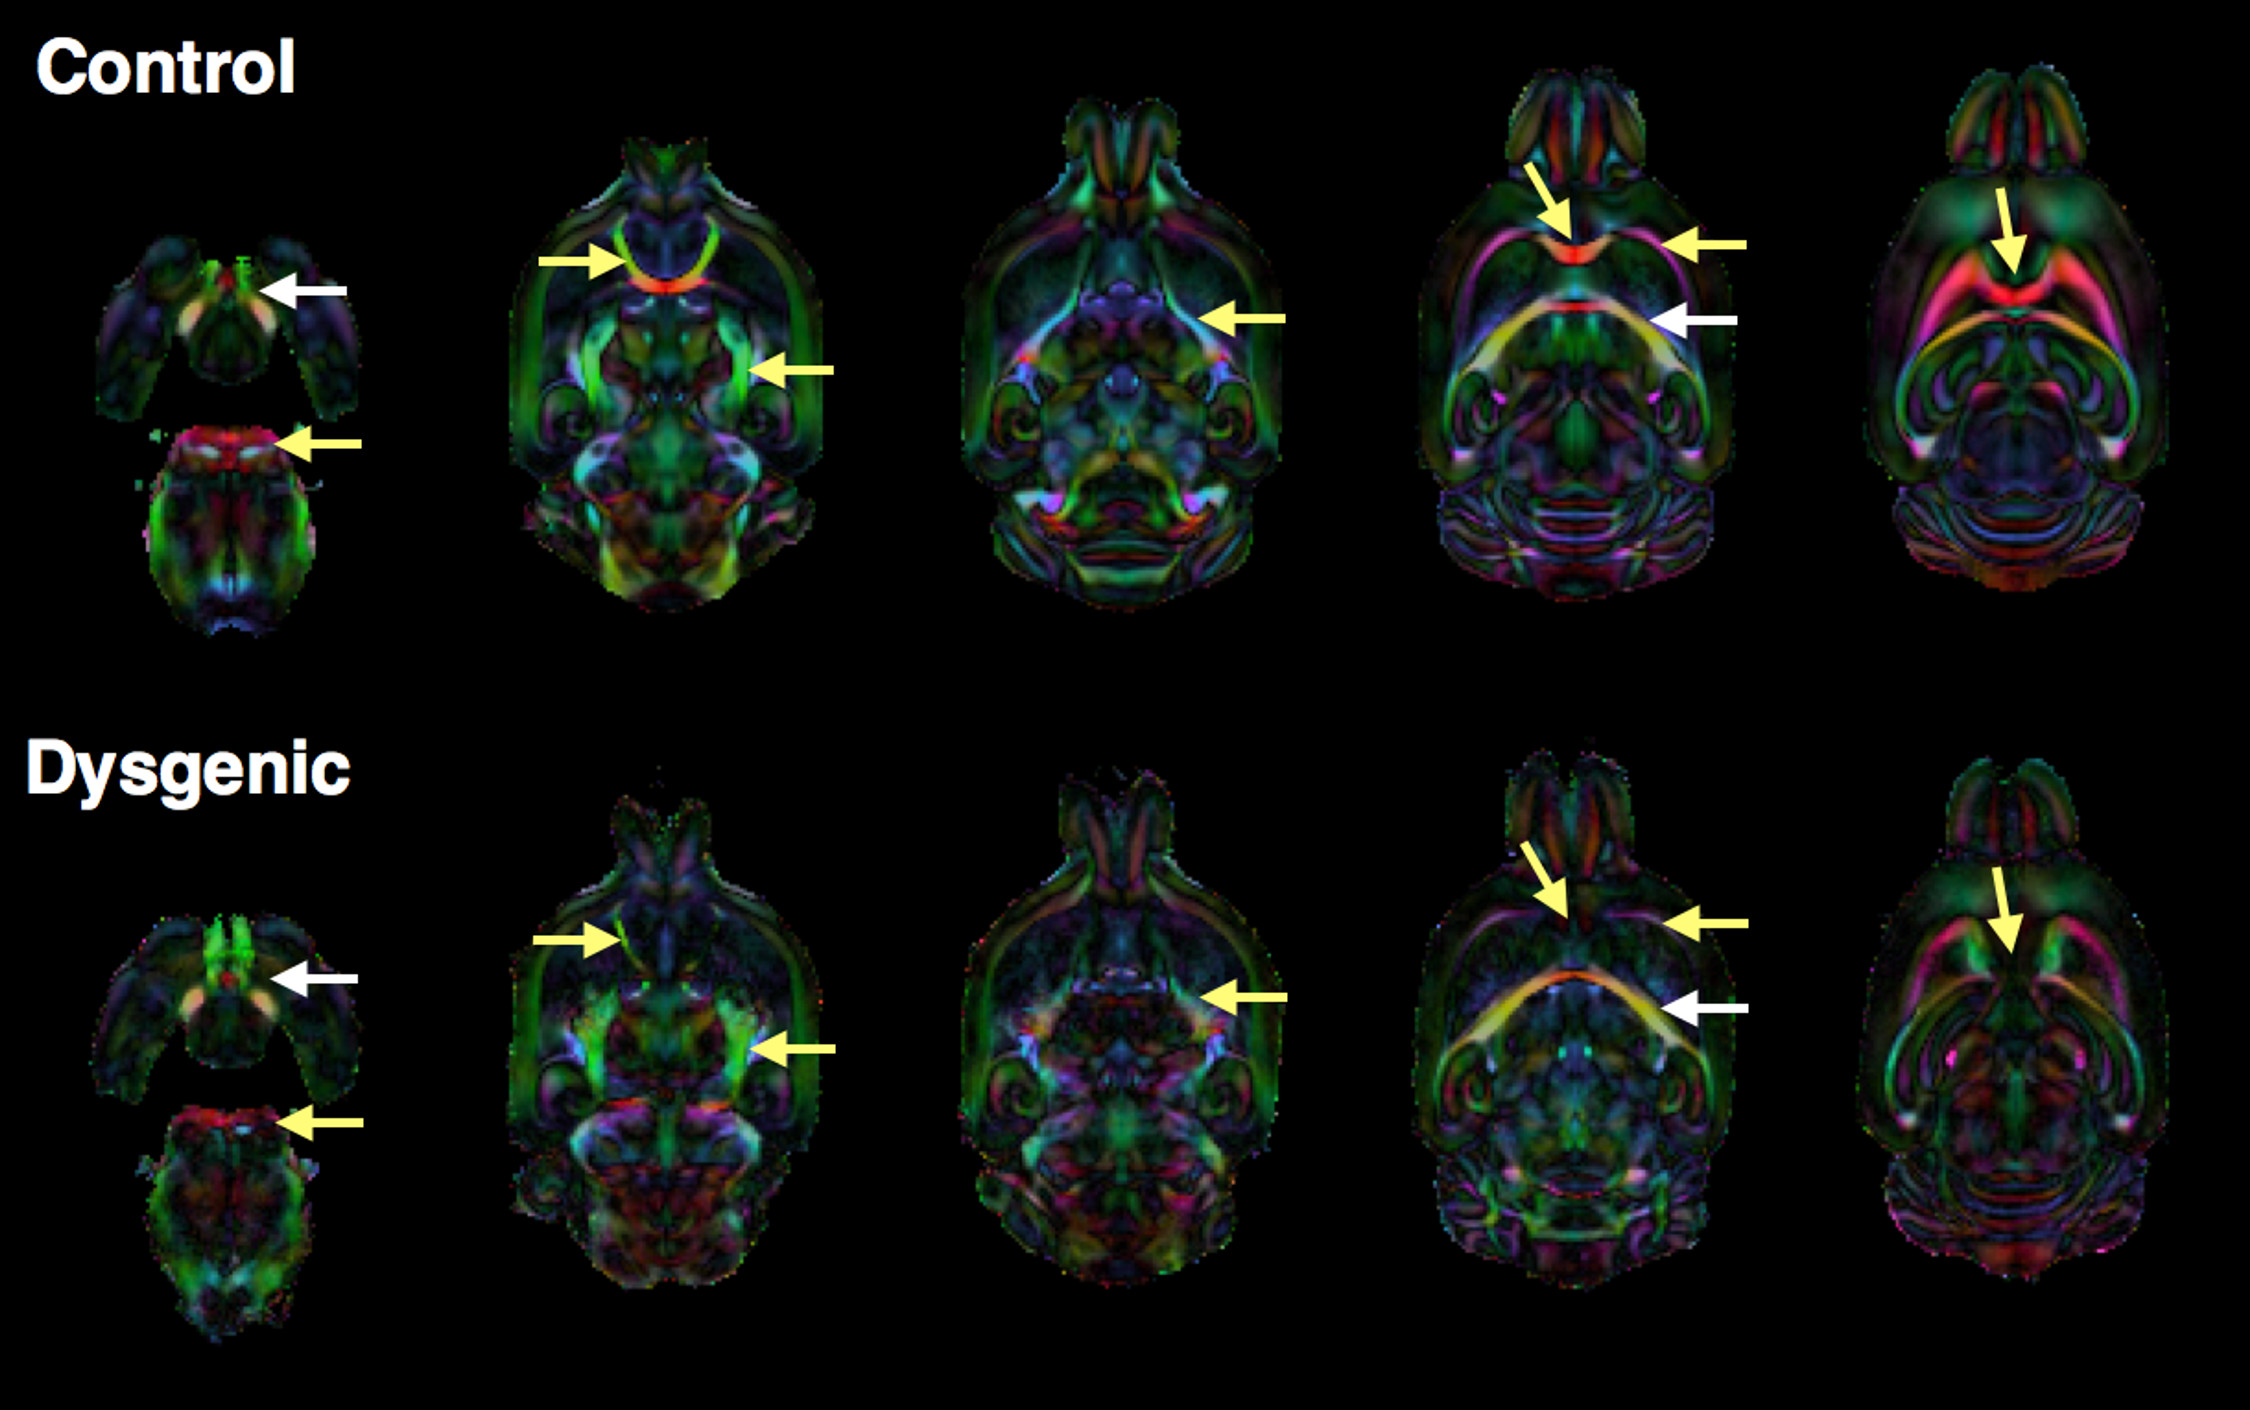
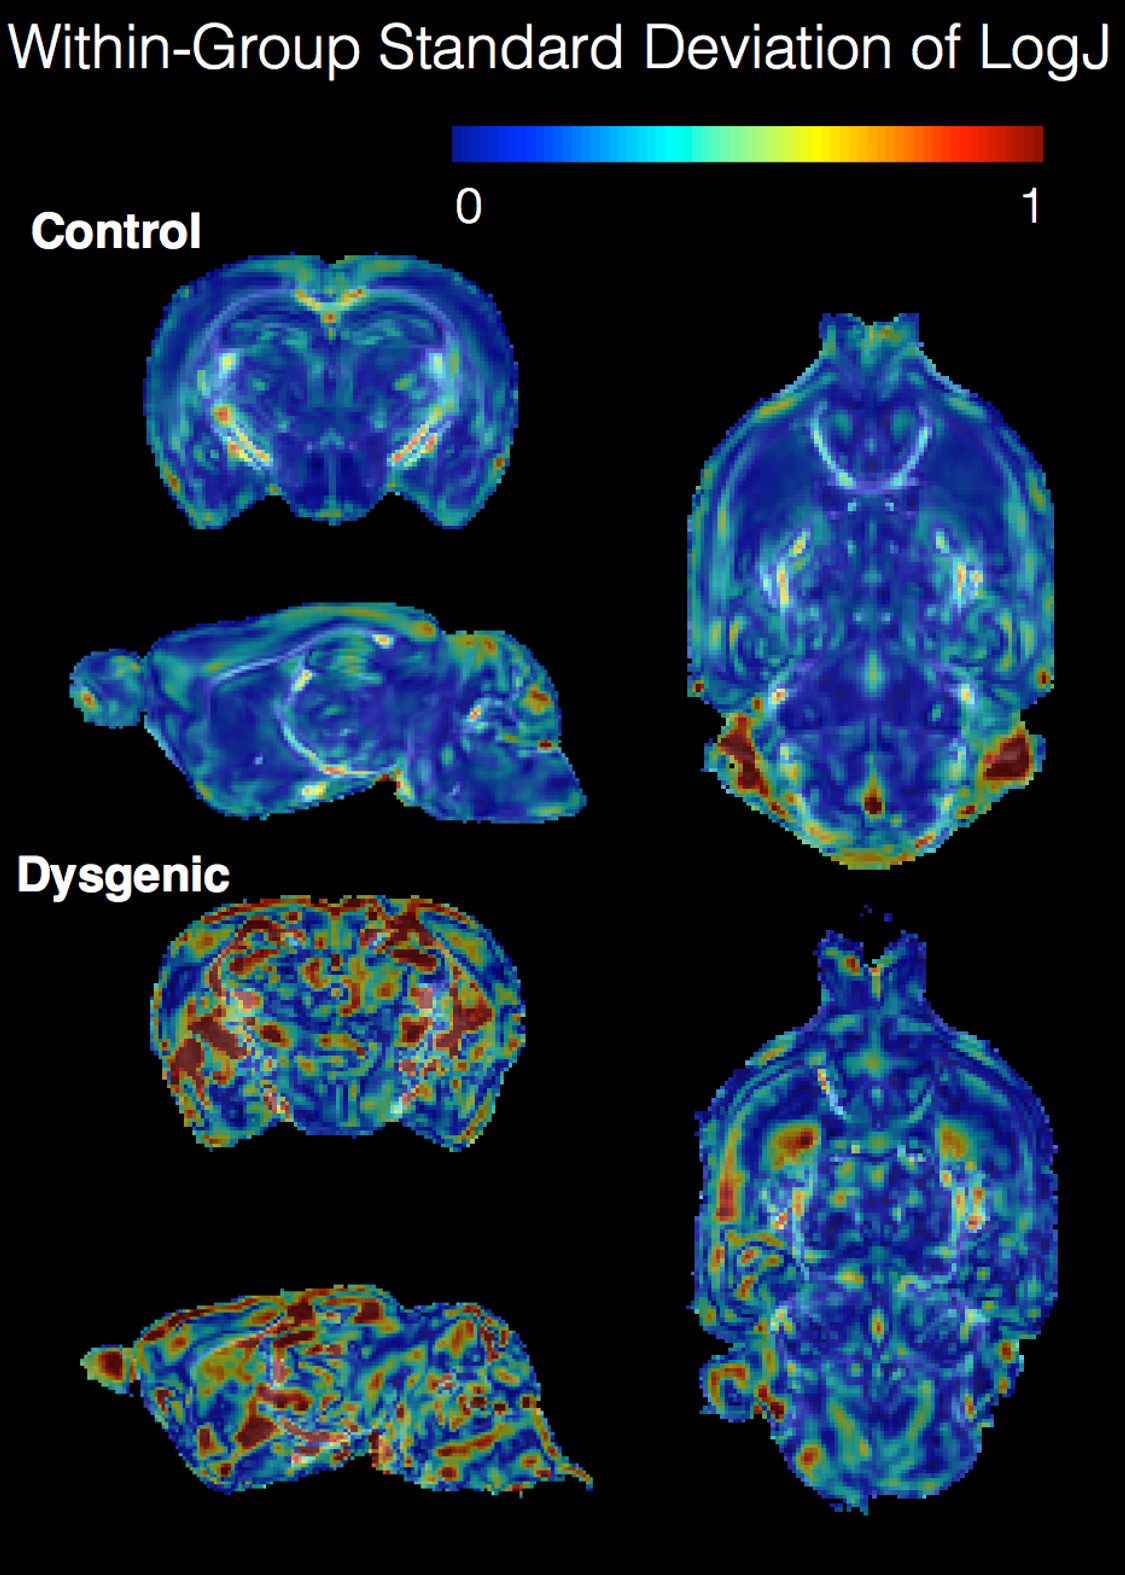
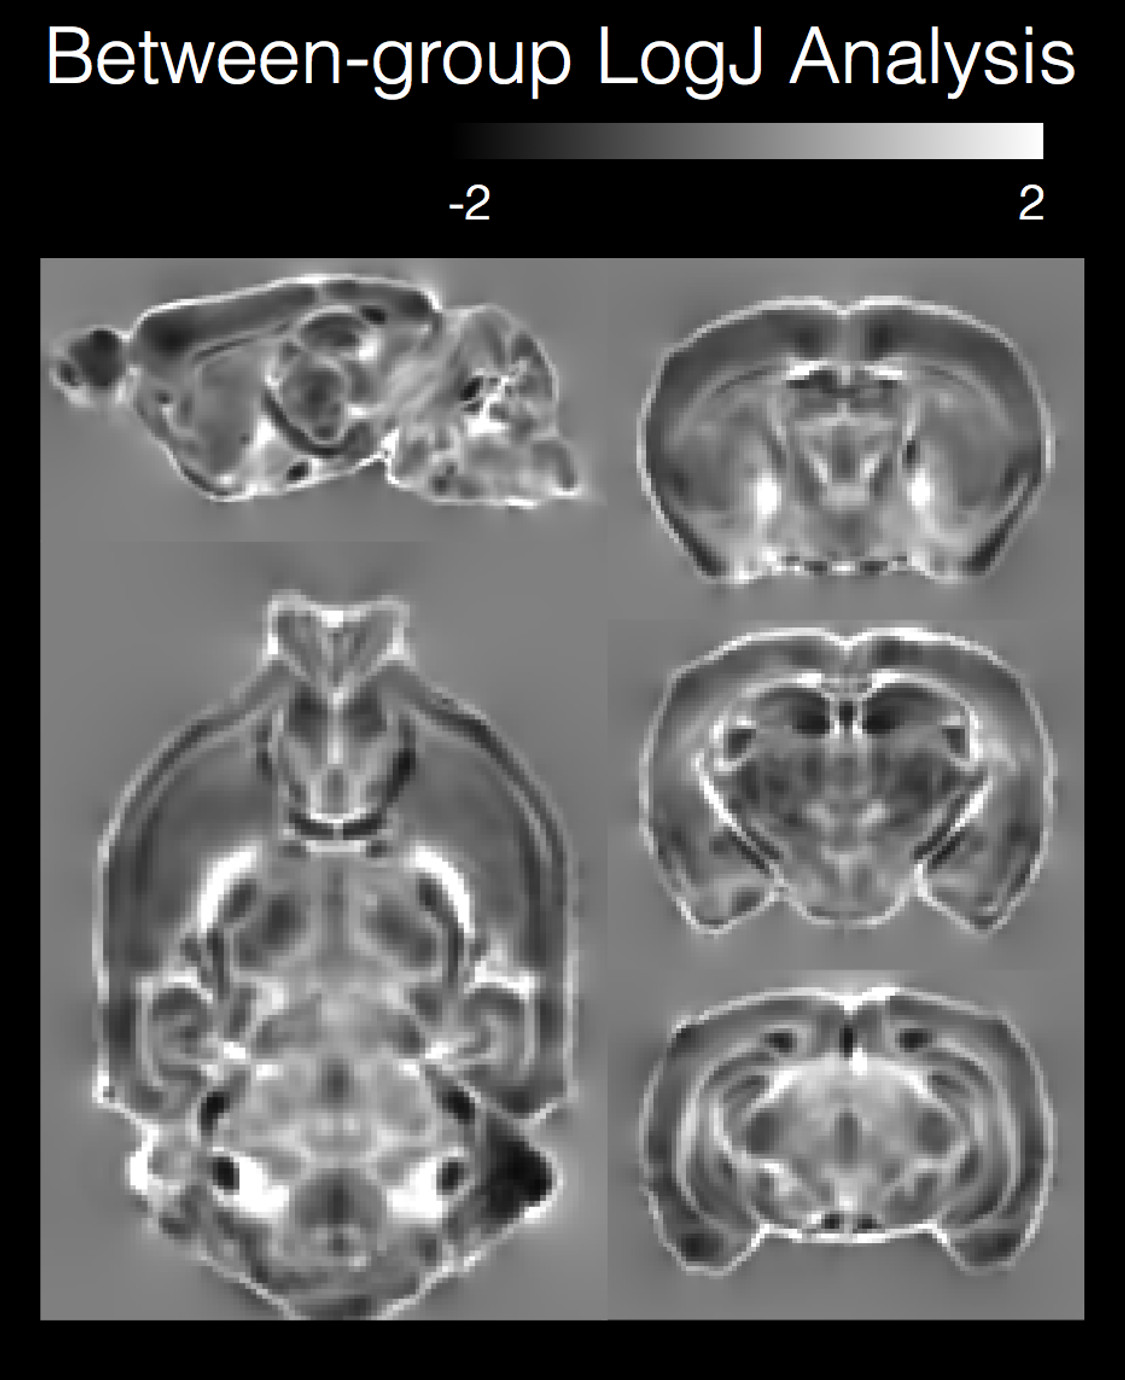
High resolution and good quality DTI templates were generated for each group of mouse brains in this study with 100 micron isotropic resolution and high contrast between anatomical structures to allow visualization and analysis of most white matter tracts and gray matter regions in the mouse brain. Robust qualitative differences were observed between the dysgenic mouse brain DEC maps and the control maps (figure 2) that were consistent with previous DTI studies of white matter dysgenesis in mice(7,8). In particular, DEC maps showed agenesis of the corpus callosum with Probst bundles, agenesis of anterior commissure with asymmetry and abnormal trajectory of the anterior fibers of the AC and abnormalities of the cortico-spinal tract. Within-group analysis of standard deviation maps of LogJ values (Figure 3) revealed greater variance in the dysgenic maps compared with the control. This indicates that in addition to abnormal anatomy, there is greater variability in morphology across brains with this genetic mutation. Between-group analysis of the LogJ maps from registration of the dysgenic template to the control template (figure 4) indicates a 15% lower total brain volume estimated from the affine-only registration and a pattern of local volume abnormalities from the nonlinear-only registration (i.e. local volume differences after correction for global scaling) that was consistent with the qualitative inspection of the DEC maps in figure 2 and also identified regions of GM that were morphologically abnormal such as the cortex and hippocampus.Discussion and Conclusions
The main benefit of the D-TBM technique is to allow TBM to take advantage of the all information contained in the diffusion tensor resulting in a faithful anatomic registration of both WM tracts, CSF and GM regions(1). This implies that the resulting deformation fields are more informative than structural MRI (e.g. T1 weighted images) based morphology techniques for detecting differences in WM tract morphology and also maintain the ability to detect differences in GM regions where registration is more dependent on edge contrast and generally problematic for tensor-only registration. In this study, LogJ analysis of DRTAMAS-generated deformation fields was able to sensitively detect both WM and GM abnormalities in genetic mouse models of abnormal axon guidance. Within-group analysis provided insight about the increased variability of morphological abnormality across brains in the experimental group. Between-group analysis provided bias-free, quantitative and whole brain evidence for morphological abnormalities in both WM and GM. Taken together, D-TBM is a unique and promising tool to detect and characterize abnormal neuroanatomy.Acknowledgements
The authors would like to thank the Mouse Imaging Facility at the NIH for micro-MRI facilities and intramural SQITS/NICHD resources for funding MRI scanning.References
1. Sadeghi NT, C.; Irfanoglu, O.; Nayaka, A.; D'Angelo, M.; Arrigoni, F.; Pierpaoli,C.;. Deformation Analysis of Diffusion Tensor Data: Application to Hereditary Spastic Paraplegia. ISMRM. Singapore, SA2016.
2. Ashburner J, Hutton C, Frackowiak R, Johnsrude I, Price C, Friston K. Identifying global anatomical differences: deformation-based morphometry. Human brain mapping 1998;6(5-6):348-357.
3. Irfanoglu MO, Nayak A, Jenkins J, Hutchinson EB, Sadeghi N, Thomas CP, Pierpaoli C. DR-TAMAS: Diffeomorphic Registration for Tensor Accurate Alignment of Anatomical Structures. NeuroImage 2016;132:439-454.
4. Irfanoglu MO, Modi P, Nayak A, Hutchinson EB, Sarlls J, Pierpaoli C. DR-BUDDI (Diffeomorphic Registration for Blip-Up blip-Down Diffusion Imaging) method for correcting echo planar imaging distortions. NeuroImage 2015;106:284-299.
5. Pierpaoli C, Barnett A, Basser P, Chang L, Koay C, Pajevic S, Rohde G, Sarlls J, Wu M. TORTOISE: an integrated software package for processing of diffusion MRI data. ISMRM 2010.
6. Ashburner J, Friston K. Morphometry. Morphometry 2003.
7. Ren T, Zhang J, Plachez C, Mori S, Richards LJ. Diffusion tensor magnetic resonance imaging and tract-tracing analysis of Probst bundle structure in Netrin1- and DCC-deficient mice. The Journal of neuroscience : the official journal of the Society for Neuroscience 2007;27(39):10345-10349.
8. Fenlon LR, Liu S, Gobius I, Kurniawan ND, Murphy S, Moldrich RX, Richards LJ. Formation of functional areas in the cerebral cortex is disrupted in a mouse model of autism spectrum disorder. Neural development 2015;10:10.
Figures