3356
On the Potential of DWI with Extrapolated High and Negative b-Values for Contrast Enhancement and Image Segmentation1Erwin L. Hahn Institute, University Duisburg-Essen, Essen, Germany, 2High Field and Hybrid MR Imaging, University Hospital Essen, Essen, Germany
Synopsis
A method is presented that extends the concept of calculated DWI for the generation of high tissue contrast from trace-weighted data. Using the whole range of b-values including the physically inaccessible negative b-values, image segmentation, visual hinting and ROI generation can be provided for assistance of the clinical readers. 24 patient data sets involving different pathologies were used to test the feasibility and clinical potentials of the new approach. It was found that the extrapolation to negative b-values helps to extract fluid regions, whereas internal structures of lesions and noise masking may be obtained with high b-values.
Purpose
The concept of calculated DWI (cDWI) was implemented and extended to further increase DWI lesion visibility. The method is based on the acquisition of few comparably low b-values and by extrapolation of high and of negative b-values allowing for enhanced DWI contrast of lesions and other regions-of-interest (ROI). The resulting enhanced DWI images furthermore serve for automatic image segmentation and ROI selection for suspect lesions.Methods
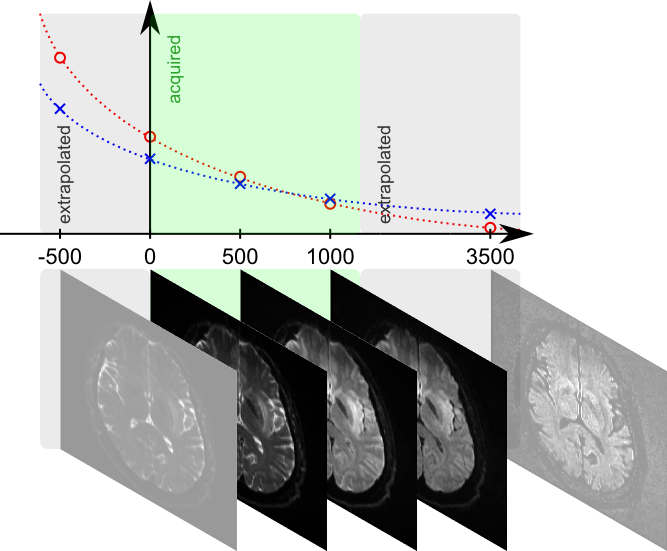
DWI images for different b-values and derived ADC maps1 can be used to extrapolate to b-values that were not acquired or that even cannot be acquired due to limitations in available scan time and/or gradient power2 (Fig. 1). Based on the underlying models, rather accurate DWI images may be calculated that represent very well measured b-values3 and support the detection of various lesions, e.g. in the abdomen4.
The resulting high DWI contrast enhancement moreover facilitates the subsequent image processing, such as the identification of interfaces between regions with different diffusion regimes, i.e. an automatic image segmentation and the placement of regions-of-interest.
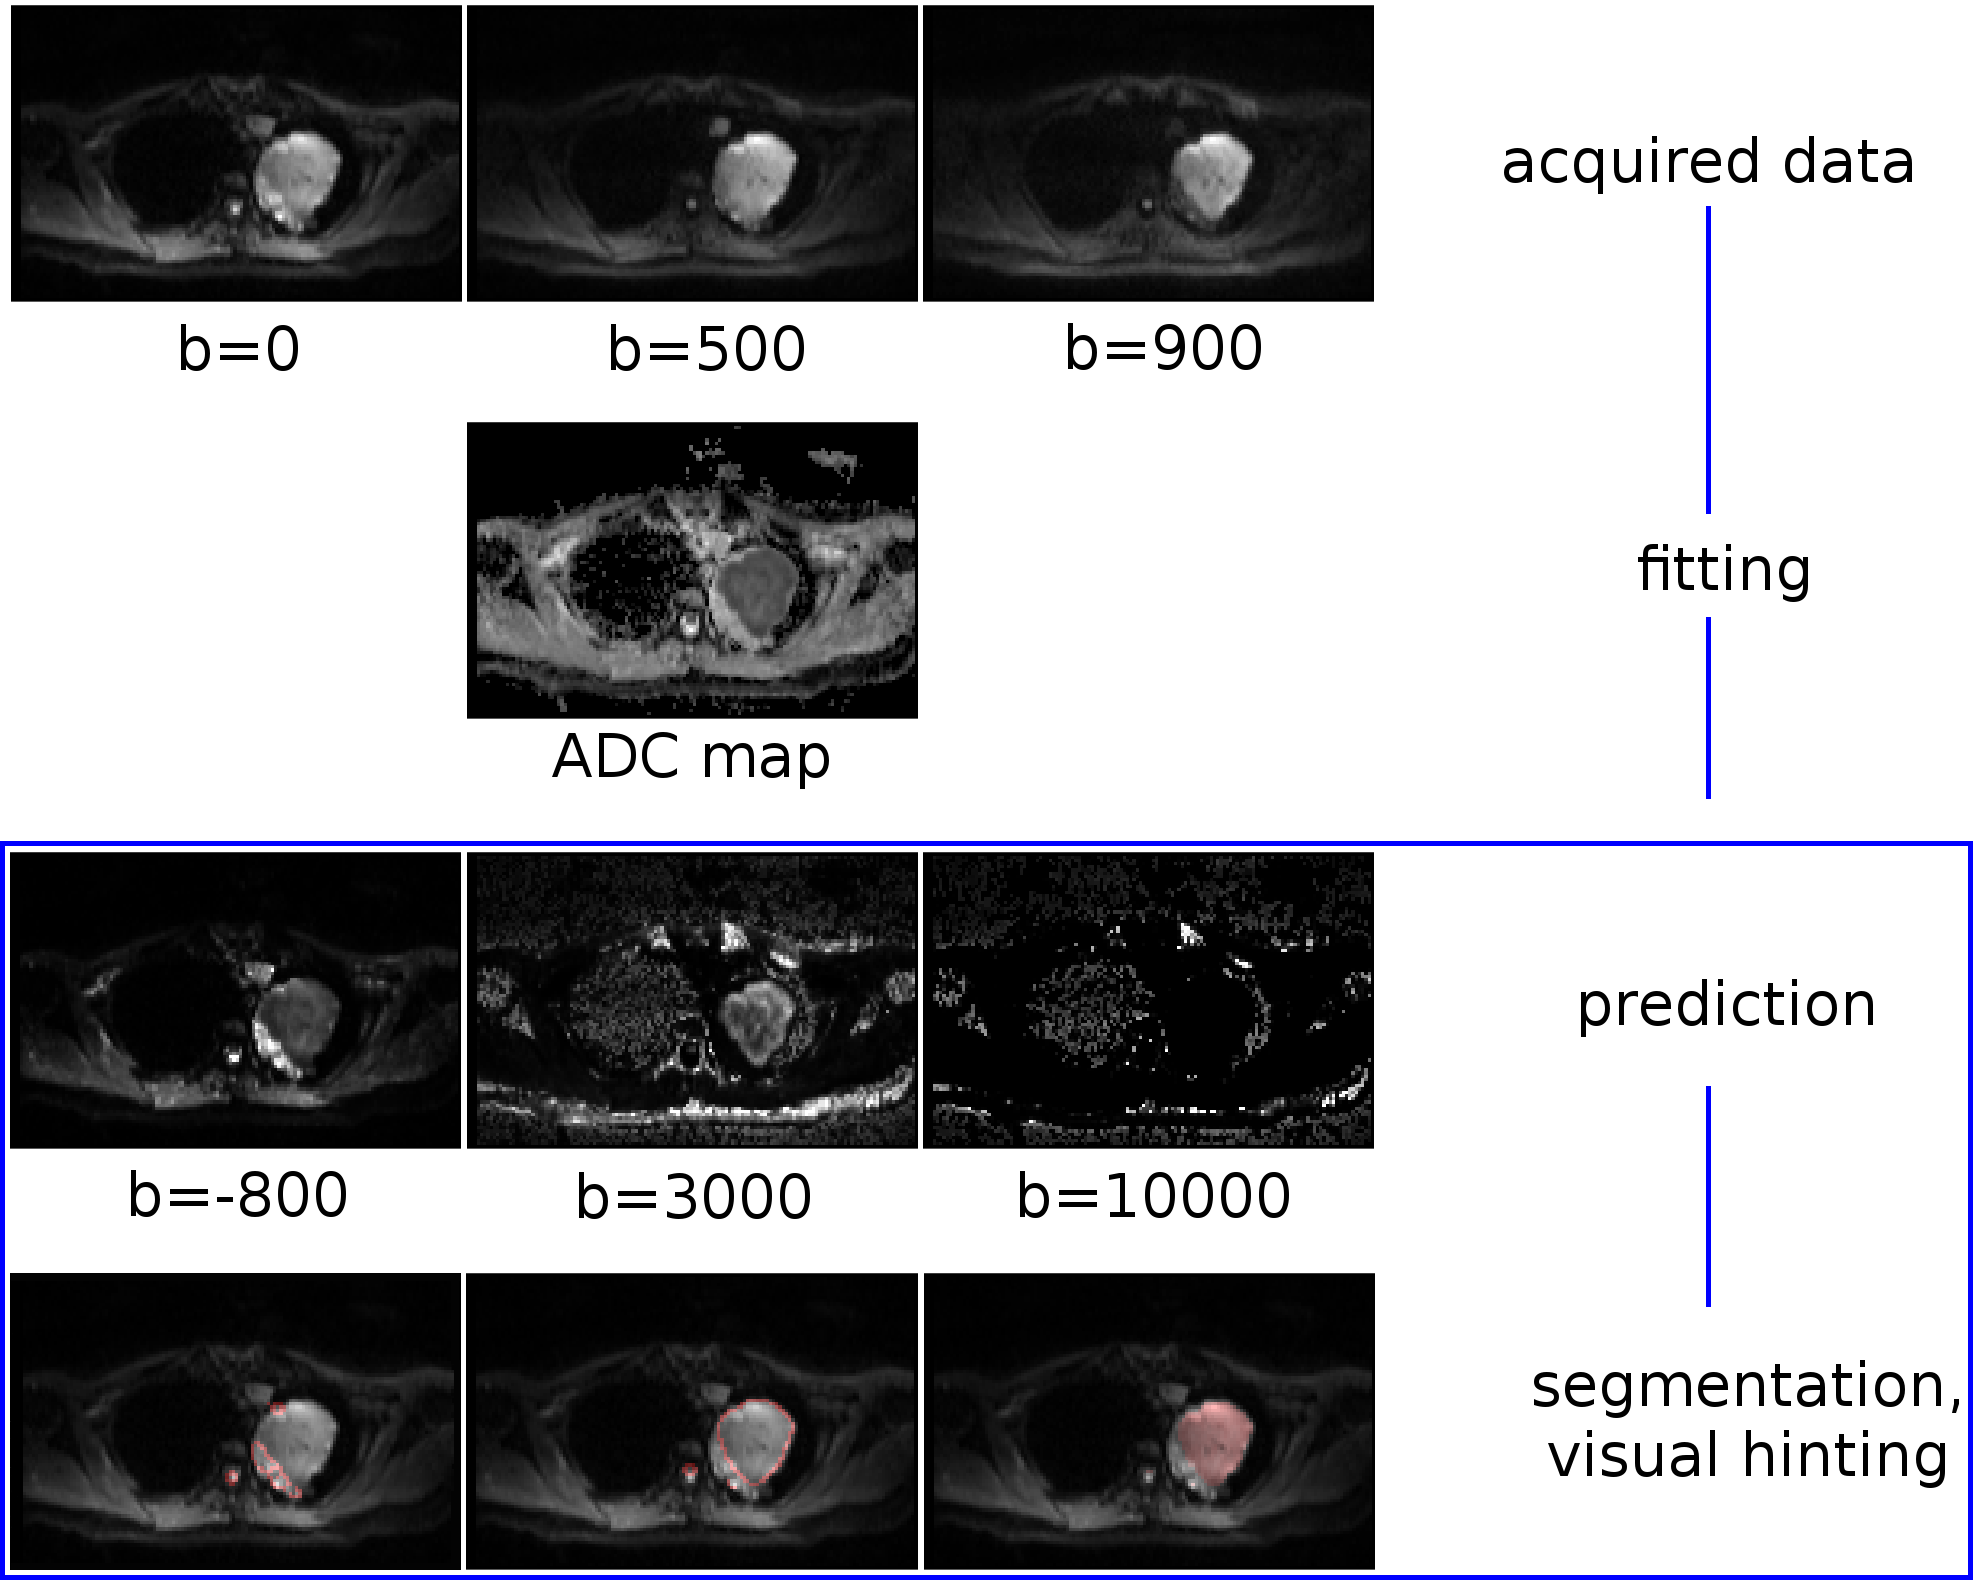
A simple mono-exponential model was chosen along with a parallelized and adapted non-negative least-square (NNLS) fit for the calculation of ADCs based on few b-values as acquired by routine DWI scans. Since no exact knowledge of the respective ADCs is needed, this model is sufficient to generate the desired high contrasts in the extrapolated images within a short time as needed for subsequent masking and edge filtering. Although being physically impossible, yet mathematically accessible, the allowed b-values were extended to the negative range. The thresholded signal region(s) and/or its edges are size filtered and with the help of simple region labeling techniques individual ROIs can be isolated to derive individual features such as size and homogeneity. Furthermore, these ROIs may consequently be overlaid on a single color channel on the originally acquired DWI images for visual hinting to the reading physician (Fig. 2).
The method was tested initially in the datasets of N = 24 patients that were acquired with a 1,5T (Magnetom Aera, Siemens Healthcare GmbH, Erlangen, Germany) and two 3T MR systems (Magnetom Skyra and Biograph mMR, Siemens) featuring various body regions (N = 5 head, N = 19 abdomen) and different pathologies.
Results
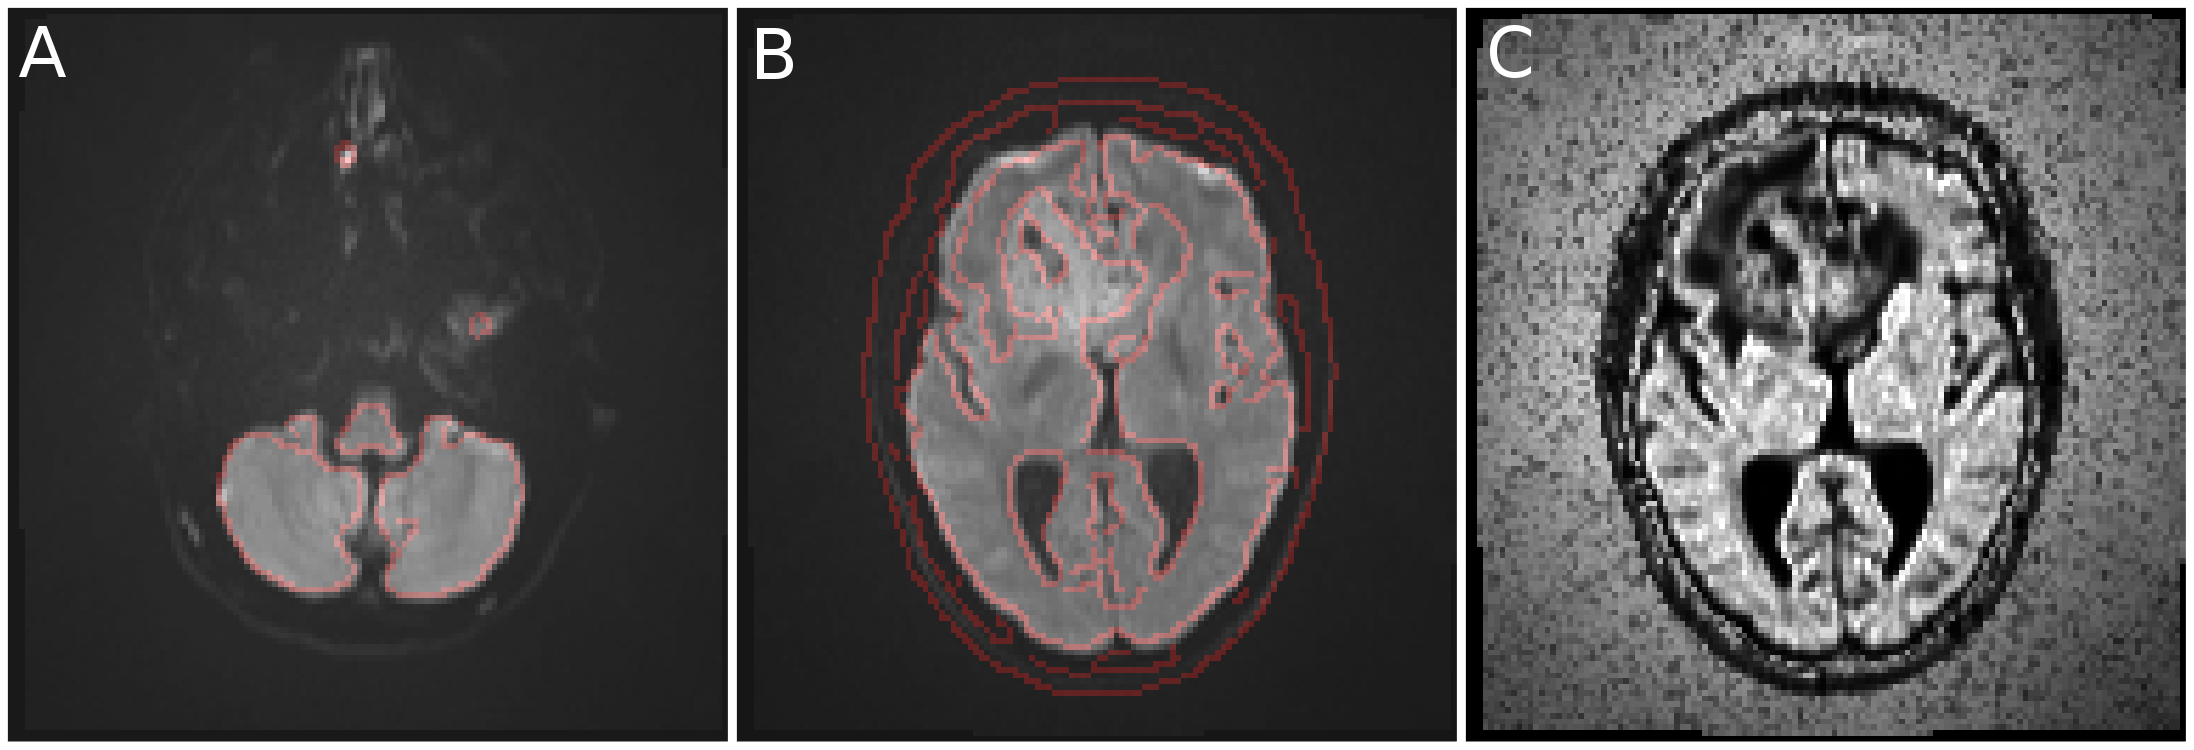
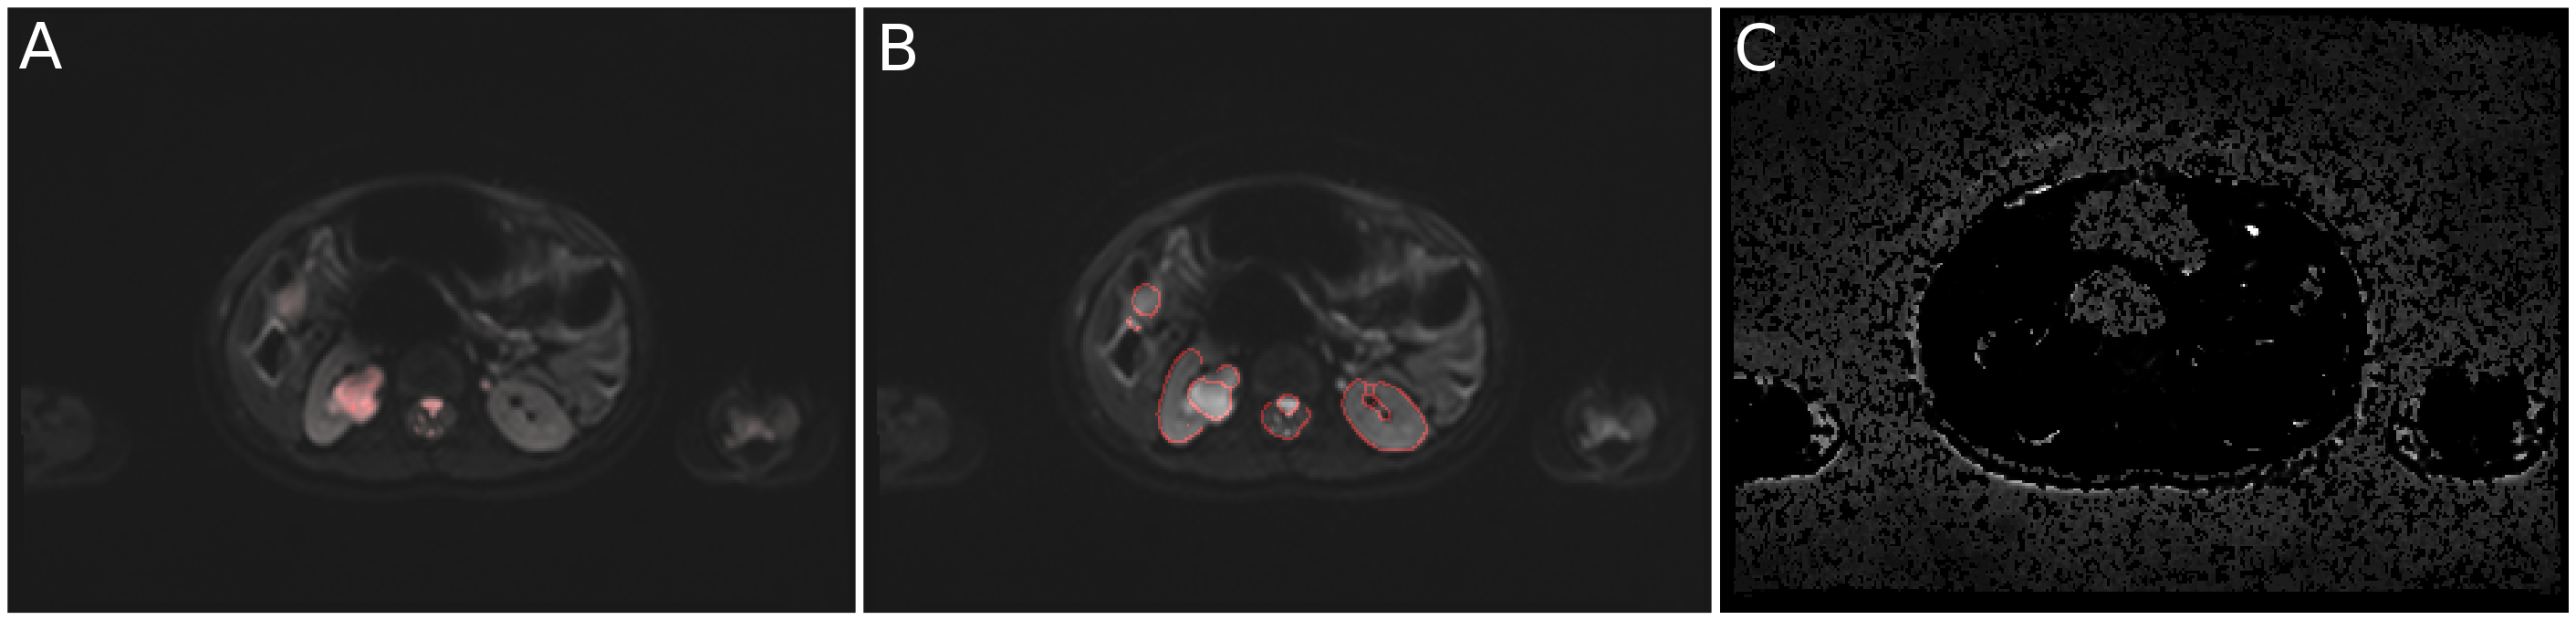
After pre-processing the data set under study, which takes a few seconds for a standard DWI slab on a conventional laptop (matrix size 320 x 240 x 40 = 3.1 million fits), the user interactively chooses a suitable b-value on a custom-written GUI and immediately can obtain the desired segmented or color marked DWI images. It was found that the appropriate segmentation of a lesion is strongly dependent on the choice of b-value. In addition to the extraction of tissues with low mobilities using high b-values, the negative b-value range turned out to be particularly useful for the isolation of fluids (such as they occur e.g. in normal cysts) and the cerebellum. Signal-to-noise in these calculated images is excellent and thus enables robust detection of boundaries. Thus, contrasts originating from b-values between -1500 and 4000 proved to be particularly useful to extract ROIs, anatomy or internal lesion structures and extrusion into healthy tissue (see Fig. 2 and 3) using trace-weighted images only. As a side effect, negative b-values on the order of -1000 to -500 emphasize anatomy in the imagery of the abdomen such that kidneys and spleen can be easily extracted from the image (Fig. 4B).
Furthermore, very high b-values of 10000 and beyond emphasize noise (with ADC ~ 0) in the picture (Fig. 2C and 3C), while the actual tissue signal virtually decays below the noise level. This can be used for noise masking in the original data, rather than using simple noise thresholding.
Discussion and Conclusion
While the presented method may not replace conventional procedures for DWI image evaluation, it yet provides a rather straightforward approach to increase DWI contrast and to assist reading physicians in the detection and evaluation of pathologies in DWI data. Particularly the time-consuming image segmentation into ROIs can be automatized to a great extent and desired quantities can be derived in a reproducible and standardized way. This concept can be easily extended to enable e.g. 3D rendering of the segmented target regions. Due to the exponential nature of most MR signal decays, the presented approach can directly be adapted to T1, T2 and T2* mapping data and thus enhances its significance even more. Studies to evaluate the clinical impact of this method on diagnostic DWI imaging are currently under investigation.Acknowledgements
No acknowledgement found.References
1. Le Bihan and Breton. Imagerie de diffusion in-vivo par résonance magnétique nucléaire. C R Acad Sci (Paris) 1985;15:1109–1112
2. Bittencourt LK, Attenberger UI, Lima D, et al. Feasibility study of computed vs measured high b-value (1400 s/mm²) diffusion-weighted MR images of the prostate. World J Radiol. 2014;6(6):374-80
3. Mazzoni LN, Lucarini S, Chiti S, et al. Diffusion-weighted signal models in healthy and cancerous peripheral
prostate tissues: comparison of outcomes obtained at different
b-values. JMRI 2014;39:512–518
4. Verma S, Sarkar S, Young J, et al. Evaluation of the impact of computed high b-value diffusion-weighted imaging on prostate cancer detection. Abdom Radiol (NY) 2016;41(5):934-45
Figures