3333
Accelerating Diffusion Kurtosis Imaging Using Model Based Denoising1GE Global Research, Garching, Germany, 2Technische Universität München, Munich, Germany, 3GE Global Research, Niskayuna, NY, United States
Synopsis
Diffusion Kurtosis Imaging (DKI) suffers from high sensitivity to noise and therefore requires long scanning times (up to 150 diffusion weighted images, DWIs). This work proposes a model-based denoising technique to overcome this limitation: A generalized multi-shell spherical deconvolution model is formulated and DWIs are denoised by a projection into the space spanned the model. We demonstrate noise reduction for DKI metrics yielding improved image quality of kurtosis maps from as few as 30 DWIs. This corresponds to greater than four-fold reduction in scan time as compared to the widely used 140-DWI acquisitions.
Purpose
A model-based denoising technique based on generalized spherical deconvolution is proposed to reduce the lengthy acquisition times of Diffusion Kurtosis Imaging (DKI).Methods
Spherical Deconvolution1,2 (SD) models HARDI-data as a linear superposition of elementary Gaussian decays with a fixed diffusion constant. While this is a highly simplified representation of the underlying microstructure, SD provides fiber orientation distributions (FODs) that allow resolution of (potentially crossing) white matter (WM) fiber directions. Recently the model was extended to a multi-shell multi-tissue (MSMT) approach3 by adding two isotropic basis functions (for gray matter (GM) and CSF, respectively) to successfully reduce partial-volume effects. This work proposes a further generalization of MSMT-SD called genSD, modelling the signal as
$$\hat{S}(b,q)=\sum_{j=1}^J\sum_{n=1}^N f_{aniso,j,n}\exp\left(\lambda_{\parallel,j} b(q^Tu_n)^2 \right)\exp(-\lambda_{\perp,j}b(1-(q^Tu_n)^2))+\sum_{k=1}^Kf_{iso,k}\exp(-\lambda_{iso,k}b)$$
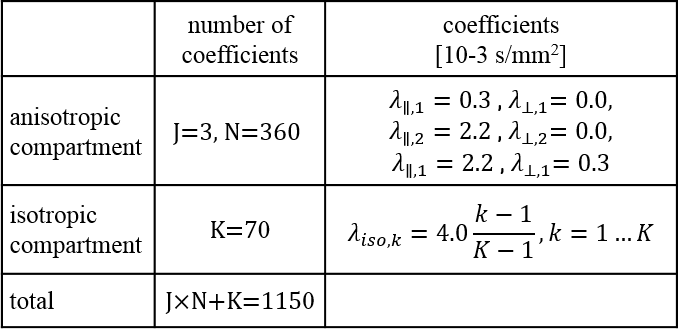
with diffusion encoding direction q, b-value b, J≥1 series of anisotropic decays (diffusion constant pairs $$$\lambda_{\parallel,j}$$$, $$$\lambda_{\perp,j}$$$) in FOD-directions (tessellation of the unit sphere) and K≥1 isotropic decays (constants $$$\lambda_{iso,k}$$$). For J=1, K=2 this is equivalent to MSMT-SD and for J=1, K=0 to standard SD. Given measured multi-shell diffusion data $$$S(b,q)$$$ the unknown coefficients $$$f_{aniso,j,n}$$$ and $$$f_{iso,k}$$$ are computed using the Richardson-Lucy Algorithm2 . In contrast to SD and MSMT-SD the purpose of genSD is not to use the computed coefficients for tractography but to insert them into the forward model above and use $$$\hat{S}$$$, i.e. the projection of the data into the space spanned genSD, for tensor fitting.
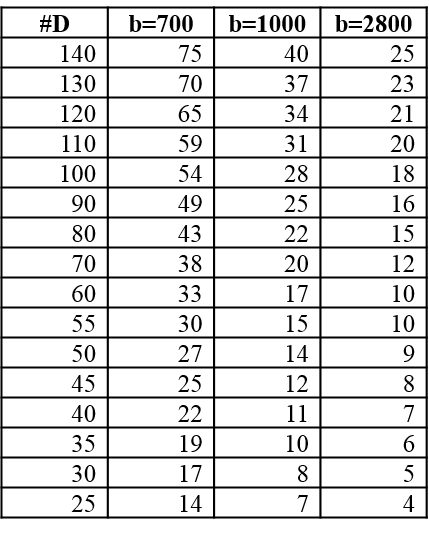
DKI data were acquired from 20 healthy volunteers (3T GE MR750 (GE Healthcare, Milwaukee, WI, USA), 32-channel head coil (Nova Medical, Wilmington, MA, USA), single shot EPI, single spin echo, multiband factor 3, ASSET factor 2, 2.5 mm isotropic resolution) using a 3-shell 140-direction scheme4 (25-40-75 directions with b = 700, 1000, 2800 mm2/s, respectively) and 8 b=0 images.
After affine distortion correction, the 140-direction data sets were used to generate 16 “accelerated DKI acquisitions”, i.e. subsets of the original data comprising #D directions (c.f. Tab. 1). The subsampling was performed by randomly drawing the desired number of directions per shell. This drawing was repeated 1000 times and the sampling pattern with the lowest “electrostatic potential” both within and across shells5 was chosen, maximizing angular incoherence. The proposed genSD-denoising was applied to both, the 140-direction data and the accelerated data sets, using heuristically tuned parameters (c.f. Tab. 2). The diffusion and kurtosis tensor was fitted to all data using a weighted linear-least squares estimator6. Derived metrics were computed including Fractional Anisotropy (FA), parallel (Kpar) and orthogonal Kurtosis (Korth) and Kurtosis Anisotropy7 (FAK).
Results
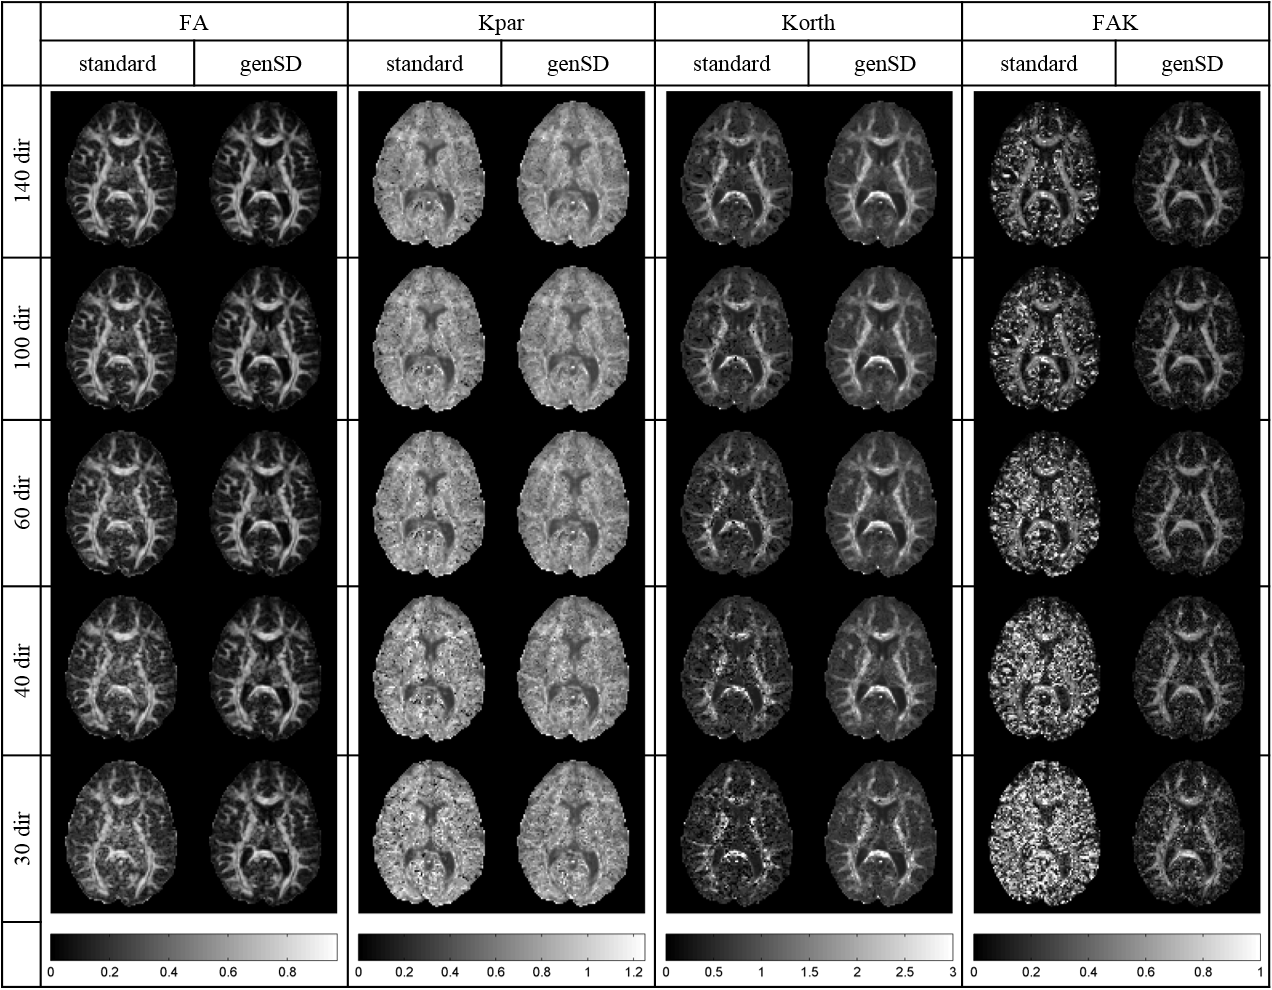
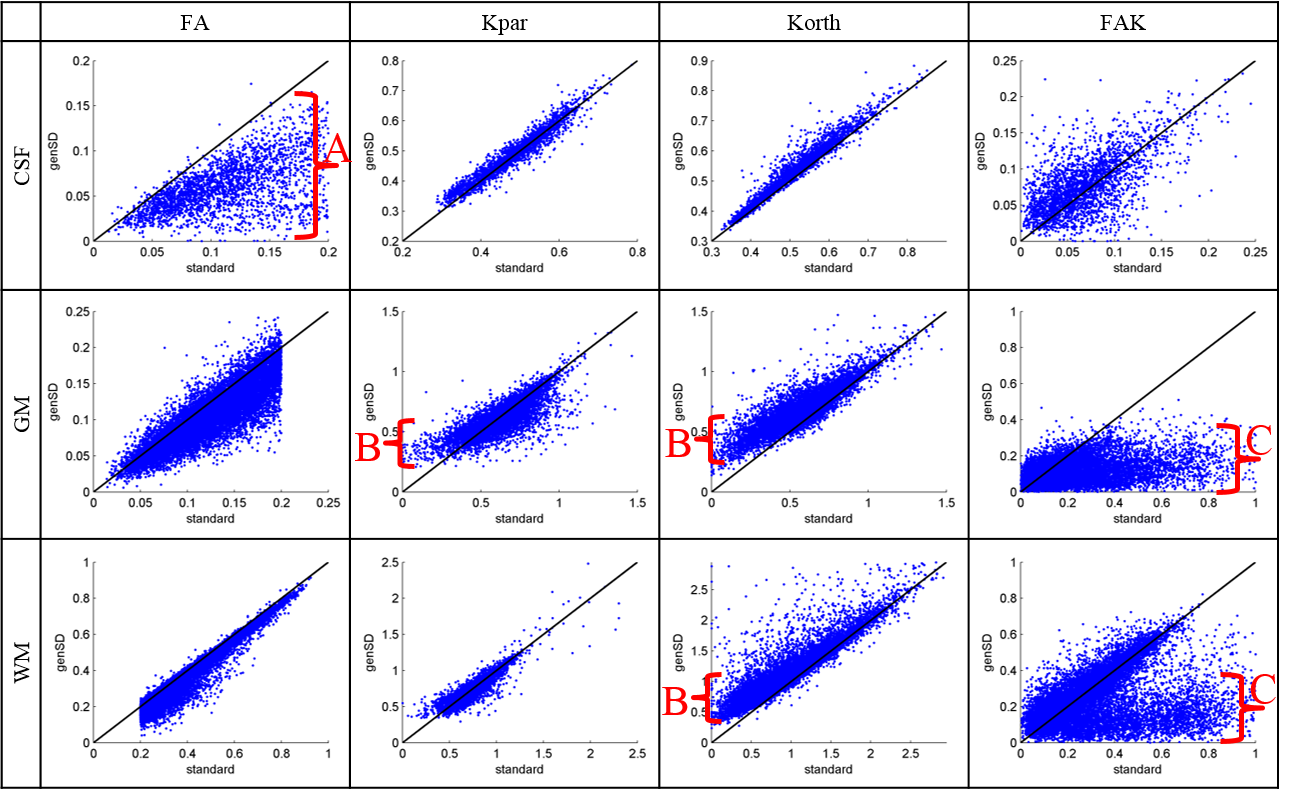
Fig. 1 displays FA and kurtosis maps of an exemplary subject and slice for #D=140, 100, 60, 40, 30 both with and without genSD denoising. The denoised maps appear less noisy, contain fewer outliers and better preserve the original contrast when going to higher accelerations. Fig. 2 shows scatter plots of the same metrics confirming the findings from Fig. 1, particularly the noise reduction (e.g. reduced FA in CSF marked with “A”) and the suppression of outliers (“C”, corresponding to a removal of “hot pixels” in the FAK maps). We also note increase of low-kurtosis values (“B”) corresponding to a reduction of signal voids in the maps. While genSD tends to add a small bias to the metrics, this loss in accuracy is small compared to the improved precision.
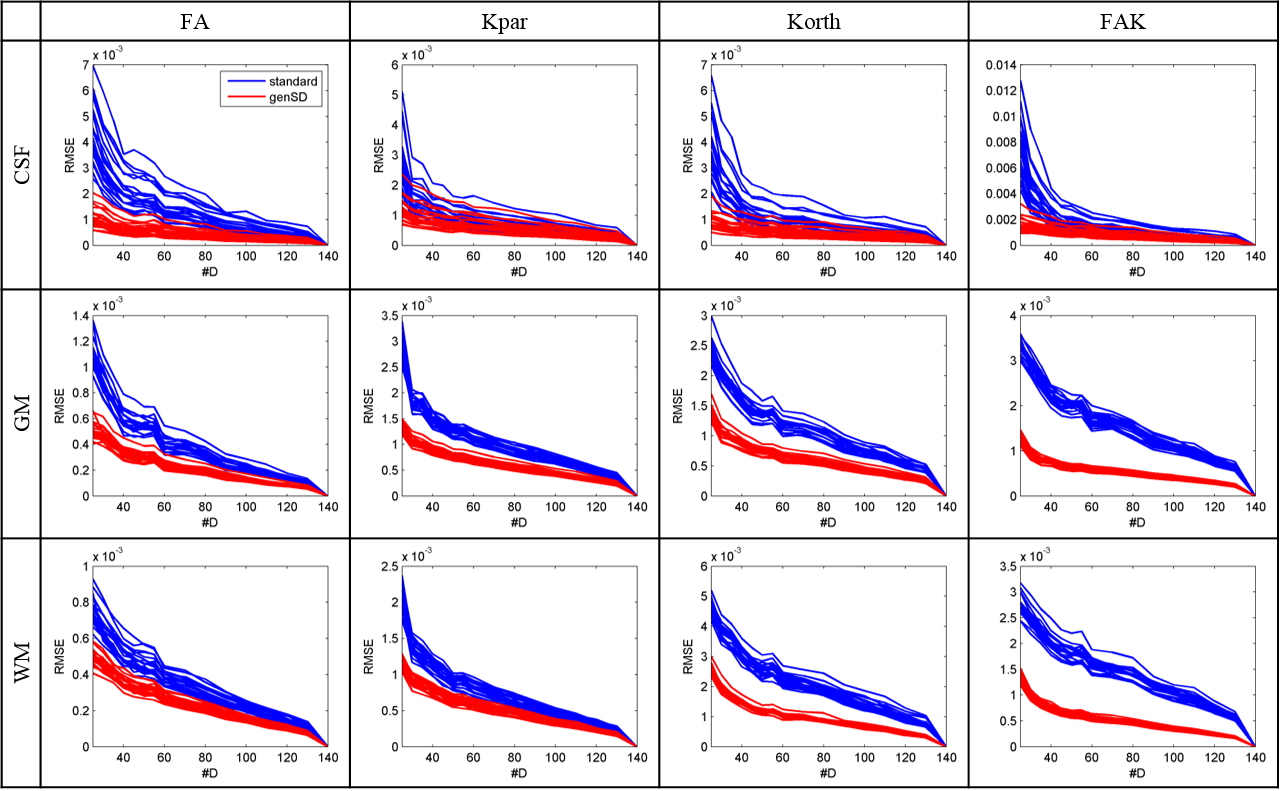
Fig. 3 displays the root mean squared error (RMSE) of the selected metrics (normalized by the voxel count) for all subjects as a function #D. Due to the lack of a ground truth, the #D=140 data (with and without denoising) serve as references for computing the RMSE. Using genSD the RMSE grows more slowly, indicating improved stability relative to the standard approach, as #D is reduced. These results are very consistent across all subjects, indicating the robustness of genSD using a fixed set of model parameters.
Discussion
This work demonstrates the denoising capabilities of a generalized spherical deconvolution model to DKI. It enables high-quality kurtosis imaging using just 30 DWIs enabling the use of highly noise-sensitive metrics like FAK. Because the model is very general due to its high degrees of freedom (1150 free parameters), the projection only marginally affects most data points but suppresses signals exhibiting non-monotonicity decay. Such a non-monotonic behavior can (at least for biological tissue) be considered an artefact and is primarily caused by the positive bias of the noise floor. DKI is particularly sensitive to this effect6 as the kurtosis information is essentially contained in the high-b data. Thus, the derived DKI maps benefits significantly from genSD-denoising.Acknowledgements
Tim Sprenger gratefully acknowledges the support of the Graduate School of Information Science in Health (GSISH) at Technische Universität München.References
1. J. D. Tournier, F. Calamante, D. G. Gadian und A. Connelly, „Direct estimation of the fiber orientation density function from diffusion-weighted MRI data using spherical deconvolution,“ Neuroimage, Bd. 23, Nr. 3, pp. 1176-85, 2004.
2. F. Dell'Acqua, G. Rizzo, P. Scifo, R. A. Clarke, G. Scotti und F. Fazio, „A model-based deconvolution approach to solve fiber crossing in diffusion-weighted MR imaging,“ IEEE Trans Biomed Eng, Bd. 54, Nr. 3, pp. 462-72, 2007.
3. B. Jeurissen, J. D. Tournier, T. Dhollander, A. Connelly und J. Sijbers, „Multi-tissue constrained spherical deconvolution for improved analysis of multi-shell diffusion MRI data,“ Neuroimage, Bd. 103, pp. 411-26, 2014.
4. D. H. Poot, A. J. den Dekker, E. Achten, M. Verhoye und J. Sijbers, „Optimal experimental design for diffusion kurtosis imaging,“ IEEE Trans Med Imaging, Bd. 29, Nr. 3, pp. 819-29, 2010.
5. E. Caruyer, C. Lenglet, G. Sapiro und R. Deriche, „Design of multishell sampling schemes with uniform coverage in diffusion MRI,“ Magnetic Resonance in Medicine, Bd. 69, Nr. 6, pp. 1534-1540, 2013.
6. J. Veraart, J. Sijbers, S. Sunaert, A. Leemans und B. Jeurissen, „Weighted linear least squares estimation of diffusion MRI parameters: strengths, limitations, and pitfalls,“ Neuroimage, Bd. 81, pp. 335-46, 2013.
7. L. Qi, D. Han und E. X. Wu, „Principal invariants and inherent parameters of diffusion kurtosis tensors,“ Journal of Mathematical Analysis and Applications, Bd. 349, Nr. 1, pp. 165-180, 2009.
Figures